2017 TMP_FEP1_FB Low Violations
TMP_FEP1_FB Planning Low Limit Violations
Date start |
Date stop |
Min temperature |
Duration (ks) |
Plot |
|---|---|---|---|---|
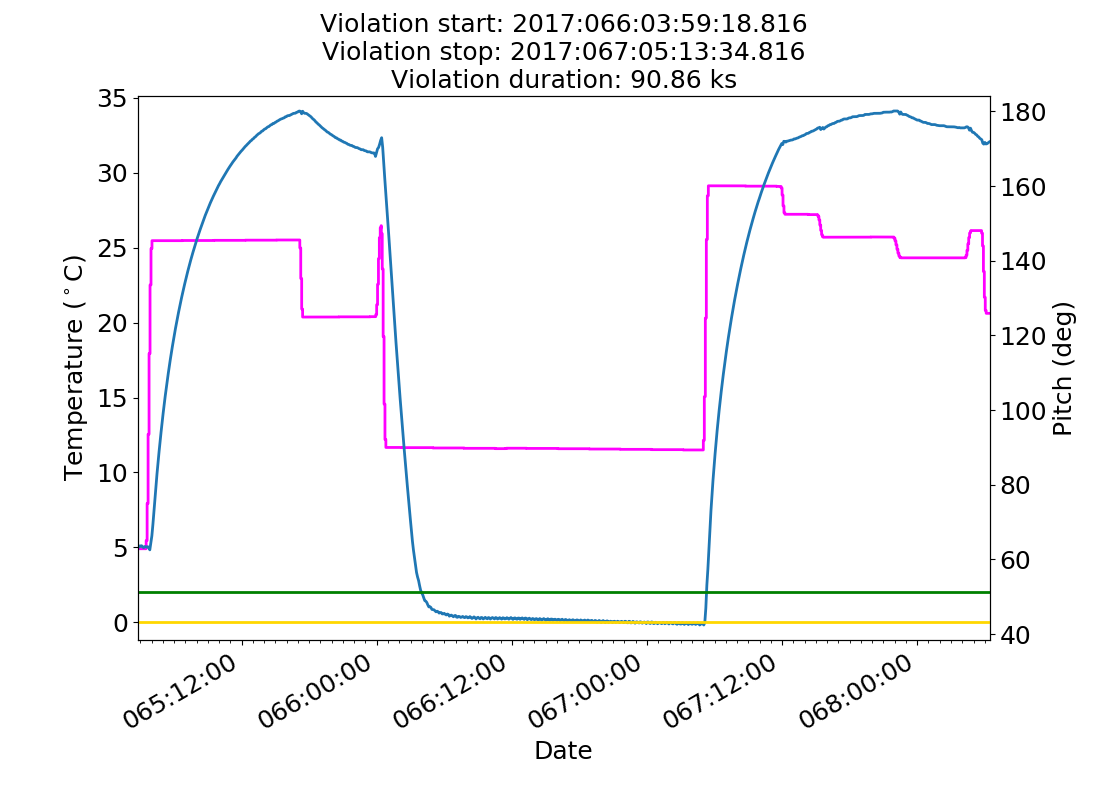
2017:066:03:59:18.816 |
2017:067:05:13:34.816 |
-0.17 |
90.86 |
|
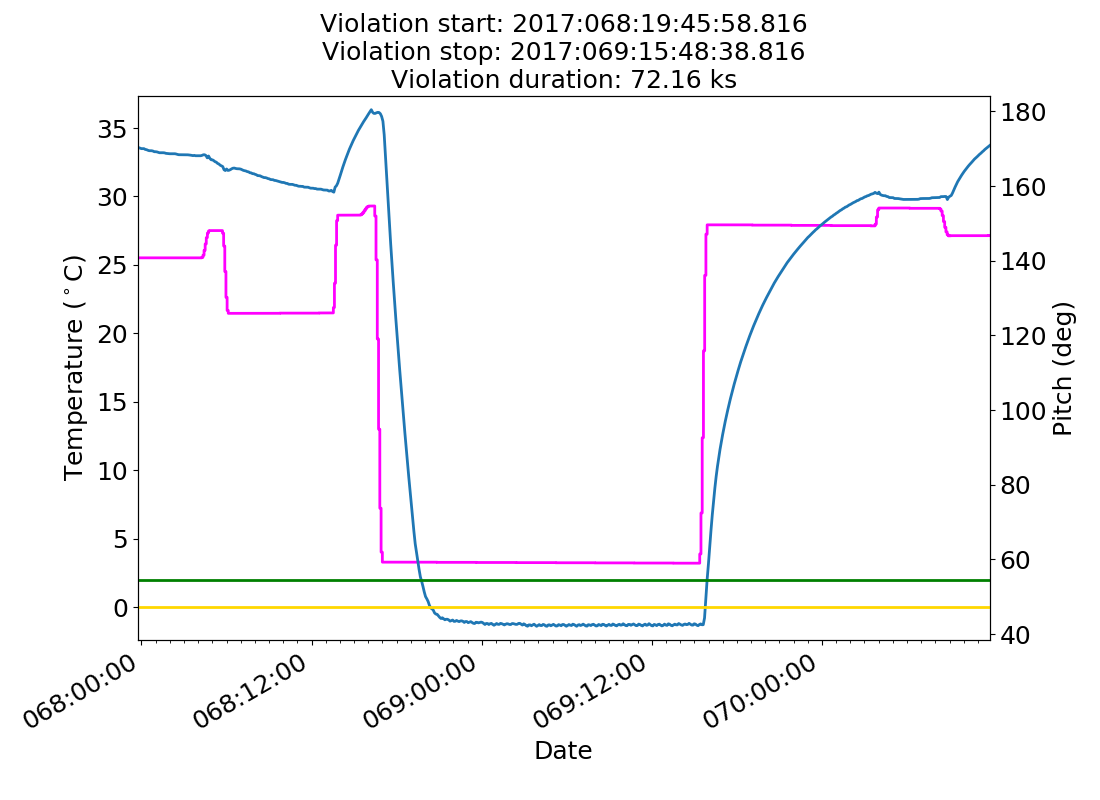
2017:068:19:45:58.816 |
2017:069:15:48:38.816 |
-1.40 |
72.16 |
|
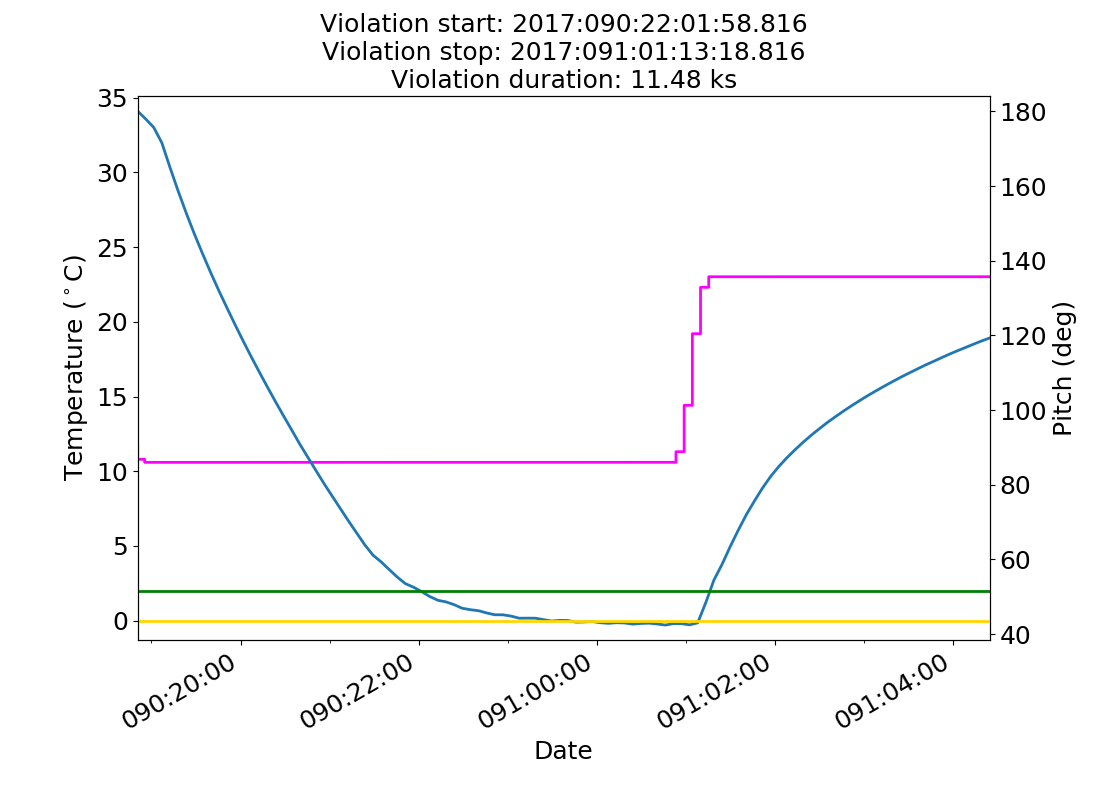
2017:090:22:01:58.816 |
2017:091:01:13:18.816 |
-0.29 |
11.48 |
|
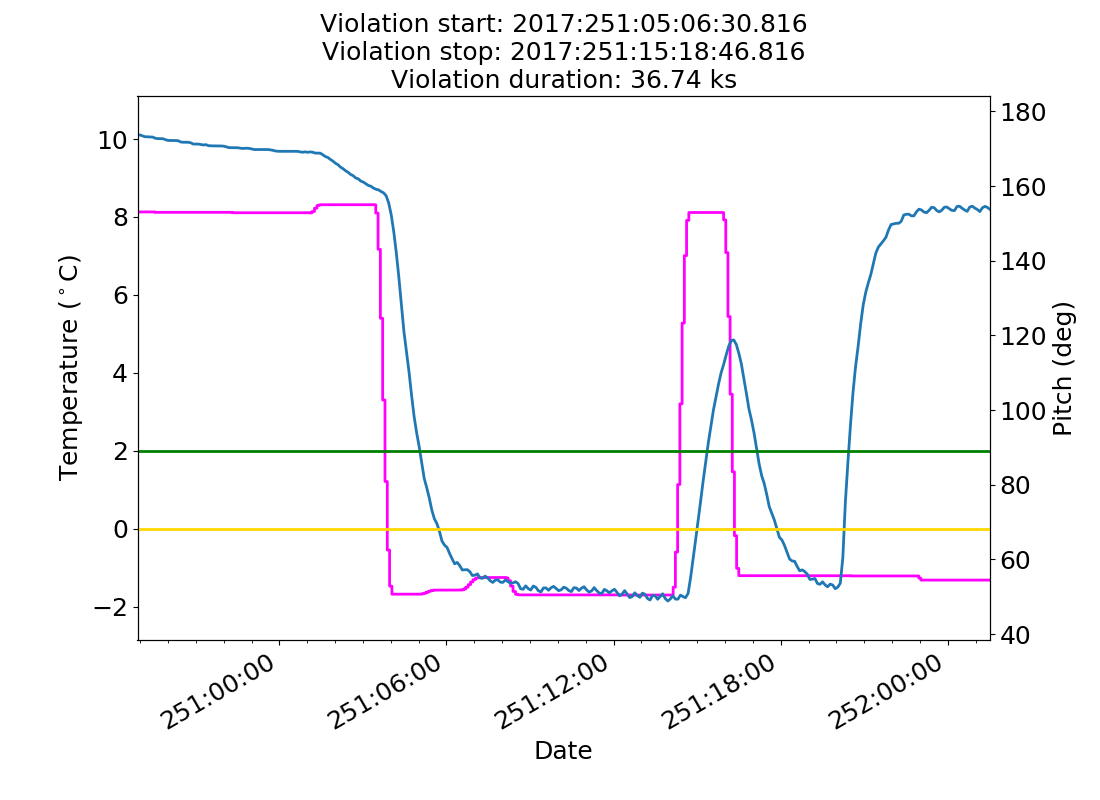
2017:251:05:06:30.816 |
2017:251:15:18:46.816 |
-1.85 |
36.74 |
|
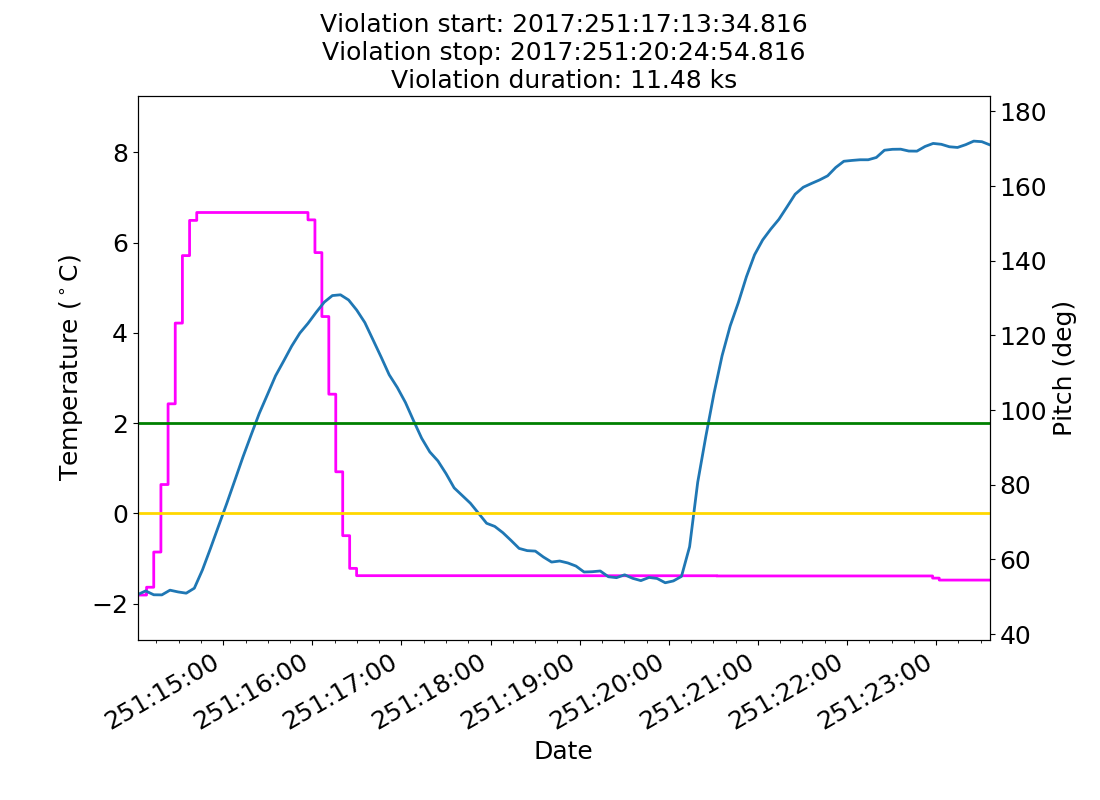
2017:251:17:13:34.816 |
2017:251:20:24:54.816 |
-1.54 |
11.48 |
|
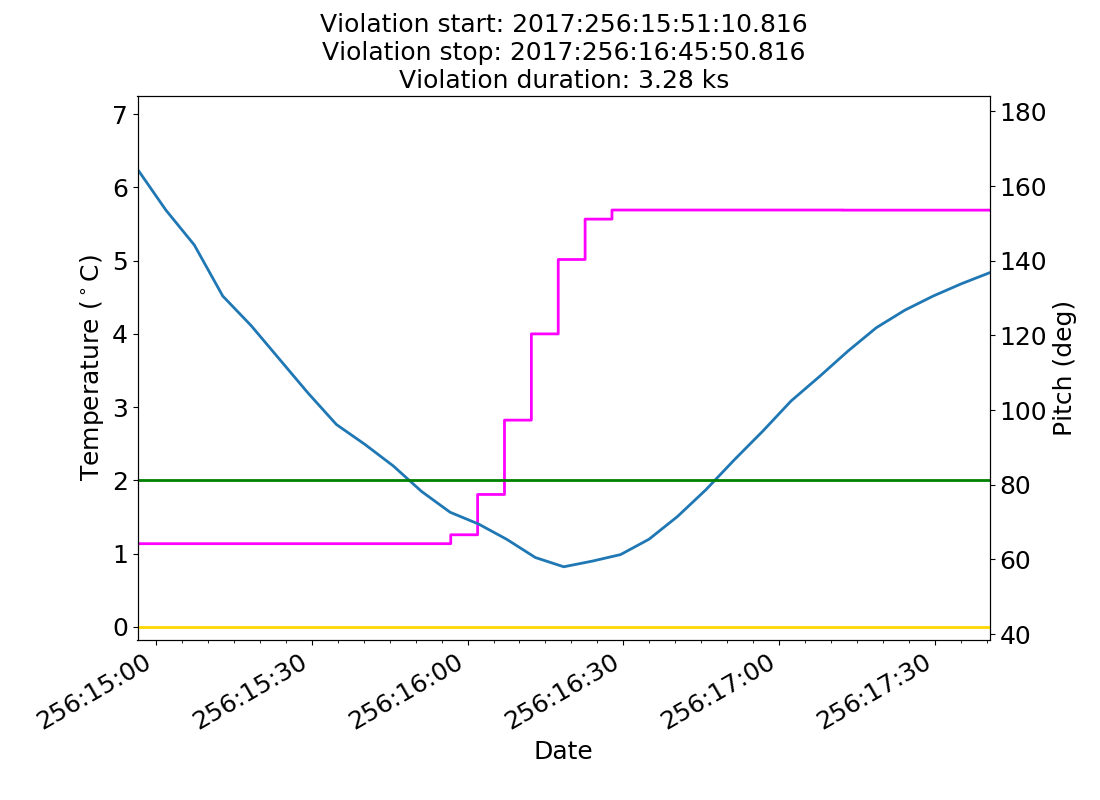
2017:256:15:51:10.816 |
2017:256:16:45:50.816 |
0.82 |
3.28 |
TMP_FEP1_FB Yellow Low Limit Violations
Date start |
Date stop |
Min temperature |
Duration (ks) |
Plot |
|---|---|---|---|---|
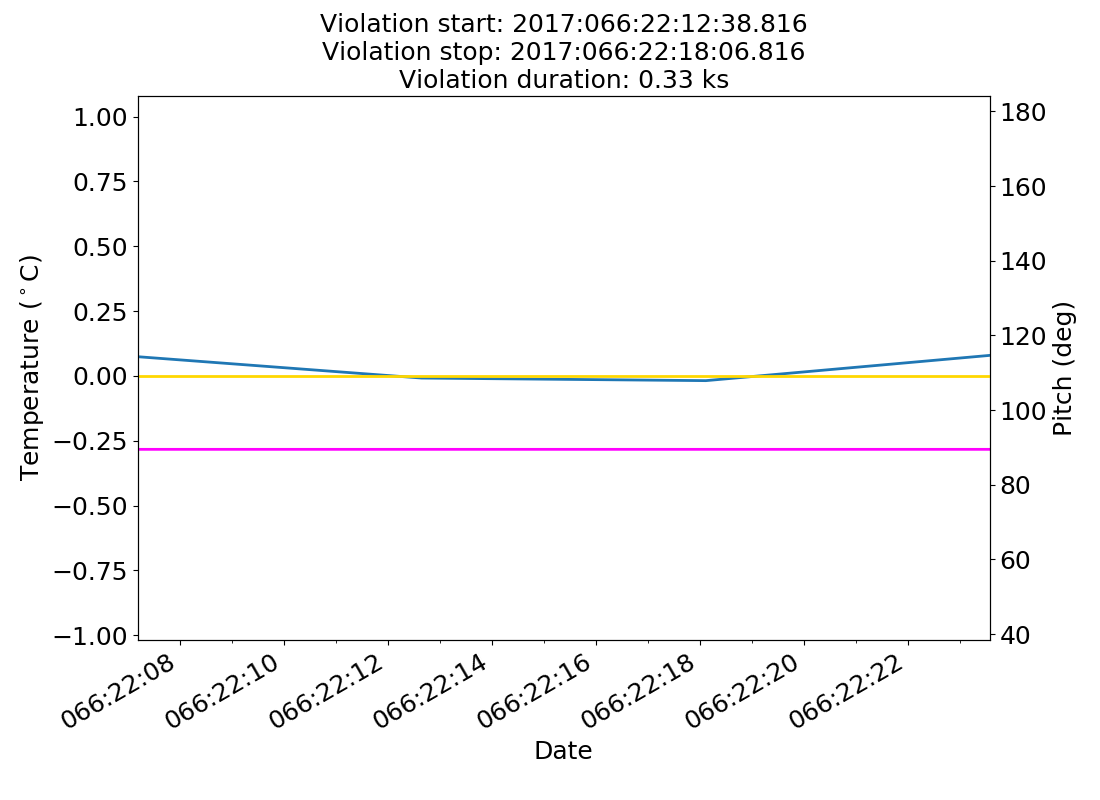
2017:066:22:12:38.816 |
2017:066:22:18:06.816 |
-0.02 |
0.33 |
|
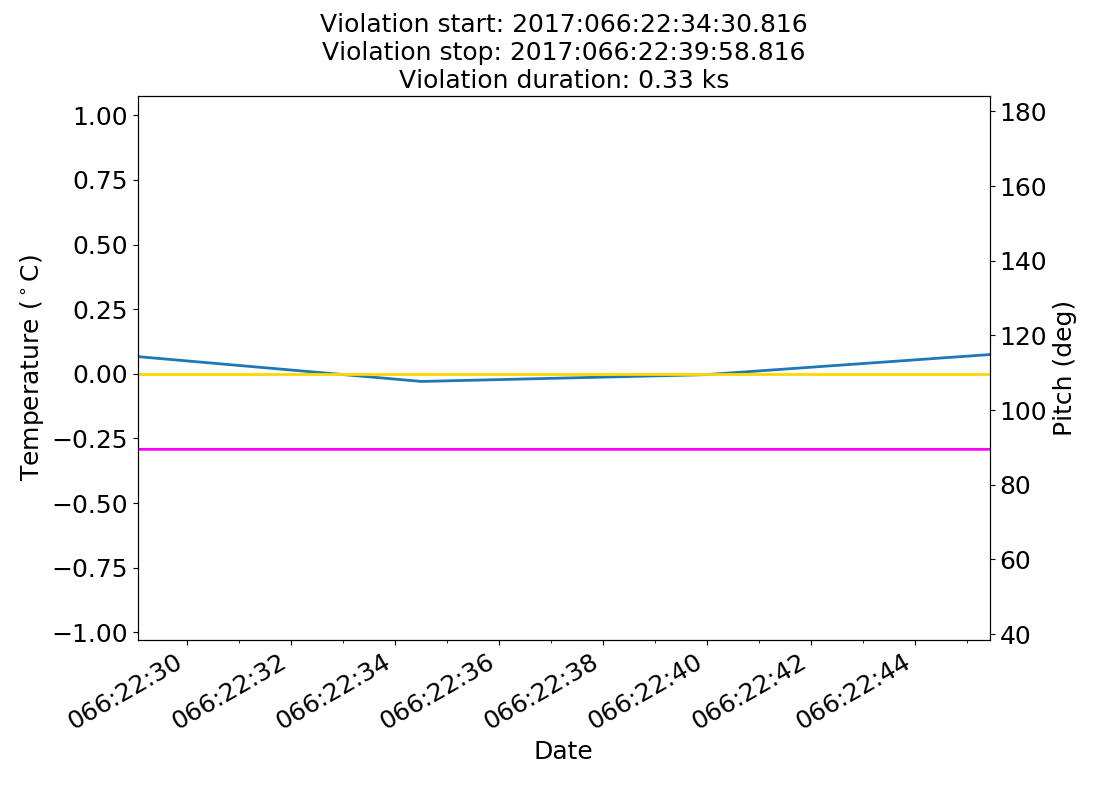
2017:066:22:34:30.816 |
2017:066:22:39:58.816 |
-0.03 |
0.33 |
|
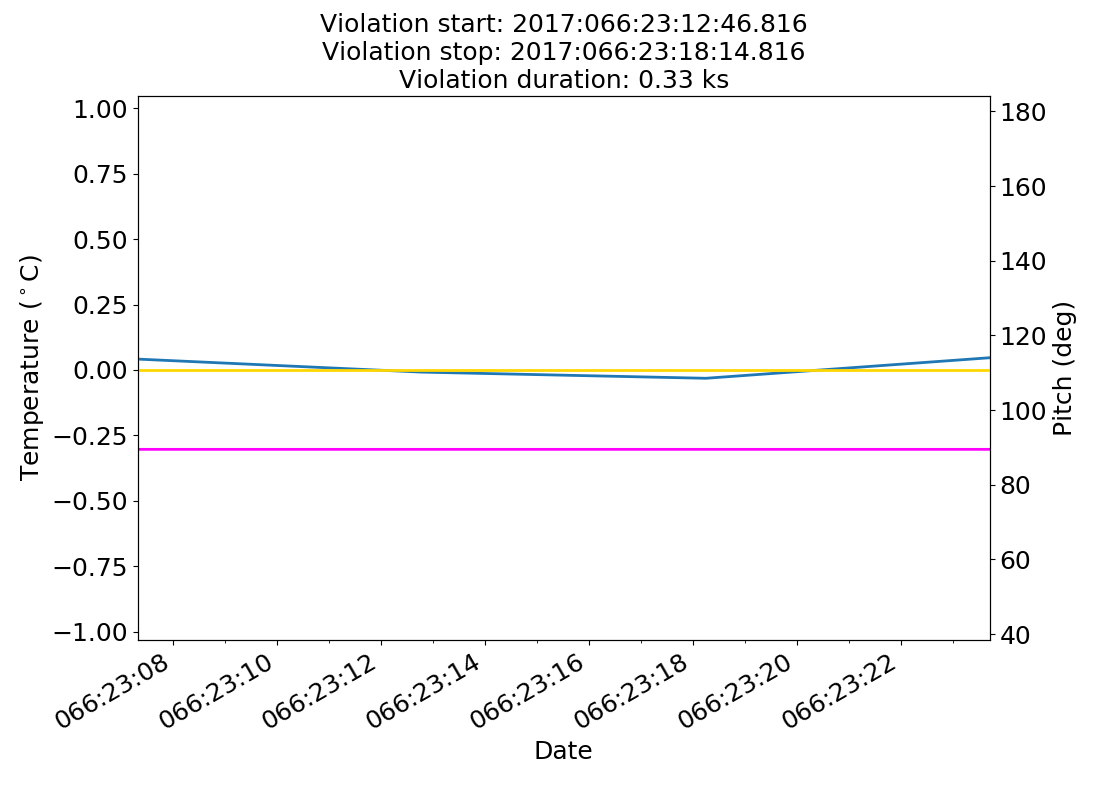
2017:066:23:12:46.816 |
2017:066:23:18:14.816 |
-0.03 |
0.33 |
|
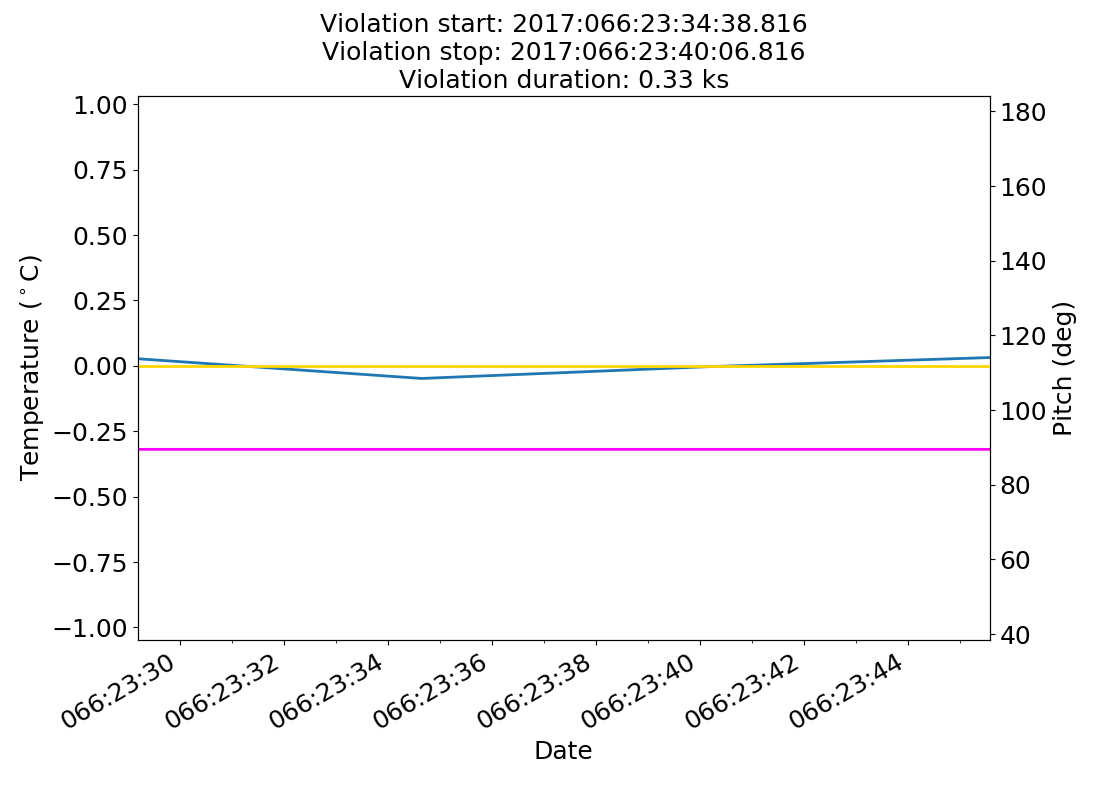
2017:066:23:34:38.816 |
2017:066:23:40:06.816 |
-0.05 |
0.33 |
|
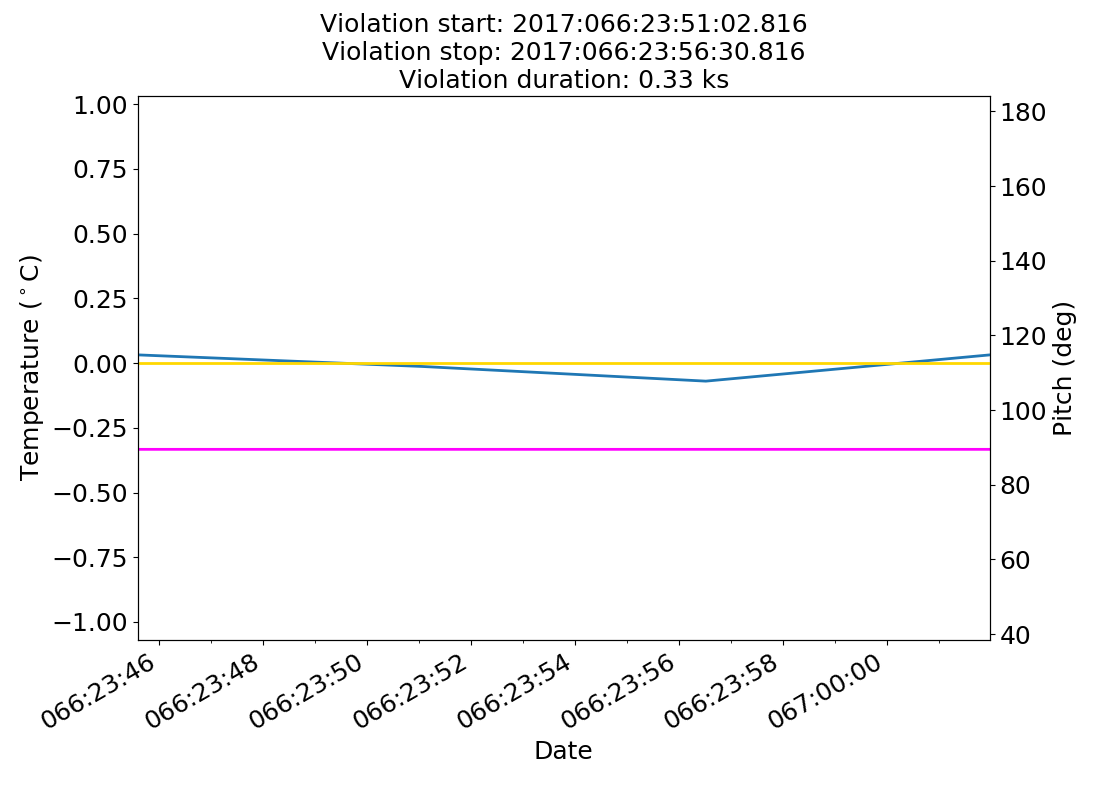
2017:066:23:51:02.816 |
2017:066:23:56:30.816 |
-0.07 |
0.33 |
|
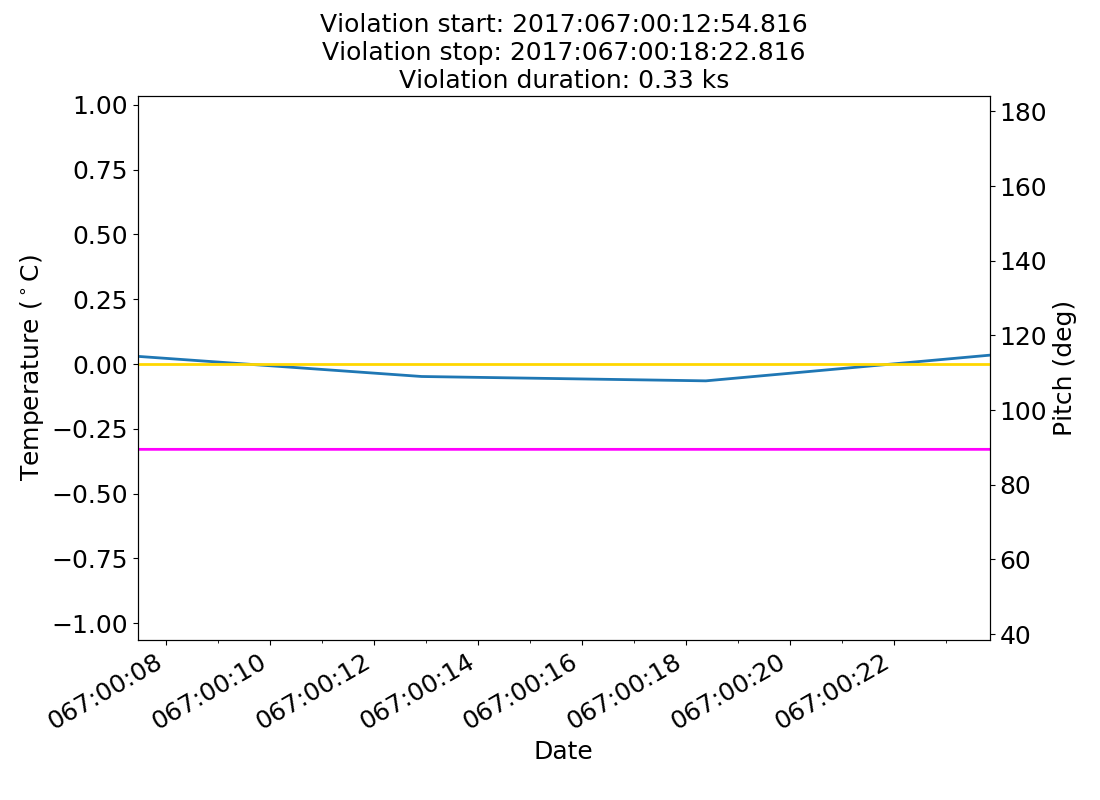
2017:067:00:12:54.816 |
2017:067:00:18:22.816 |
-0.06 |
0.33 |
|
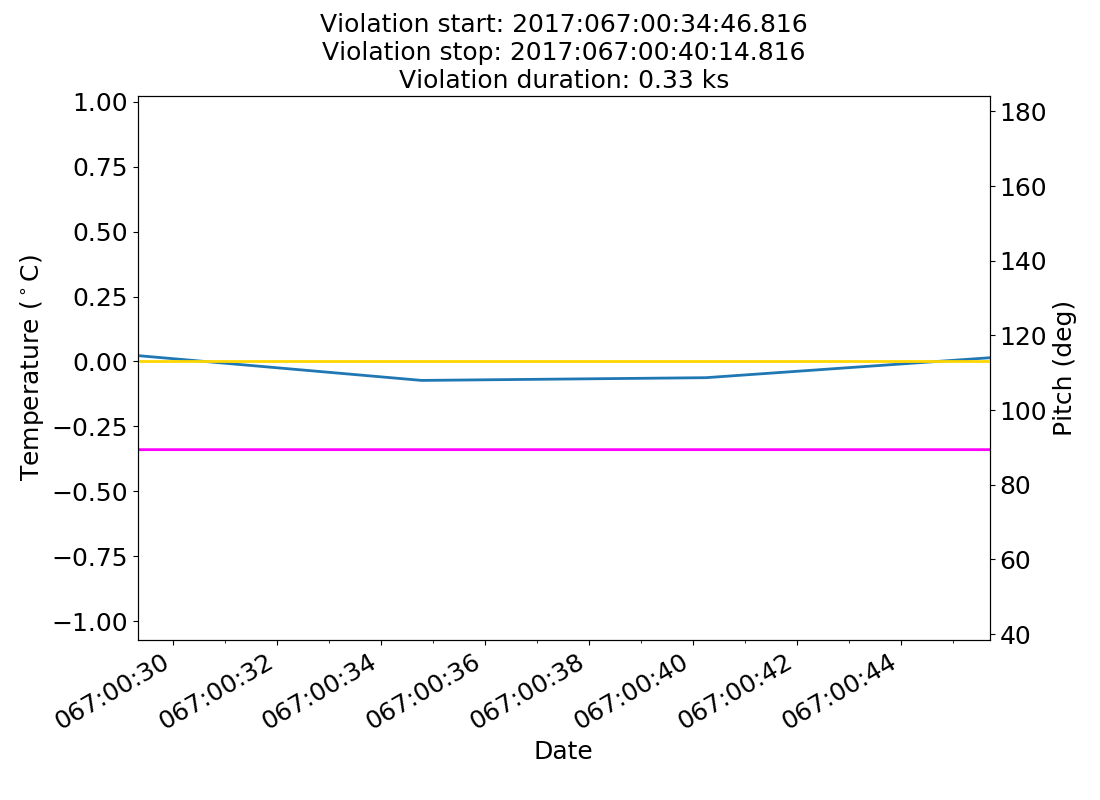
2017:067:00:34:46.816 |
2017:067:00:40:14.816 |
-0.07 |
0.33 |
|
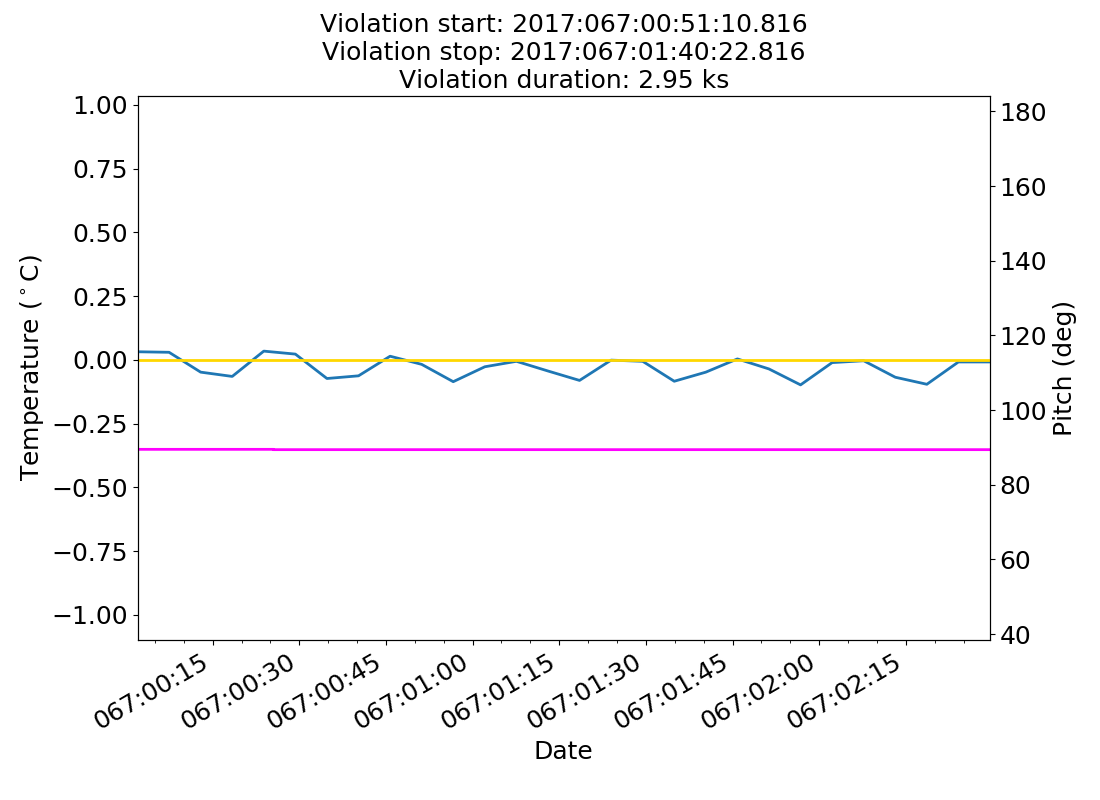
2017:067:00:51:10.816 |
2017:067:01:40:22.816 |
-0.09 |
2.95 |
|
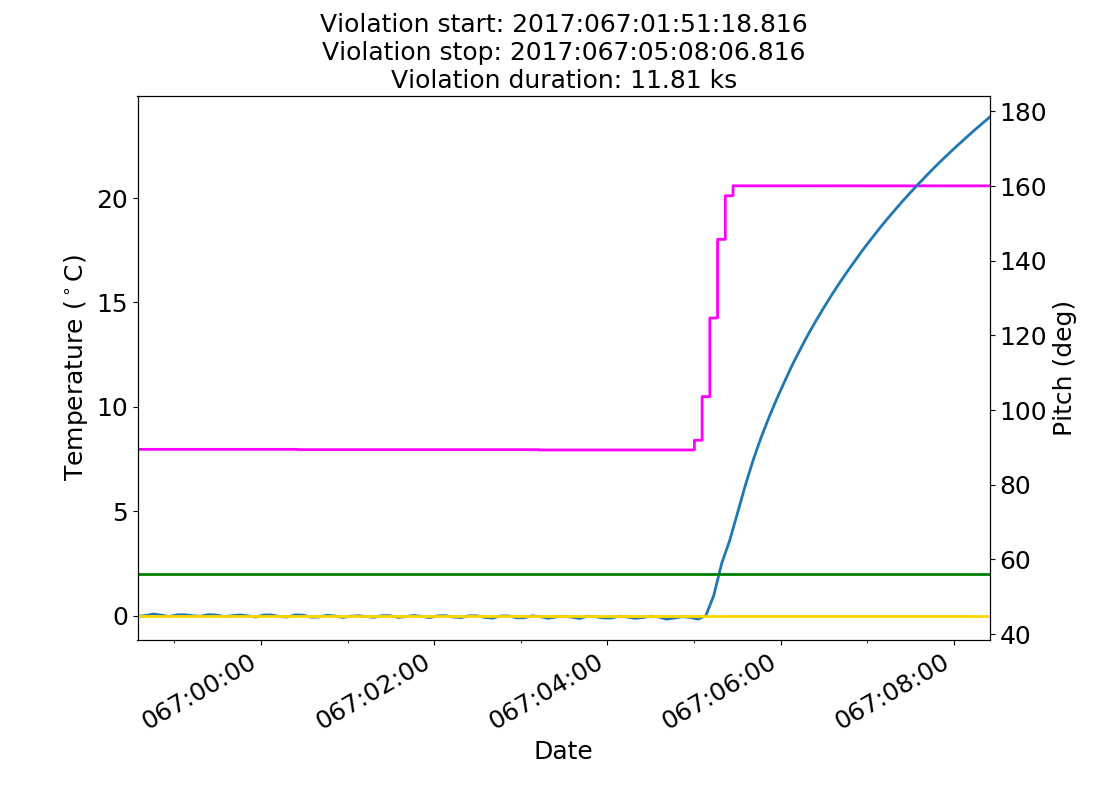
2017:067:01:51:18.816 |
2017:067:05:08:06.816 |
-0.17 |
11.81 |
|
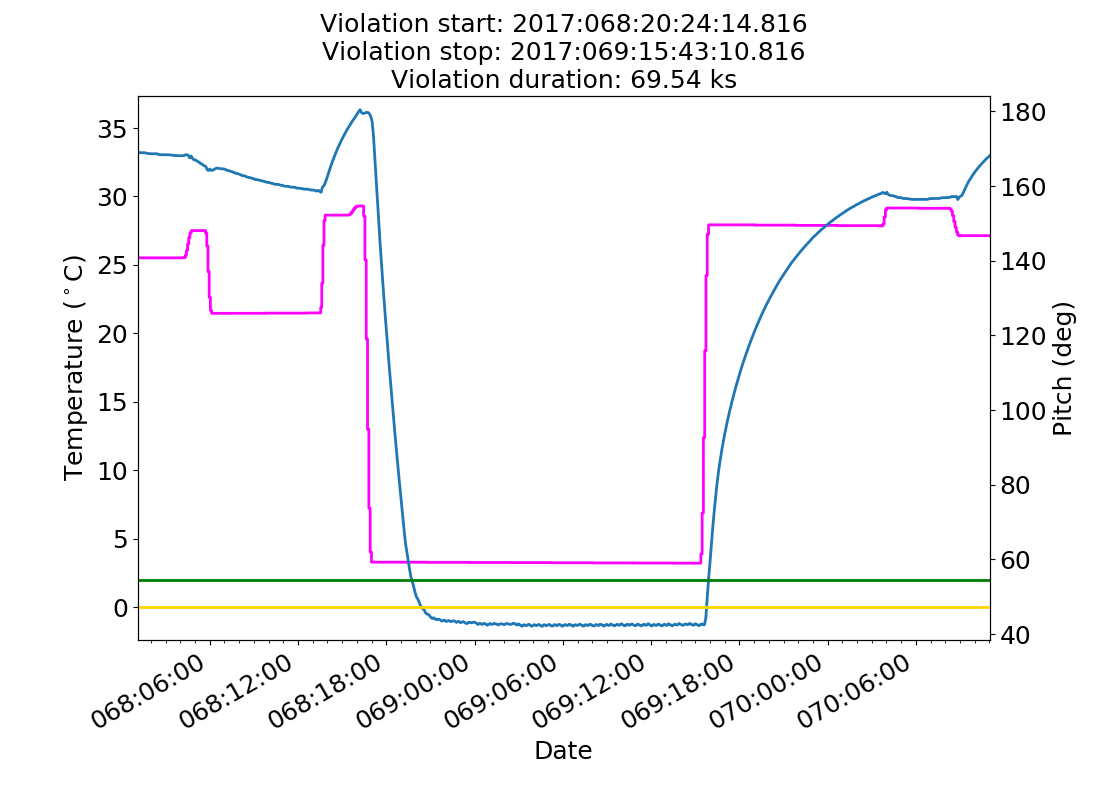
2017:068:20:24:14.816 |
2017:069:15:43:10.816 |
-1.40 |
69.54 |
|
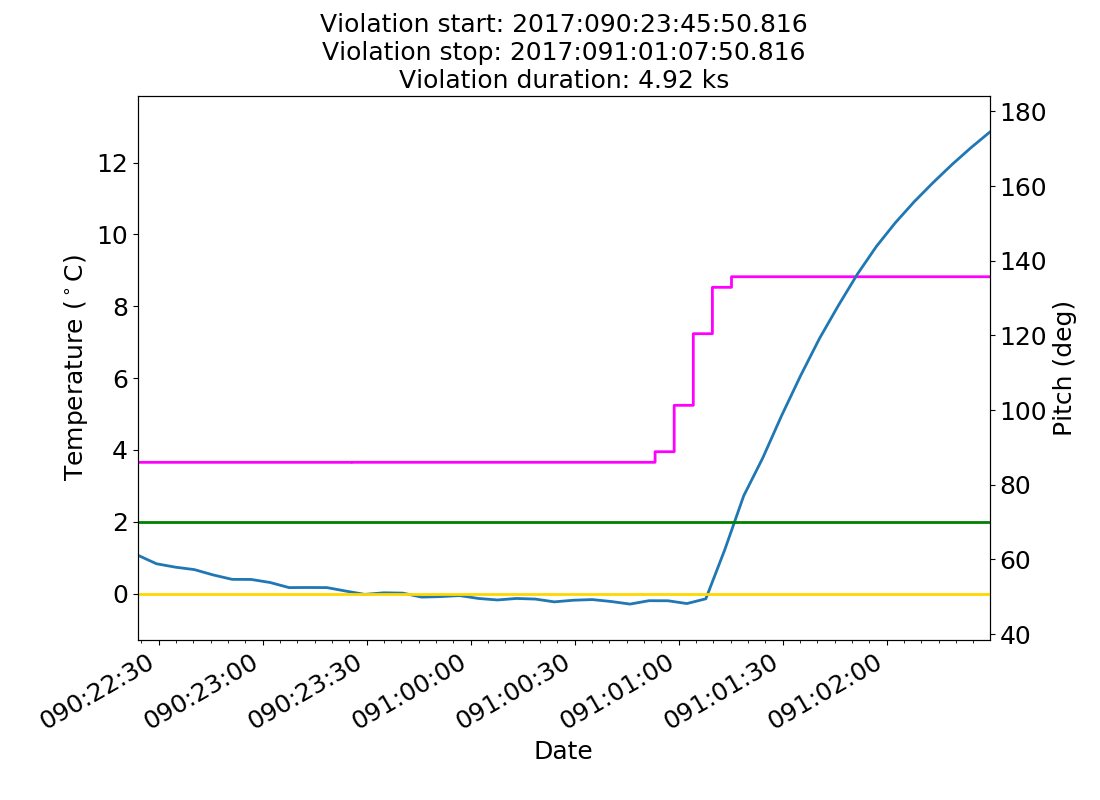
2017:090:23:45:50.816 |
2017:091:01:07:50.816 |
-0.29 |
4.92 |
|
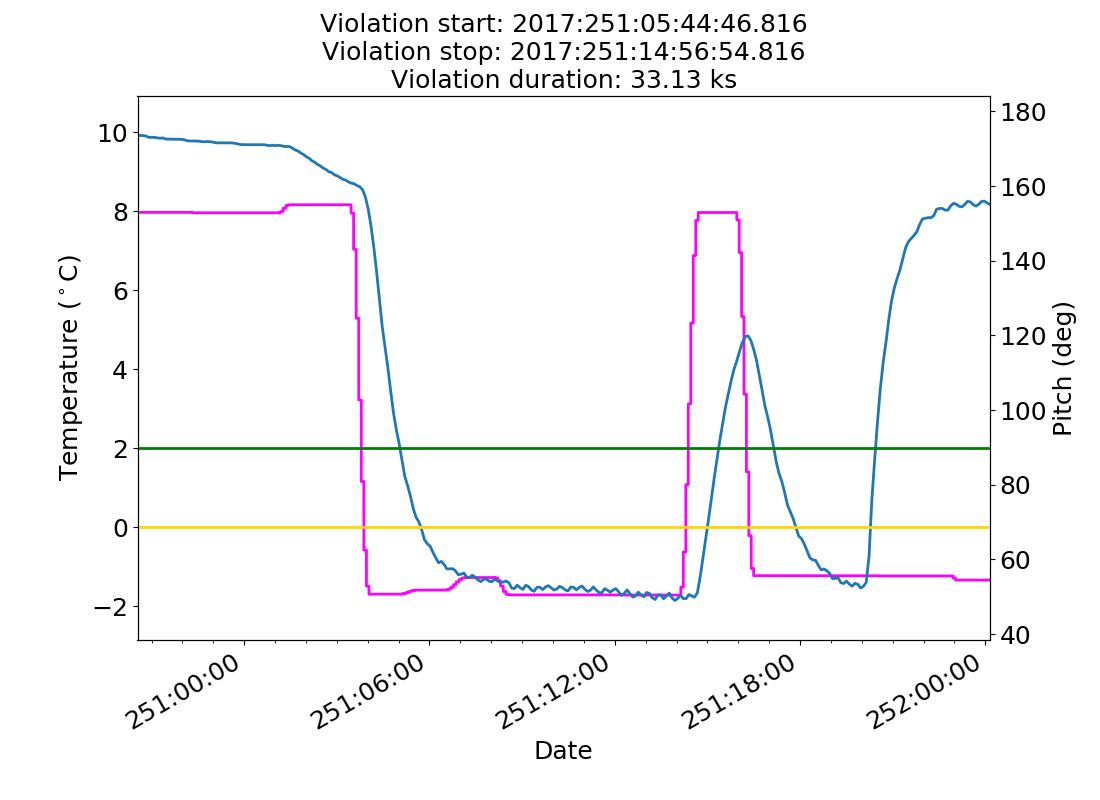
2017:251:05:44:46.816 |
2017:251:14:56:54.816 |
-1.85 |
33.13 |
|
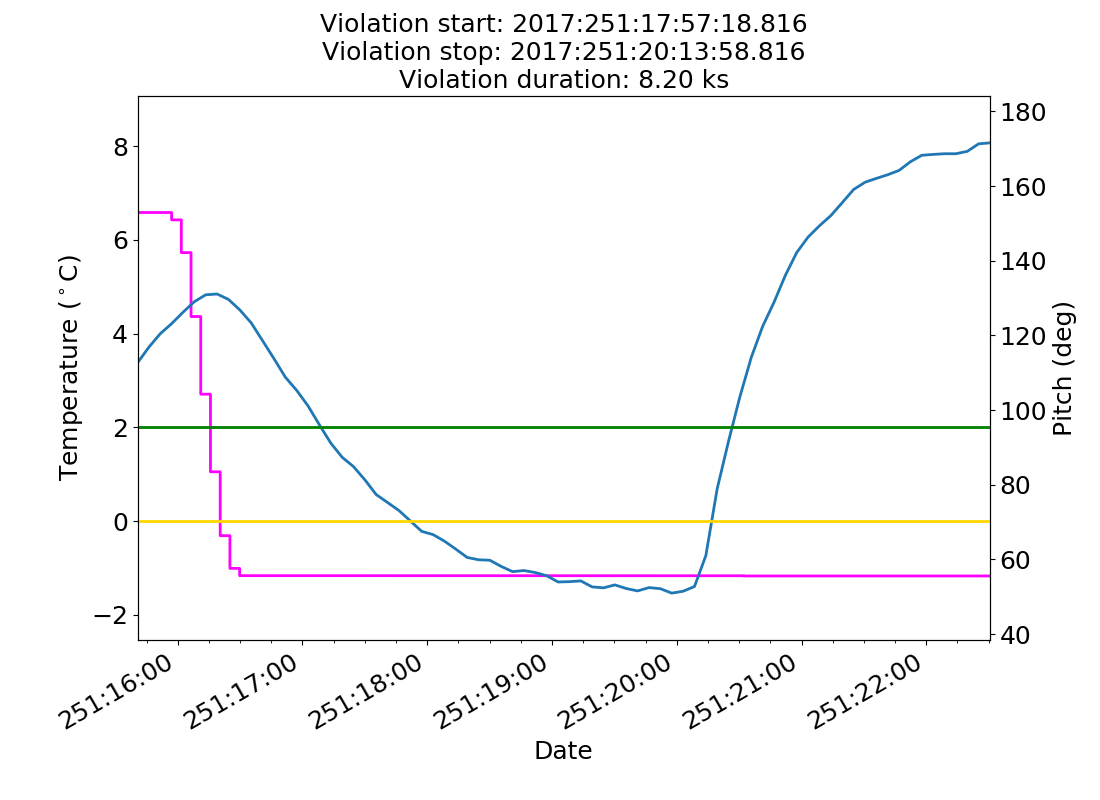
2017:251:17:57:18.816 |
2017:251:20:13:58.816 |
-1.54 |
8.20 |
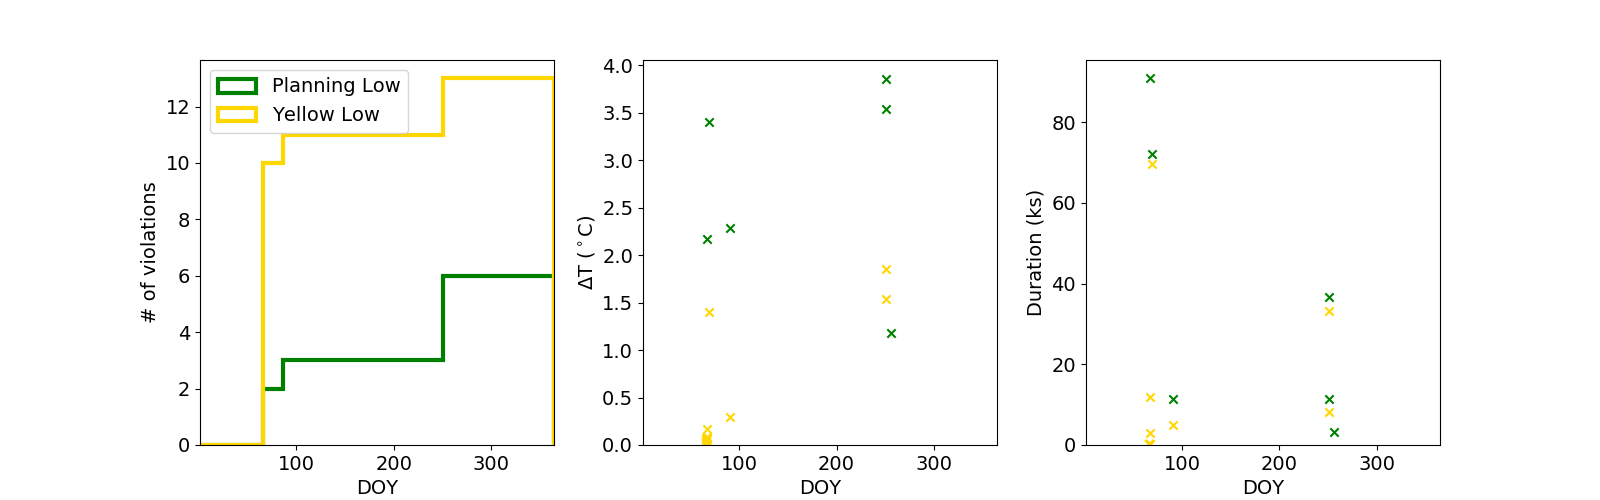
Low Violation Trends
This page was last updated at 2020:038:20:08:06.