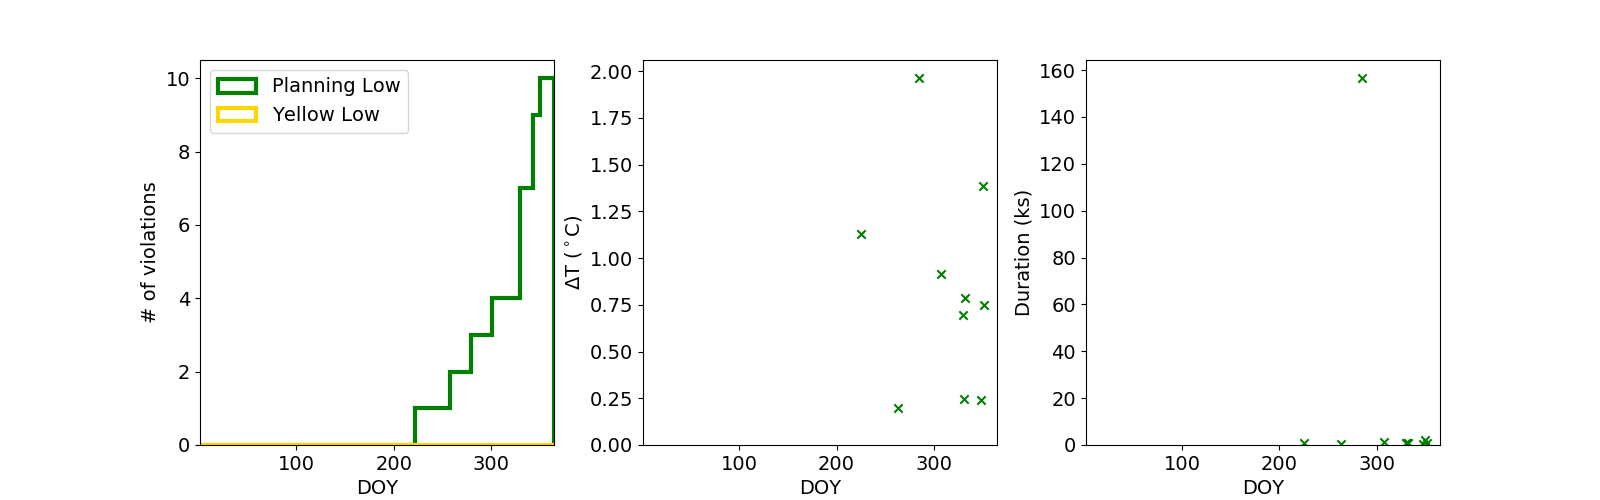
2018 TMP_FEP1_FB Low Violations
TMP_FEP1_FB Planning Low Limit Violations
Date start |
Date stop |
Min temperature |
Duration (ks) |
Plot |
|---|---|---|---|---|
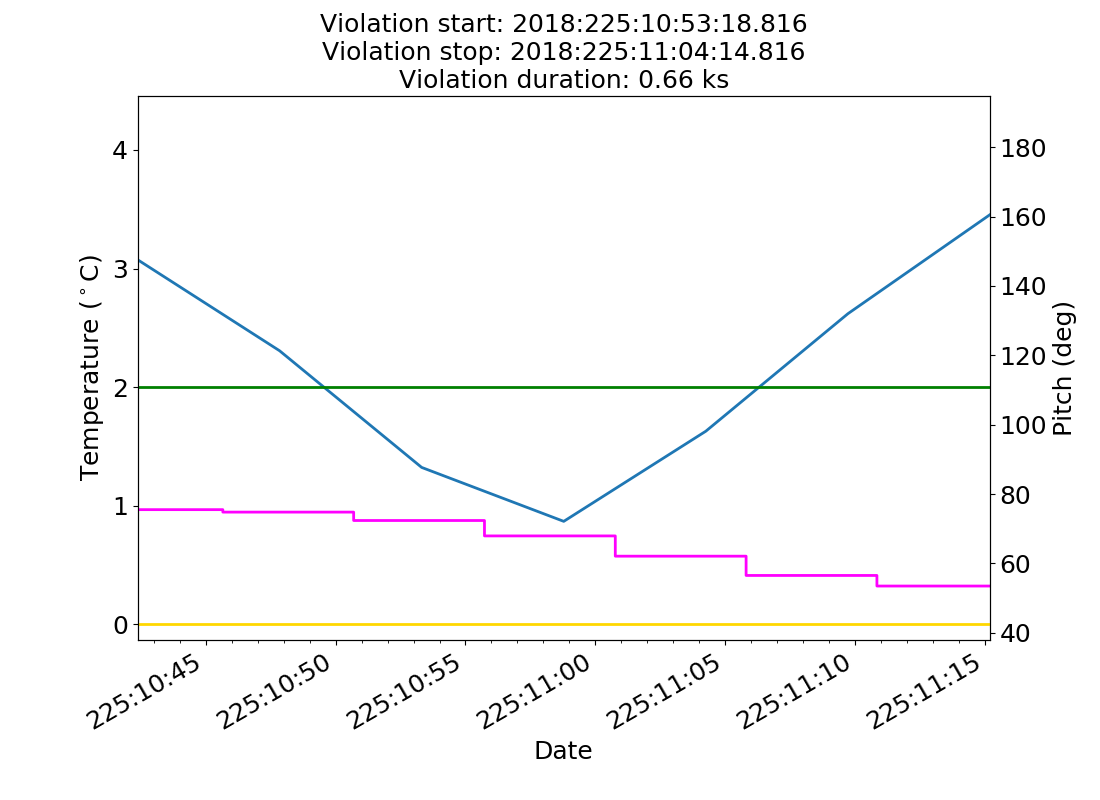
2018:225:10:53:18.816 |
2018:225:11:04:14.816 |
0.87 |
0.66 |
|
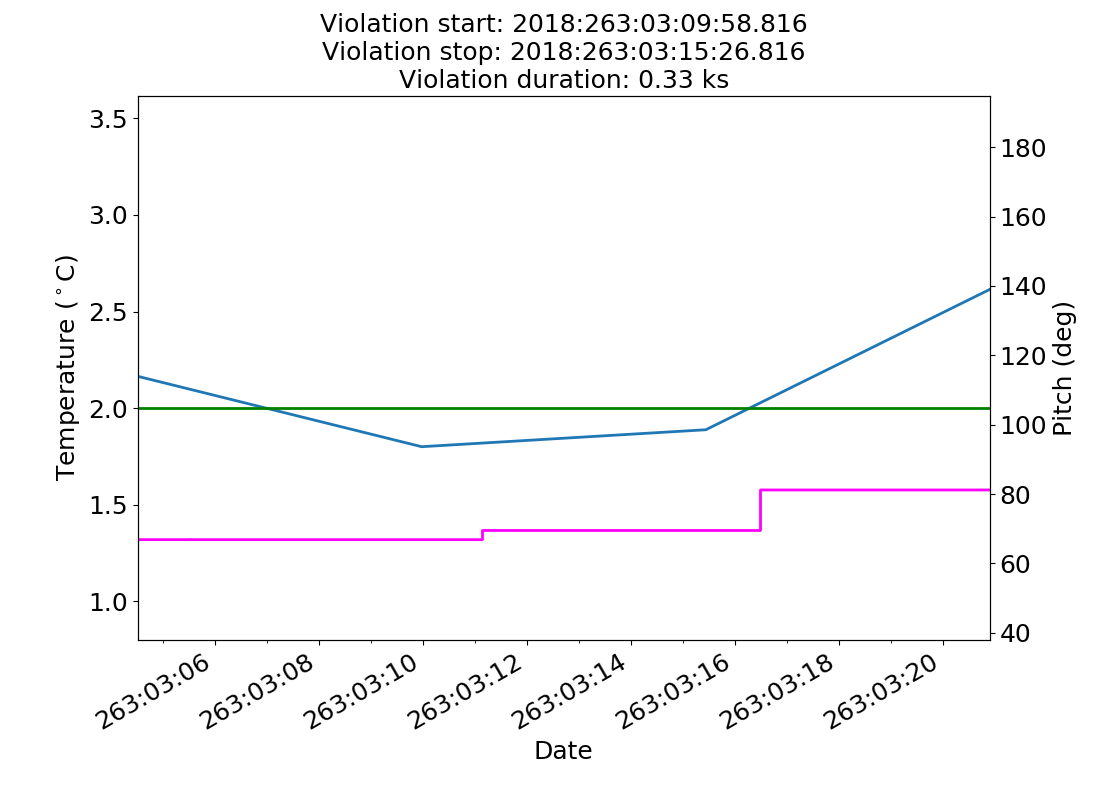
2018:263:03:09:58.816 |
2018:263:03:15:26.816 |
1.80 |
0.33 |
|
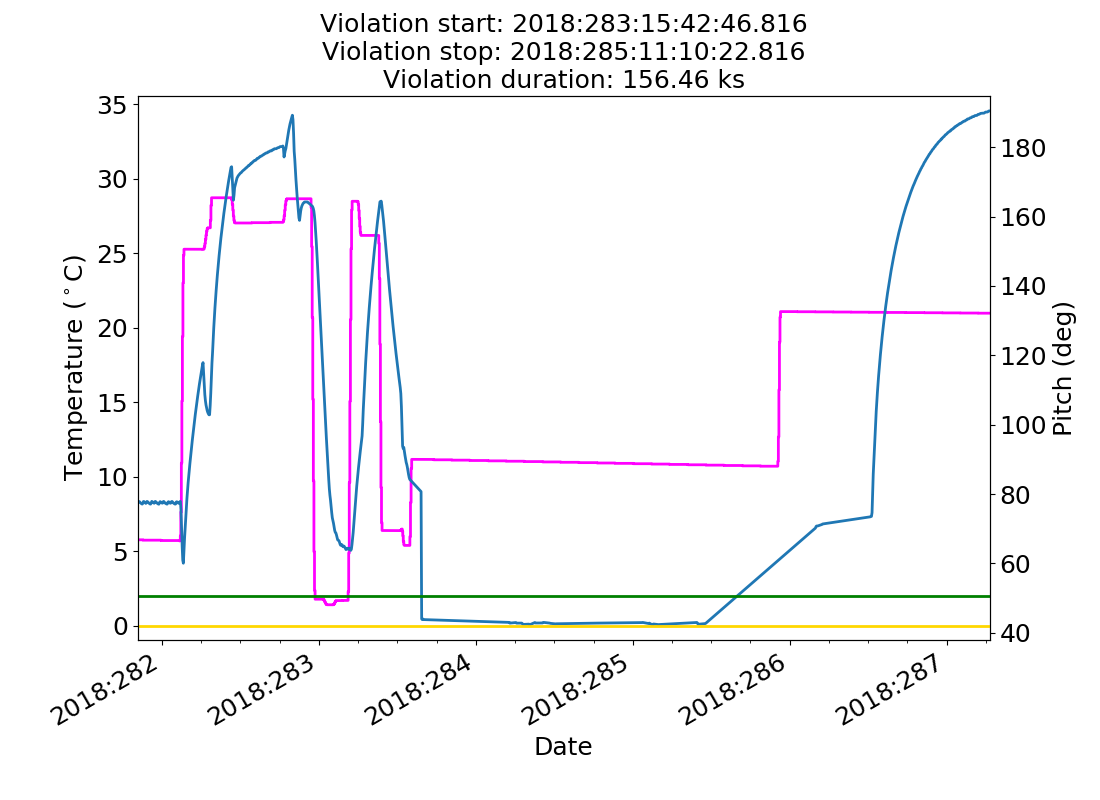
2018:283:15:42:46.816 |
2018:285:11:10:22.816 |
0.04 |
156.46 |
|
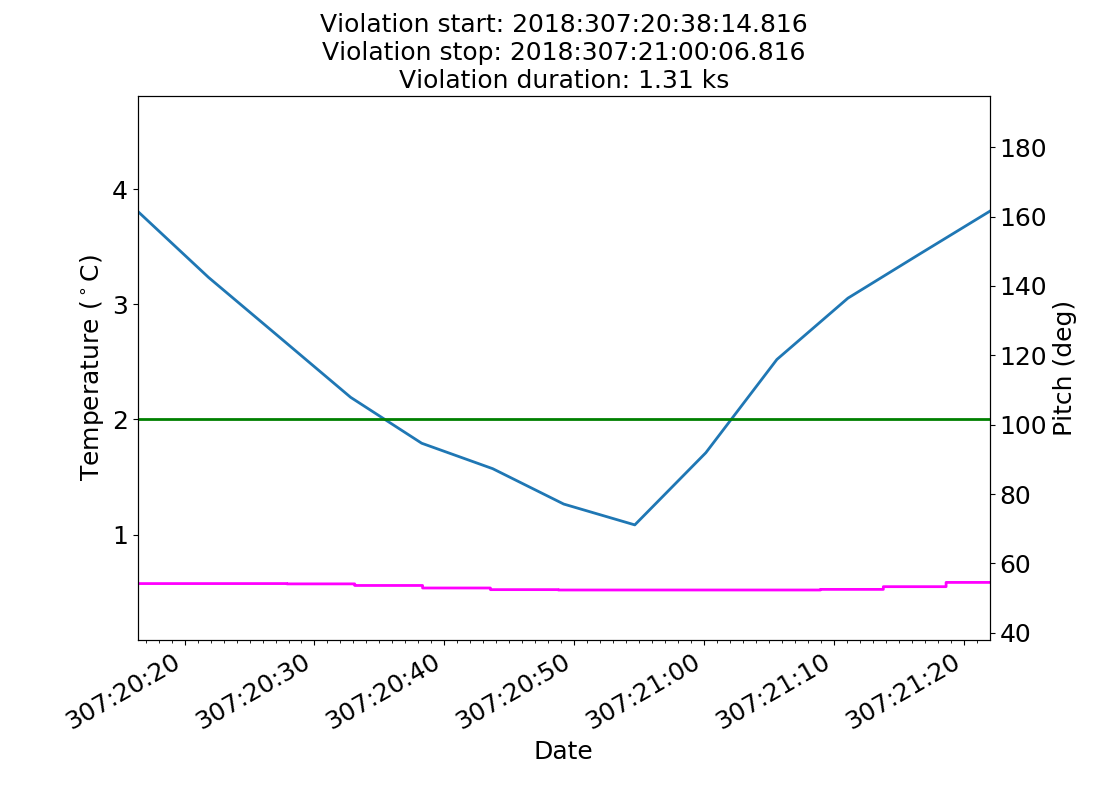
2018:307:20:38:14.816 |
2018:307:21:00:06.816 |
1.08 |
1.31 |
|
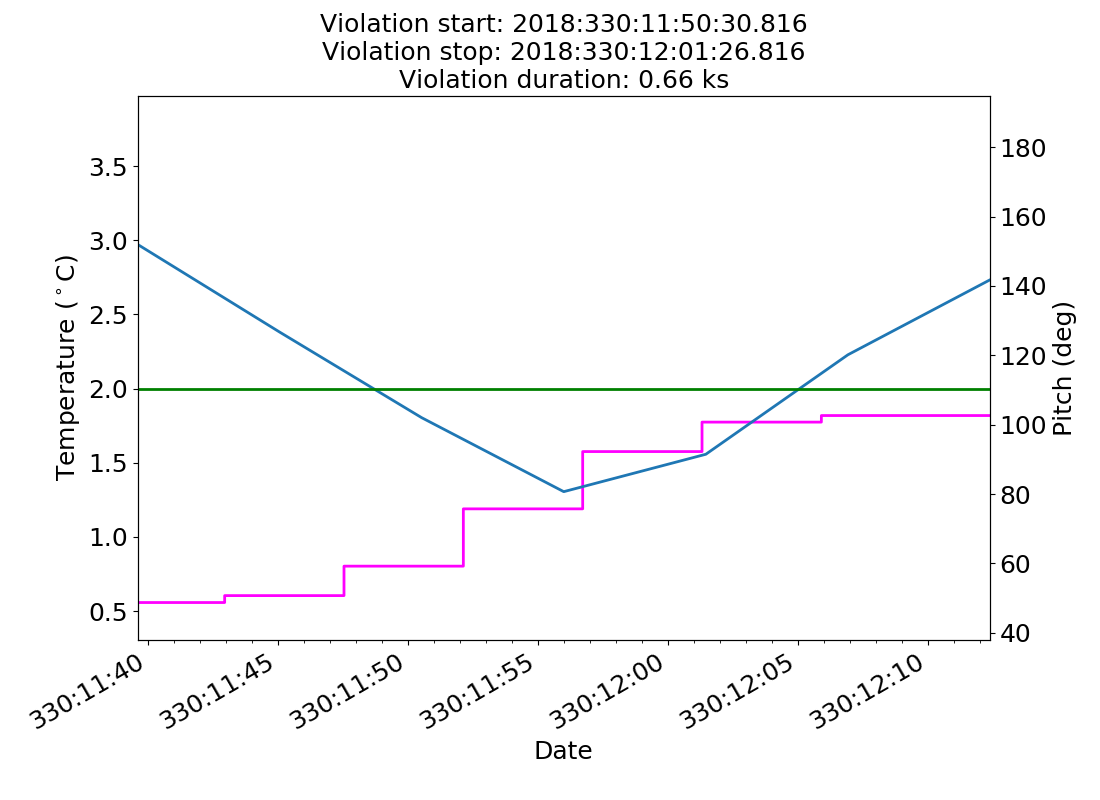
2018:330:11:50:30.816 |
2018:330:12:01:26.816 |
1.30 |
0.66 |
|
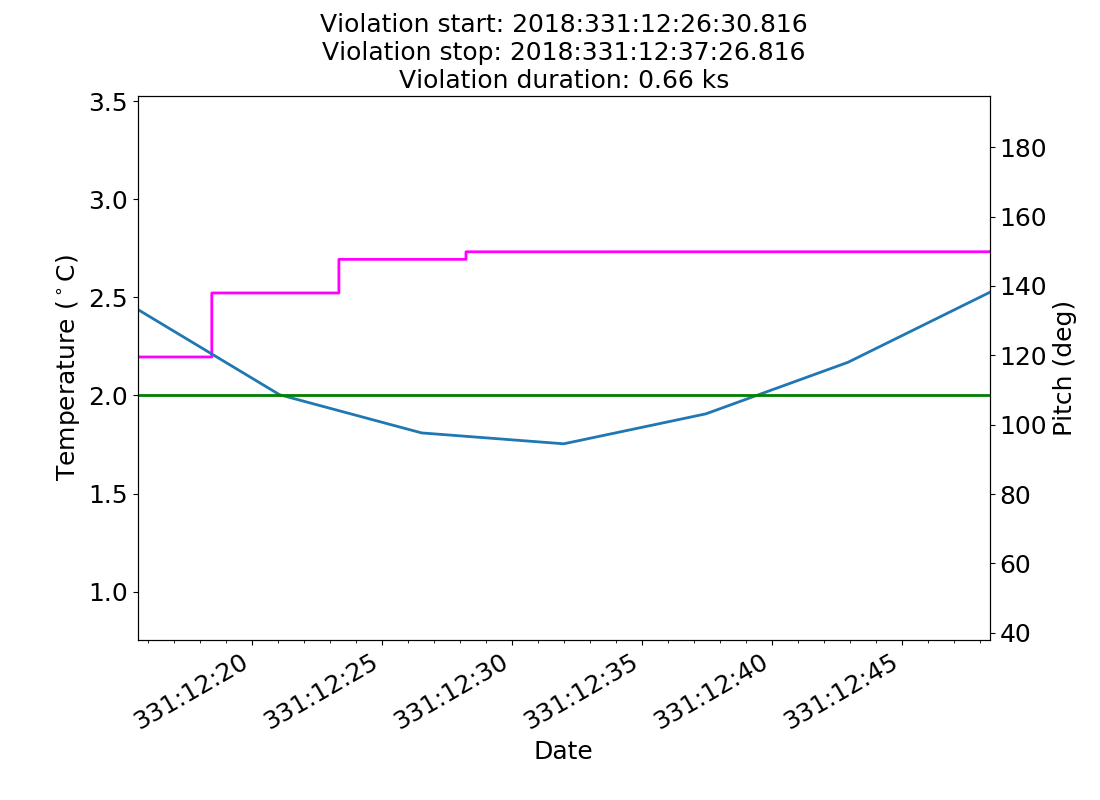
2018:331:12:26:30.816 |
2018:331:12:37:26.816 |
1.75 |
0.66 |
|
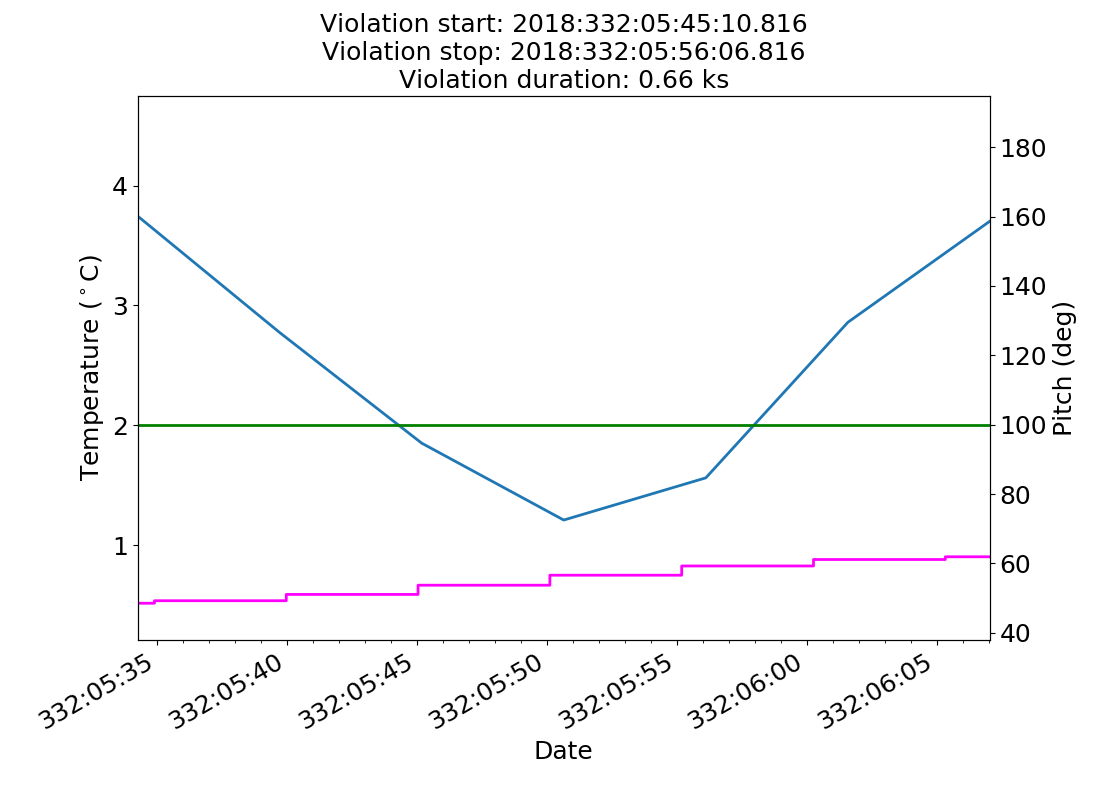
2018:332:05:45:10.816 |
2018:332:05:56:06.816 |
1.21 |
0.66 |
|
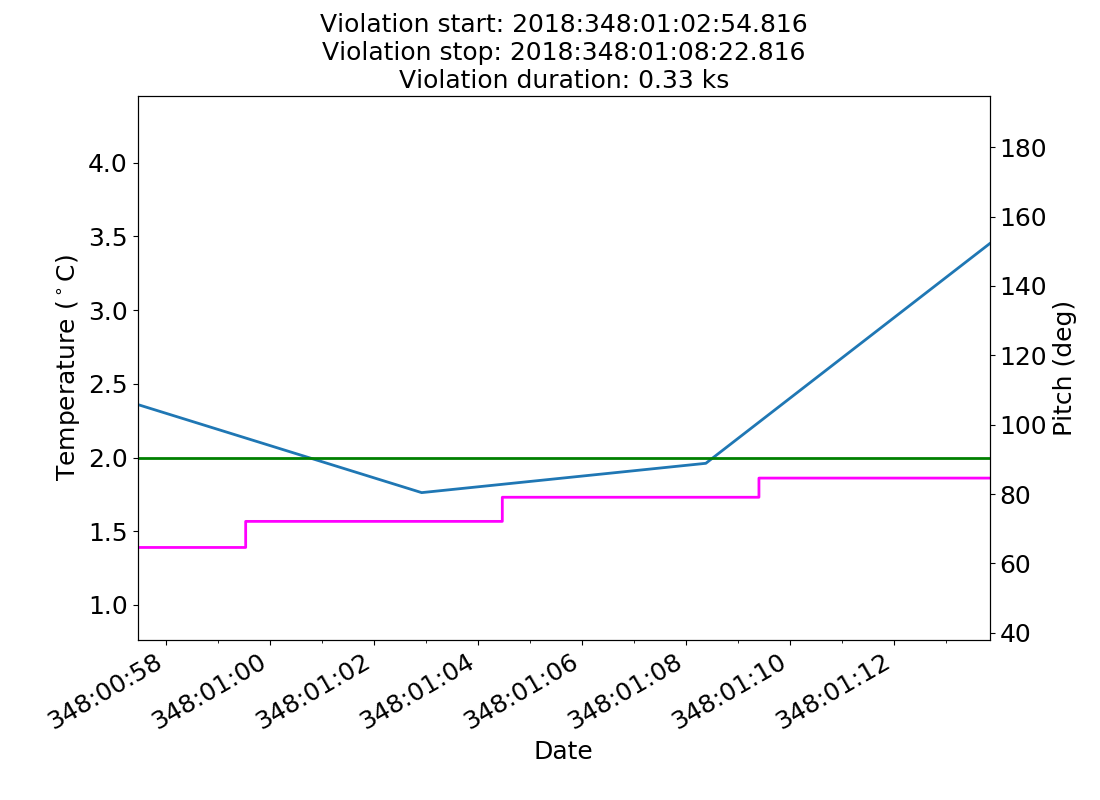
2018:348:01:02:54.816 |
2018:348:01:08:22.816 |
1.76 |
0.33 |
|
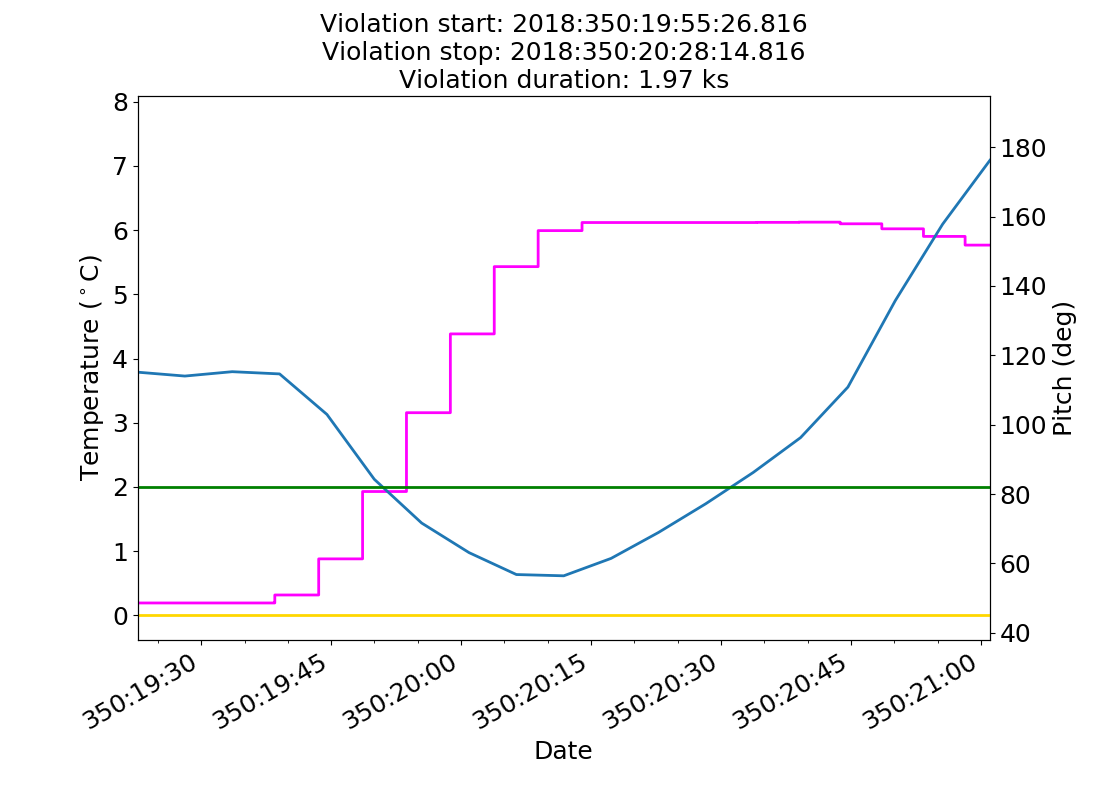
2018:350:19:55:26.816 |
2018:350:20:28:14.816 |
0.62 |
1.97 |
|
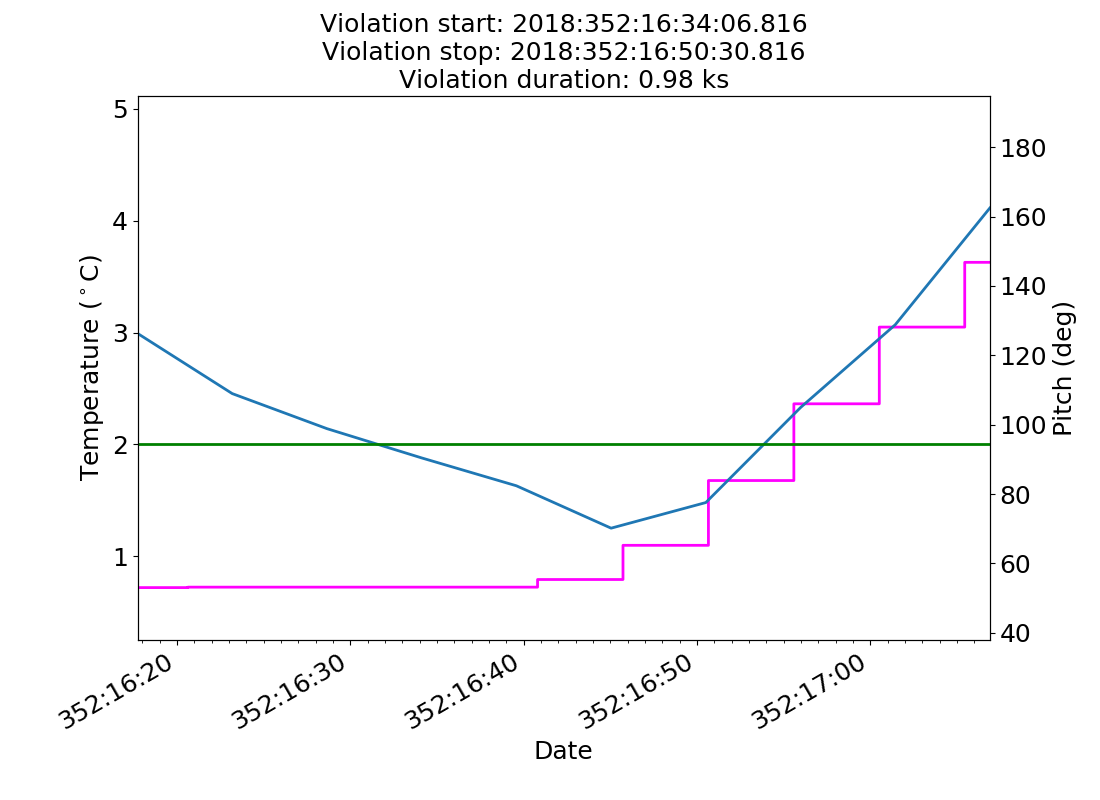
2018:352:16:34:06.816 |
2018:352:16:50:30.816 |
1.25 |
0.98 |
TMP_FEP1_FB Yellow Low Limit Violations
No yellow low limit violations during this period.
Low Violation Trends
This page was last updated at 2020:038:20:12:06.