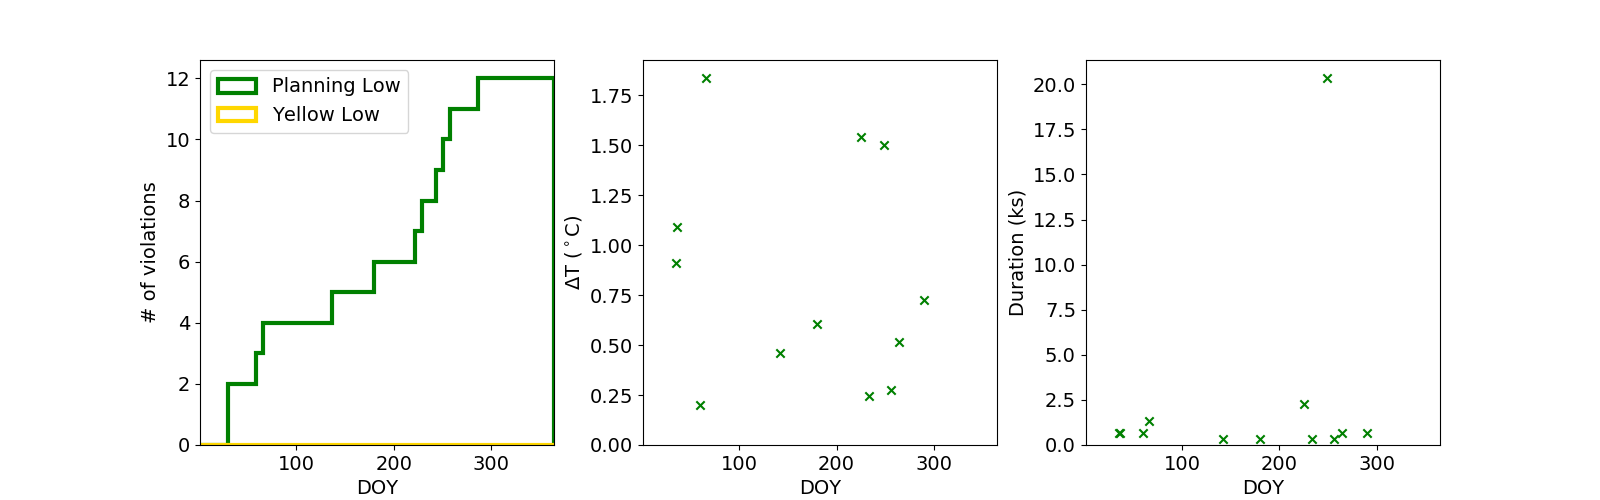
2019 TMP_FEP1_FB Low Violations
TMP_FEP1_FB Planning Low Limit Violations
Date start |
Date stop |
Min temperature |
Duration (ks) |
Plot |
|---|---|---|---|---|
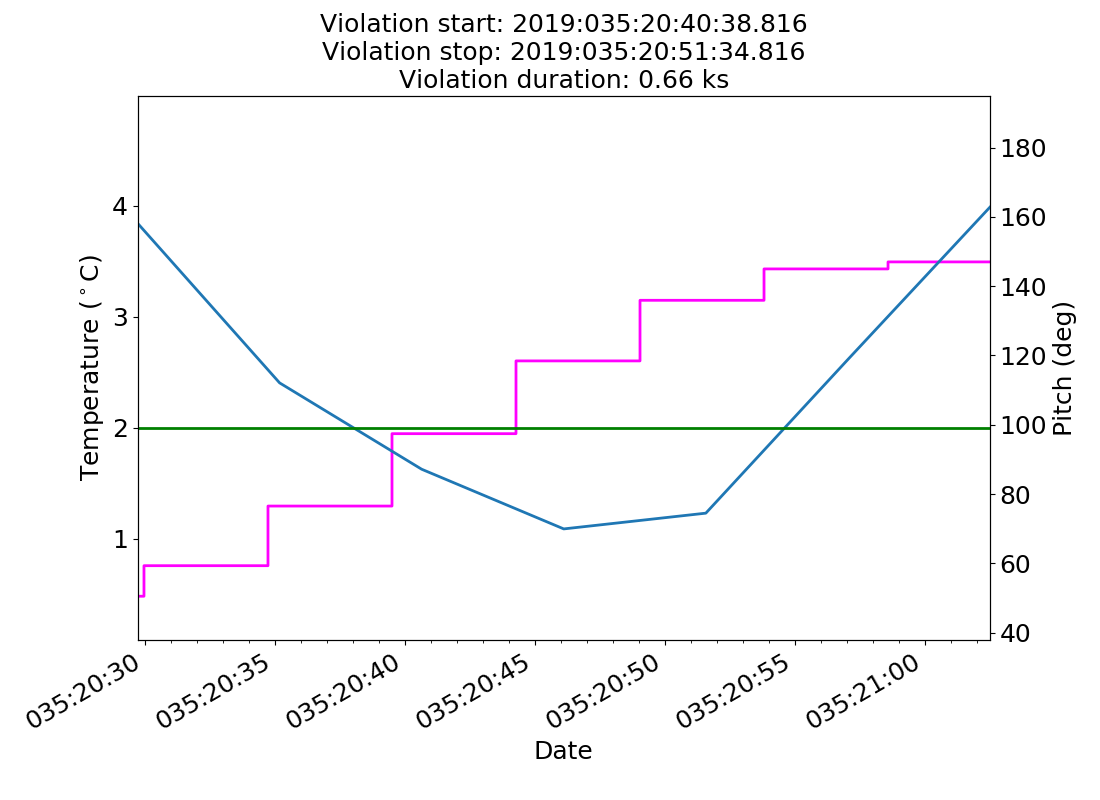
2019:035:20:40:38.816 |
2019:035:20:51:34.816 |
1.09 |
0.66 |
|
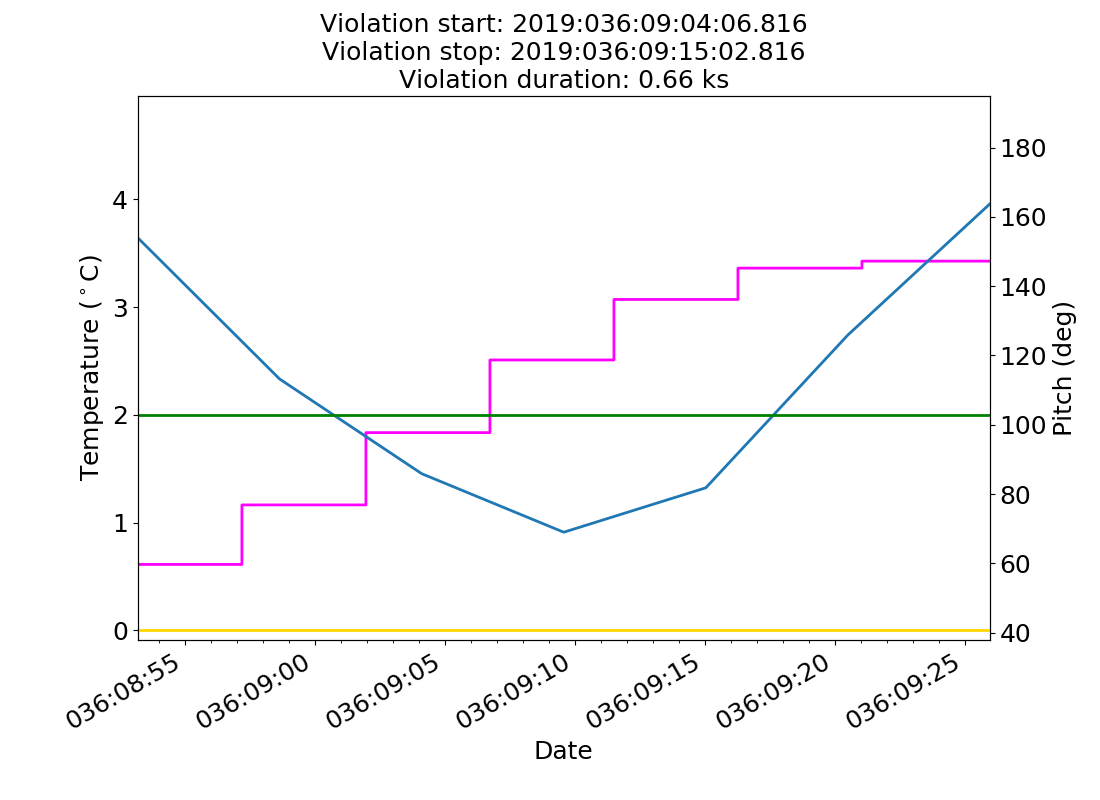
2019:036:09:04:06.816 |
2019:036:09:15:02.816 |
0.91 |
0.66 |
|
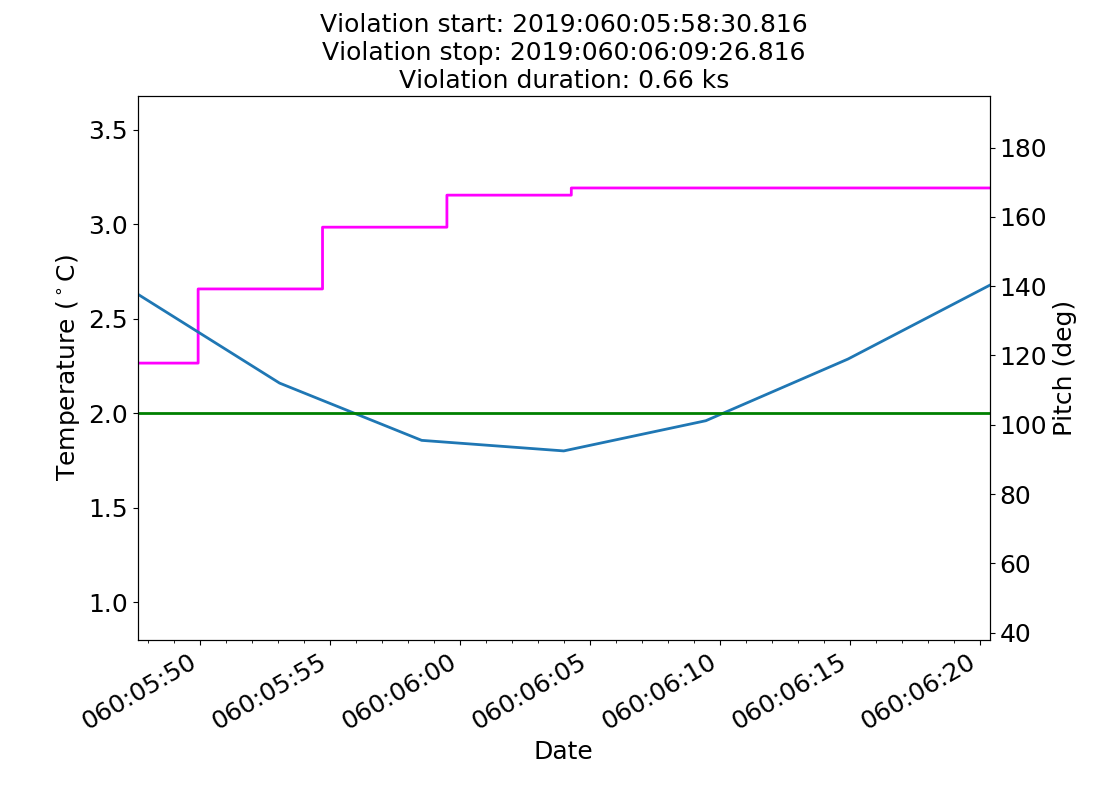
2019:060:05:58:30.816 |
2019:060:06:09:26.816 |
1.80 |
0.66 |
|
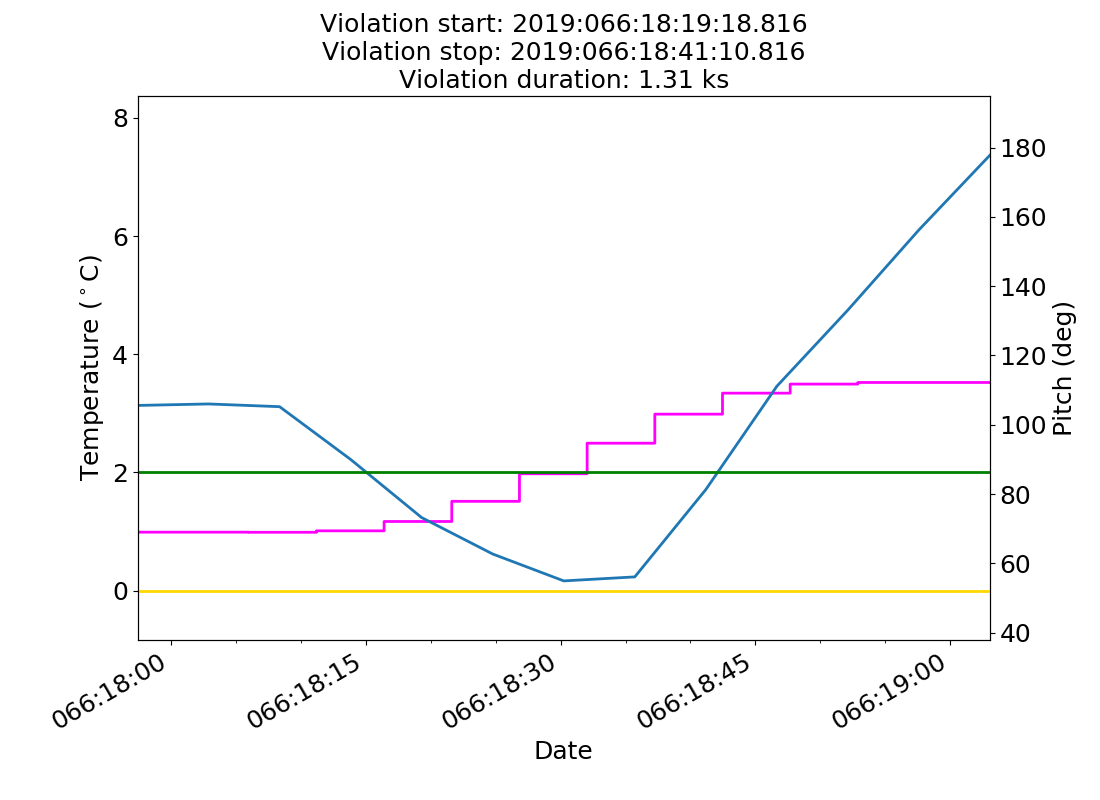
2019:066:18:19:18.816 |
2019:066:18:41:10.816 |
0.17 |
1.31 |
|
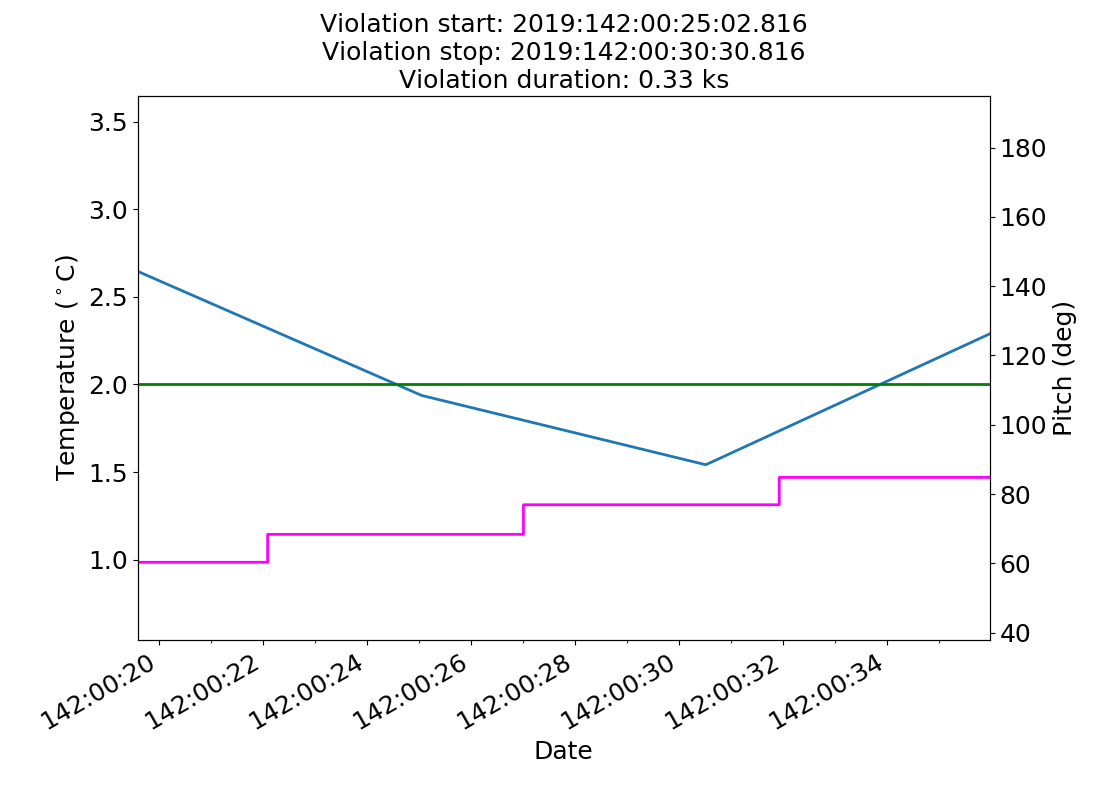
2019:142:00:25:02.816 |
2019:142:00:30:30.816 |
1.54 |
0.33 |
|
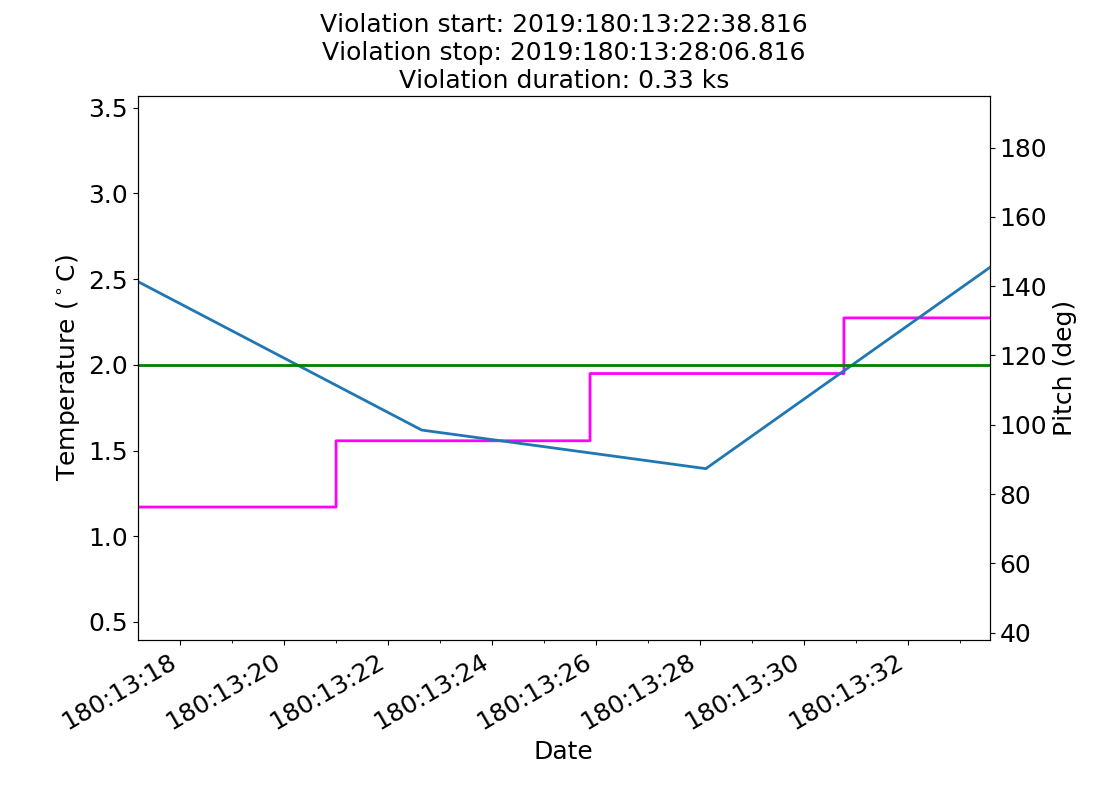
2019:180:13:22:38.816 |
2019:180:13:28:06.816 |
1.39 |
0.33 |
|
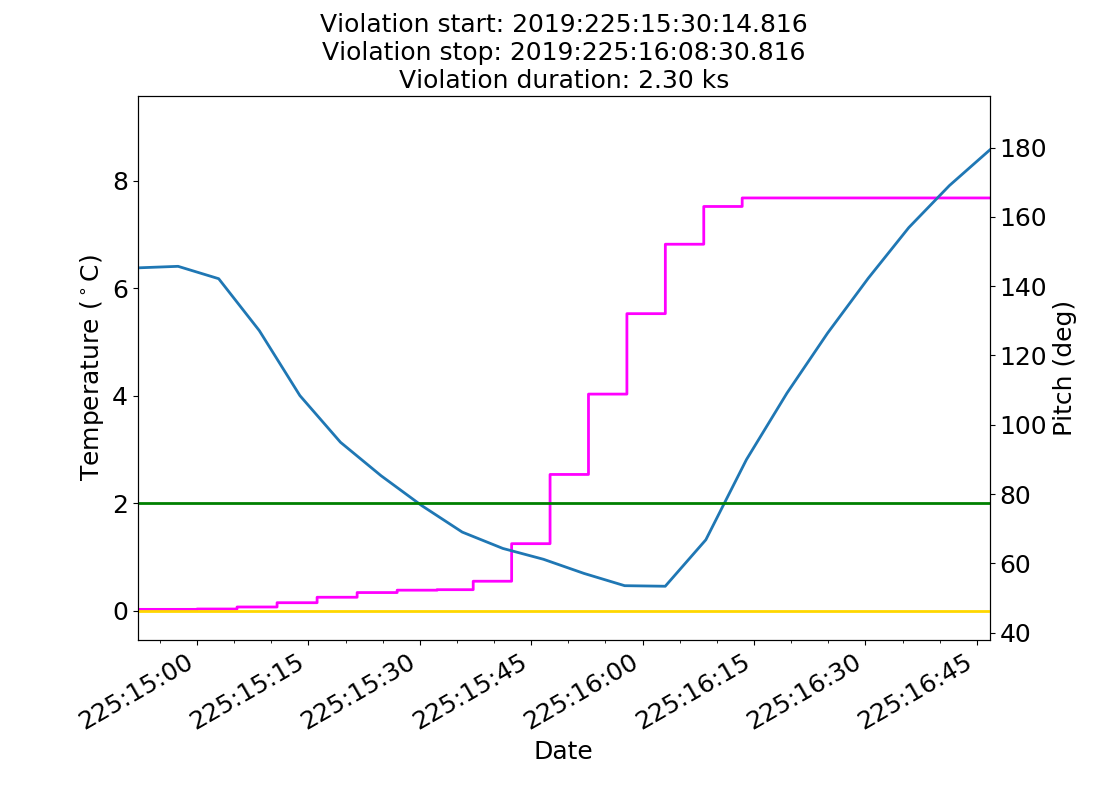
2019:225:15:30:14.816 |
2019:225:16:08:30.816 |
0.46 |
2.30 |
|
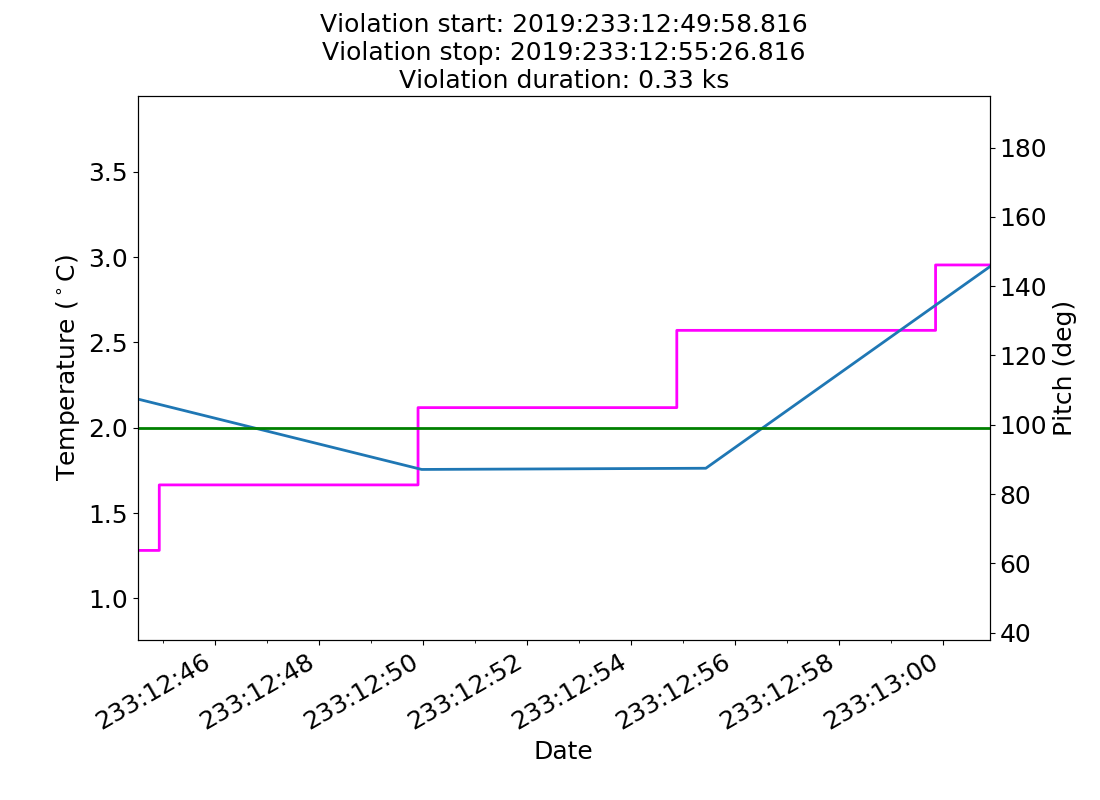
2019:233:12:49:58.816 |
2019:233:12:55:26.816 |
1.76 |
0.33 |
|
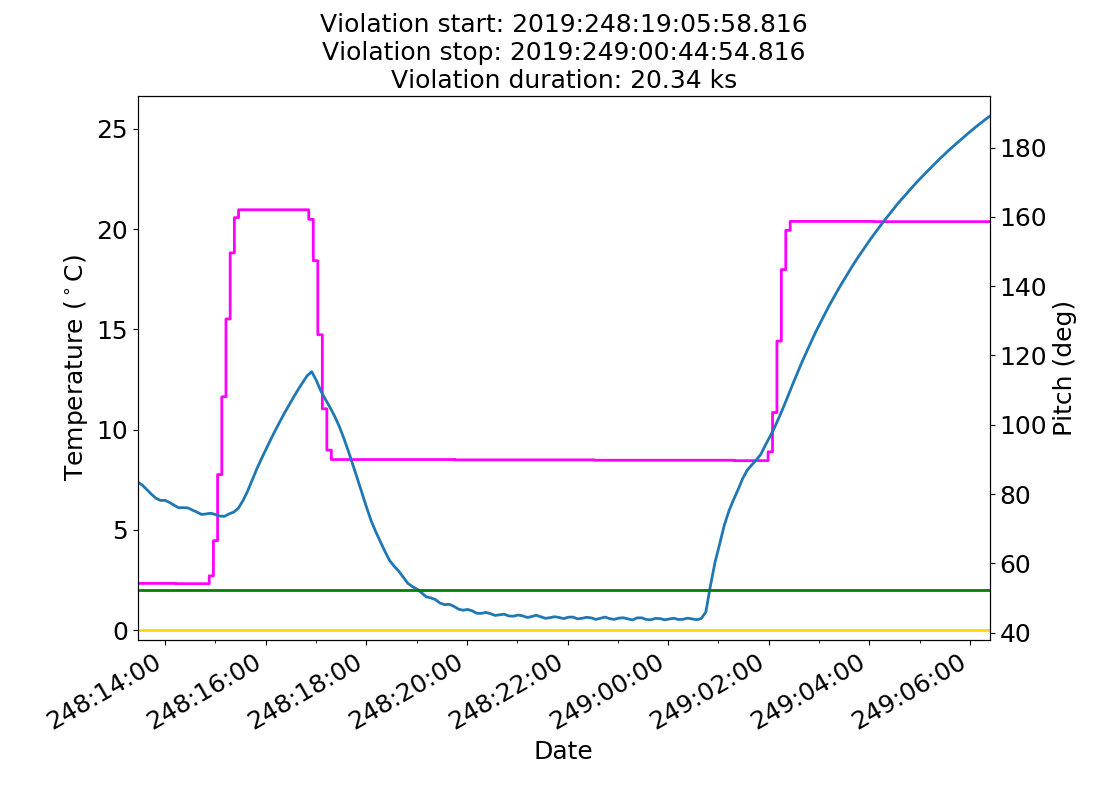
2019:248:19:05:58.816 |
2019:249:00:44:54.816 |
0.50 |
20.34 |
|
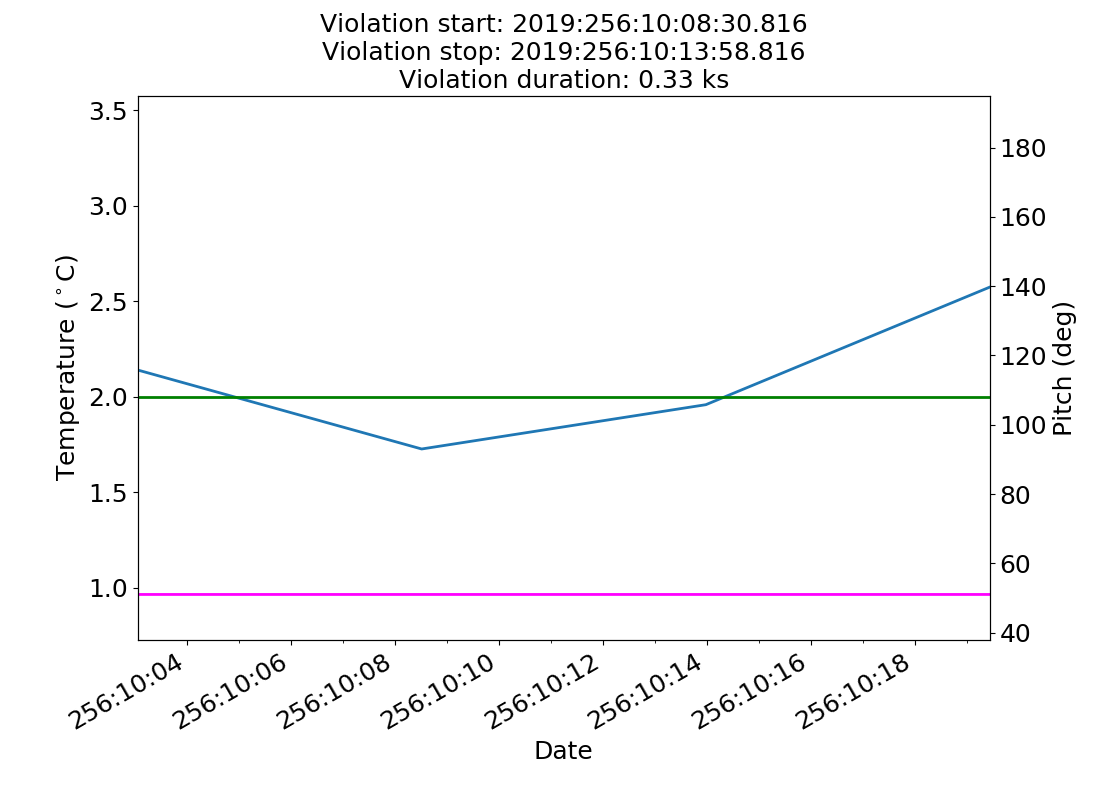
2019:256:10:08:30.816 |
2019:256:10:13:58.816 |
1.73 |
0.33 |
|
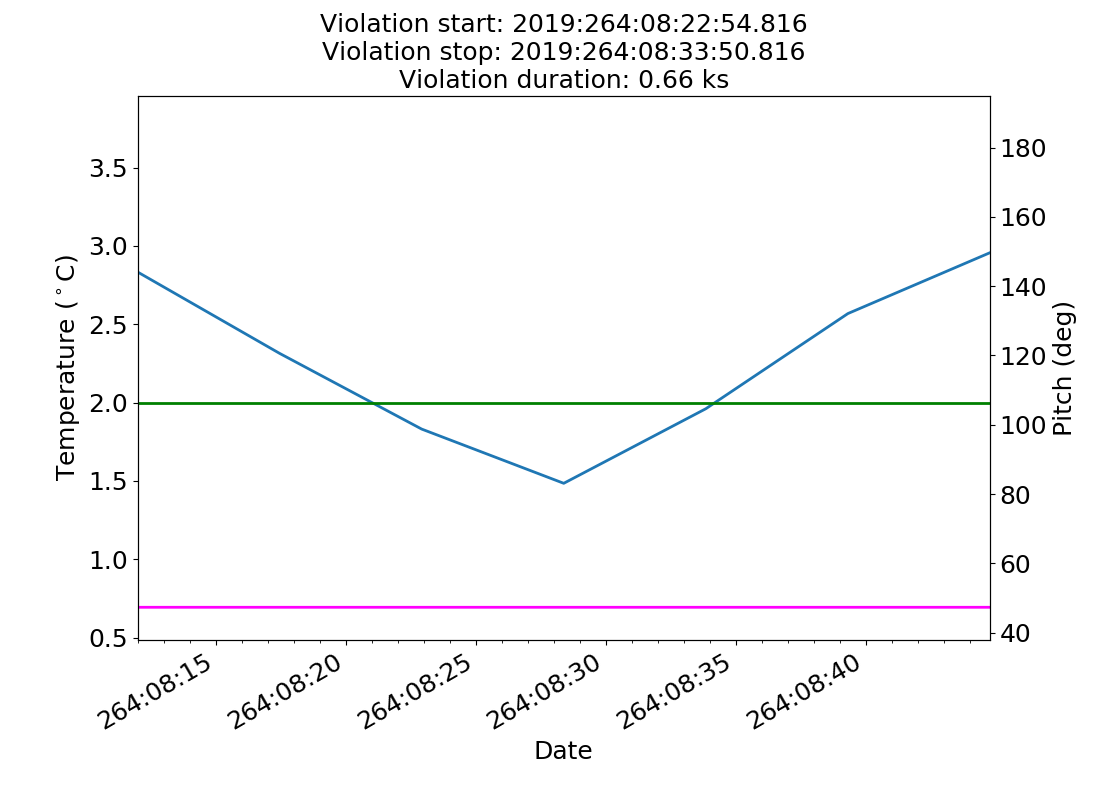
2019:264:08:22:54.816 |
2019:264:08:33:50.816 |
1.49 |
0.66 |
|
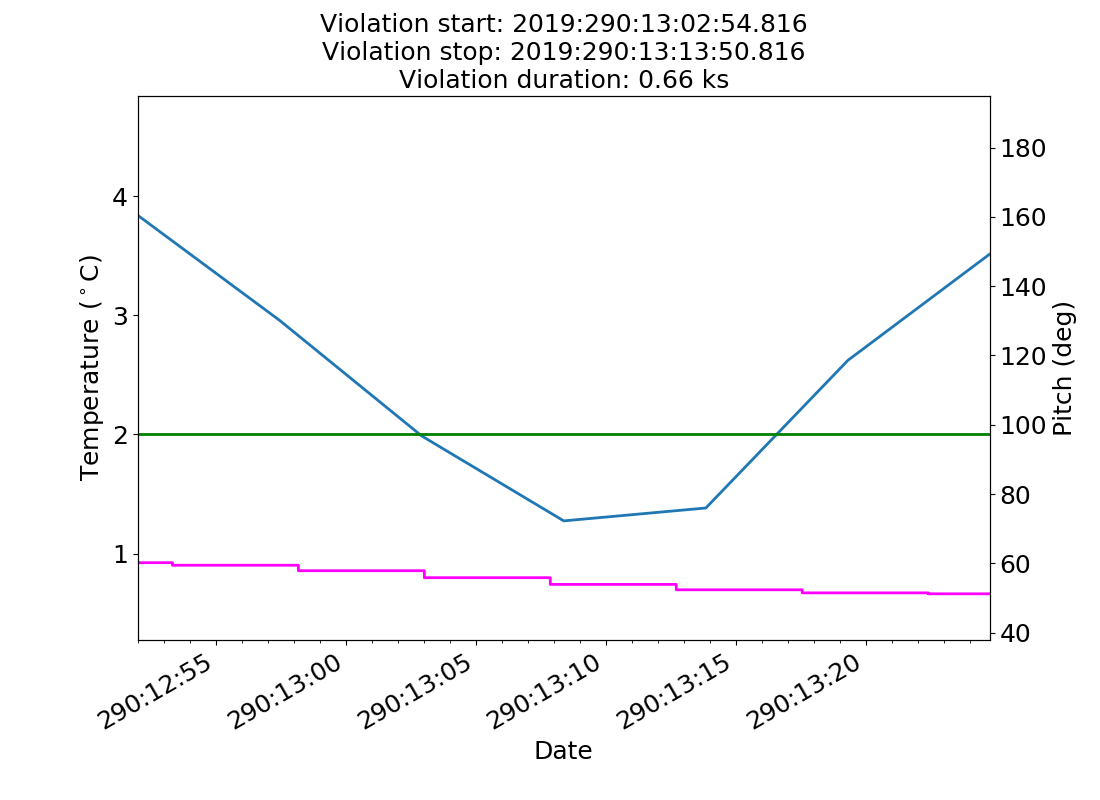
2019:290:13:02:54.816 |
2019:290:13:13:50.816 |
1.27 |
0.66 |
TMP_FEP1_FB Yellow Low Limit Violations
No yellow low limit violations during this period.
Low Violation Trends
This page was last updated at 2020:038:20:19:28.