The present targets for the Total and Cold times are:
Total time per SI Mode per measurement: 7600.0 seconds
Fraction of total time the measurement should be cold: 60.0%
Back To Top
II. Rolling Monthly
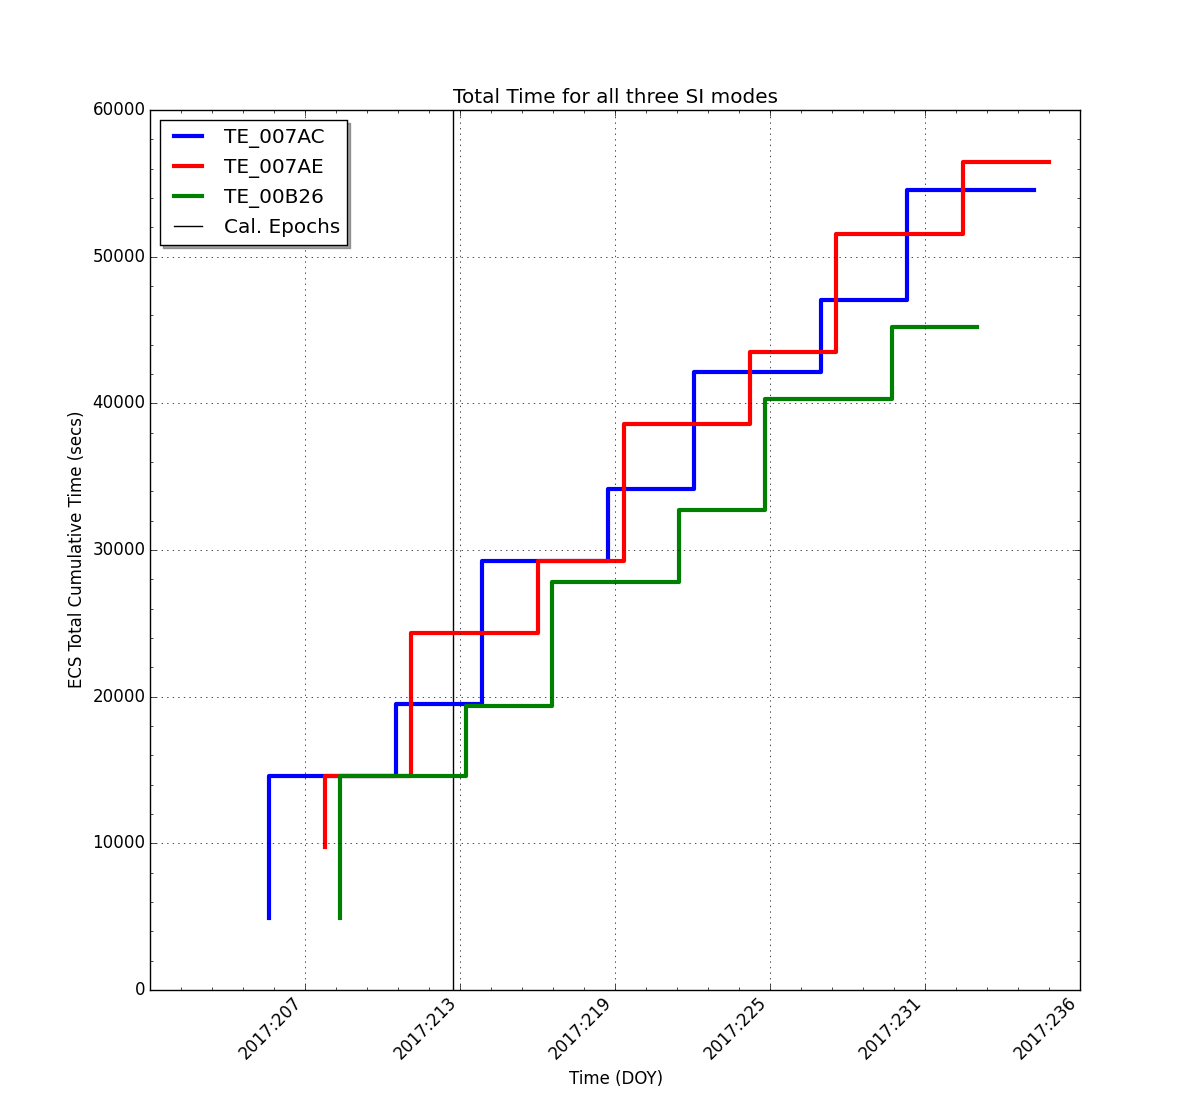
Total ECS Time:
| Stats | TE_007AC | TE_007AE | TE_00B26 |
|---|---|---|---|
| Total Expected Time (secs) | 60800 | 60800 | 53200 |
| Total Actual Time (secs) | 54536 | 56457 | 45197 |
| Delta From Expected (secs) | -6264.00 | -4343.00 | -8003.00 |
| % of Expected Total (secs) | 89.70% | 92.86% | 84.96% |
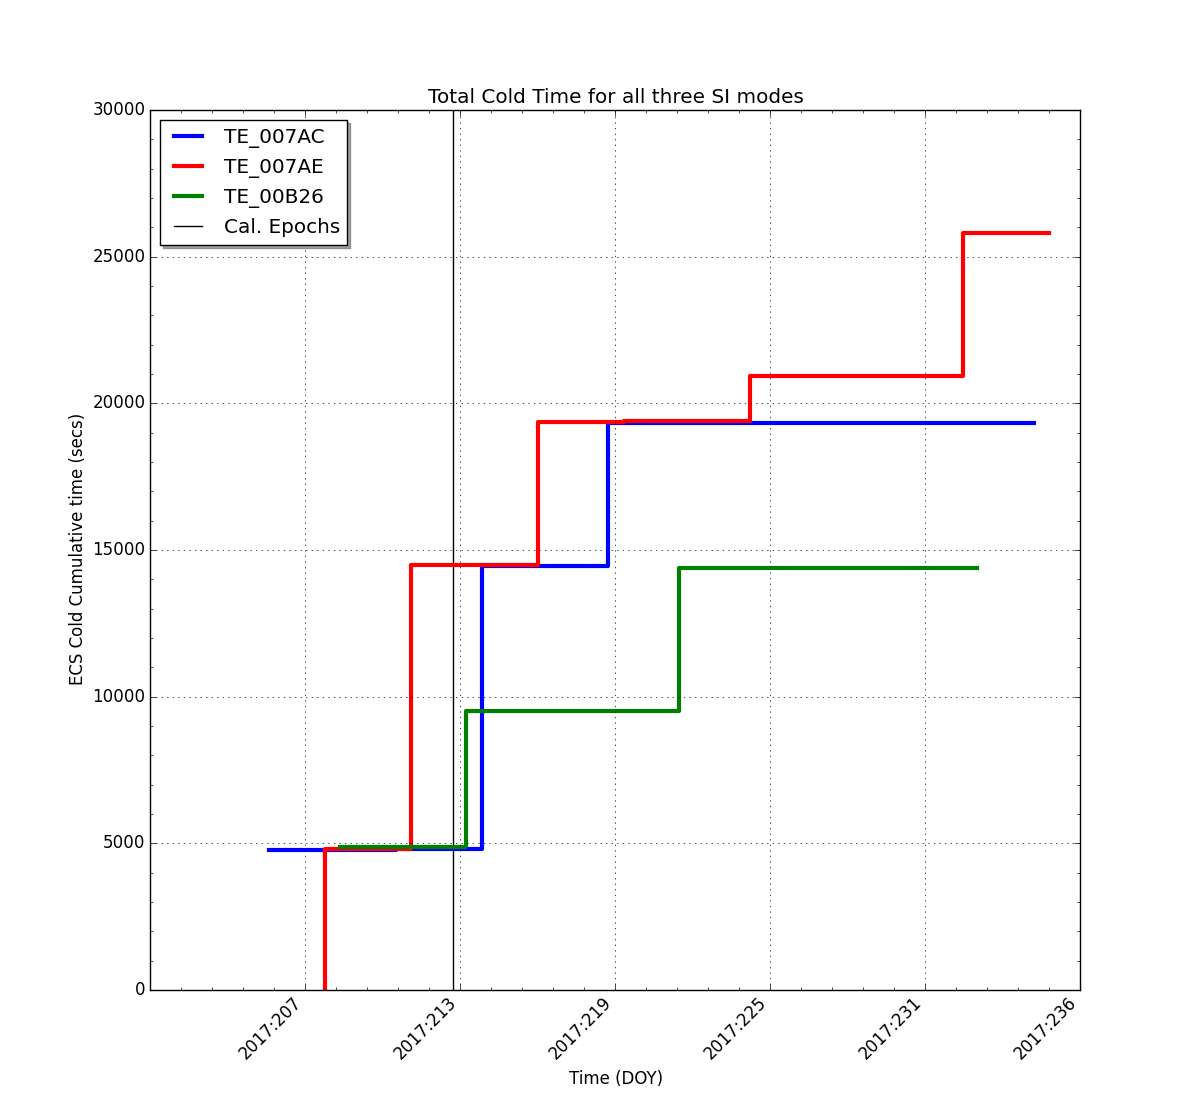
| Stats | TE_007AC | TE_007AE | TE_00B26 |
|---|---|---|---|
| Total Exp. Cold Time (secs) | 36480.0 | 36480.0 | 31920.0 |
| Total Actual Cold Time (secs) | 19344 | 25806 | 14384 |
| Delta From Expected (secs) | -17135.94 | -10673.06 | -17535.92 |
| % of Exp. Cold Total (secs) | 53.03% | 70.74% | 45.06% |
| SI Mode | Total Number of Obs. | Total Exposure Time (sec) | Average Exposure (sec/obs) | |
|---|---|---|---|---|
| Primary 6 Chip SI Modes | TE_007AC | 8 | 54536.00 | 6817.00 |
| TE_007AE | 8 | 56457.00 | 7057.13 | |
| TE_00B26 | 7 | 45197.00 | 6456.71 | Old 6 Chip SI Modes | TE_00216 | 0 | 0.00 | 0.00 |
| TE_0021C | 0 | 0.00 | 0.00 | |
| TE_008EA | 0 | 0.00 | 0.00 | 5 Chip SI Modes | TE_00C60 | 0 | 0.00 | 0.00 |
| TE_00CA8 | 0 | 0.00 | 0.00 | 4 Chip SI Modes | TE_00C62 | 0 | 0.00 | 0.00 |
III. Statistics Since the Start of the Current Epoch
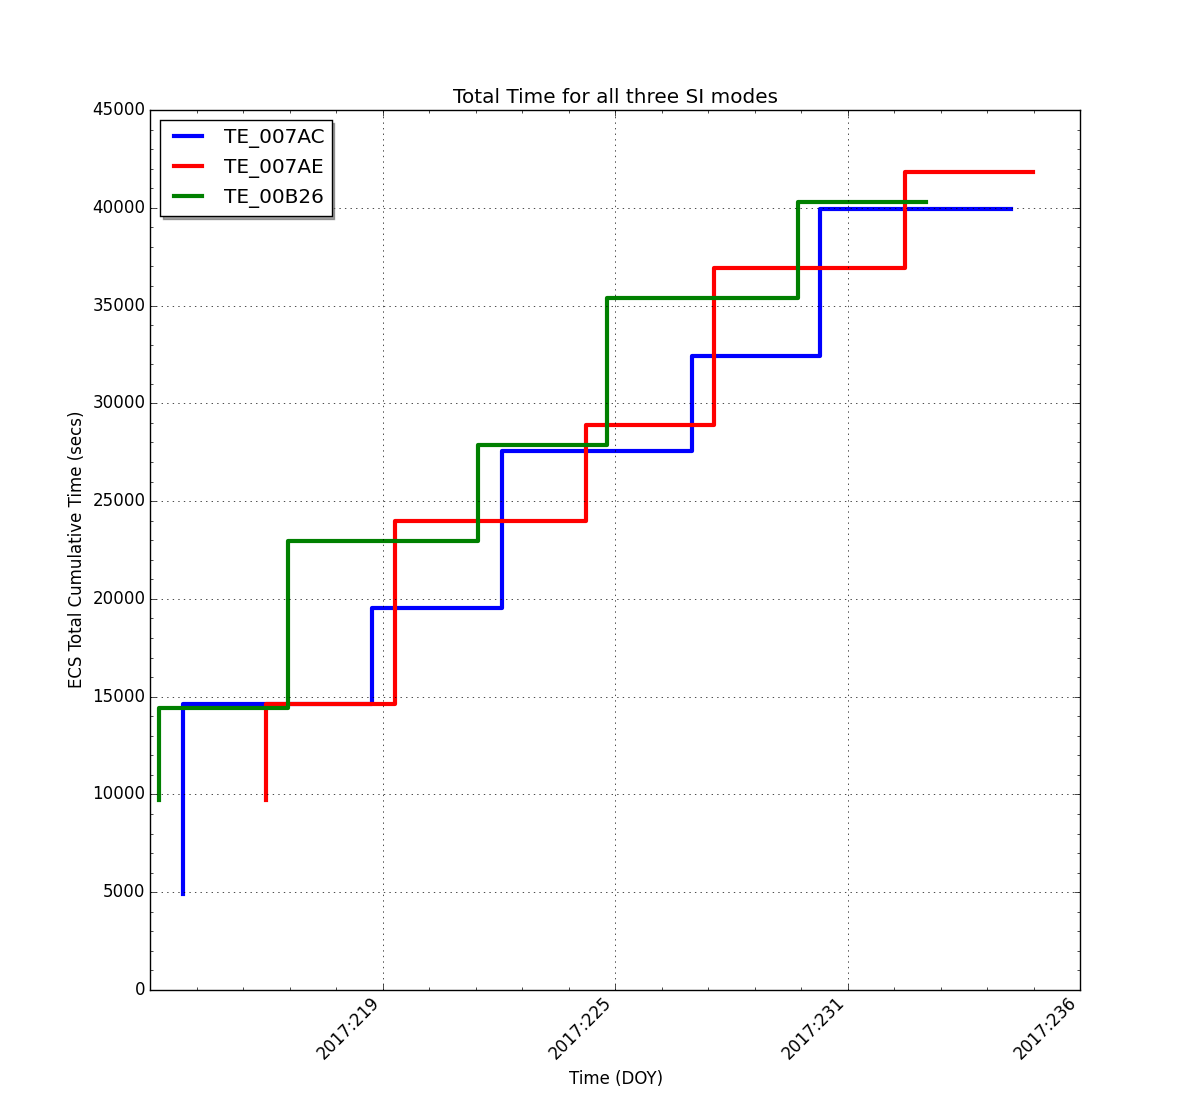
Total ECS Time:
| Stats | TE_007AC | TE_007AE | TE_00B26 |
|---|---|---|---|
| Total Expected Time (secs) | 45600 | 45600 | 45600 |
| Total Actual Time (secs) | 39922 | 41843 | 40300 |
| Delta From Expected (secs) | -5678.00 | -3757.00 | -5300.00 |
| % of Expected Total (secs) | 87.55% | 91.76% | 88.38% |
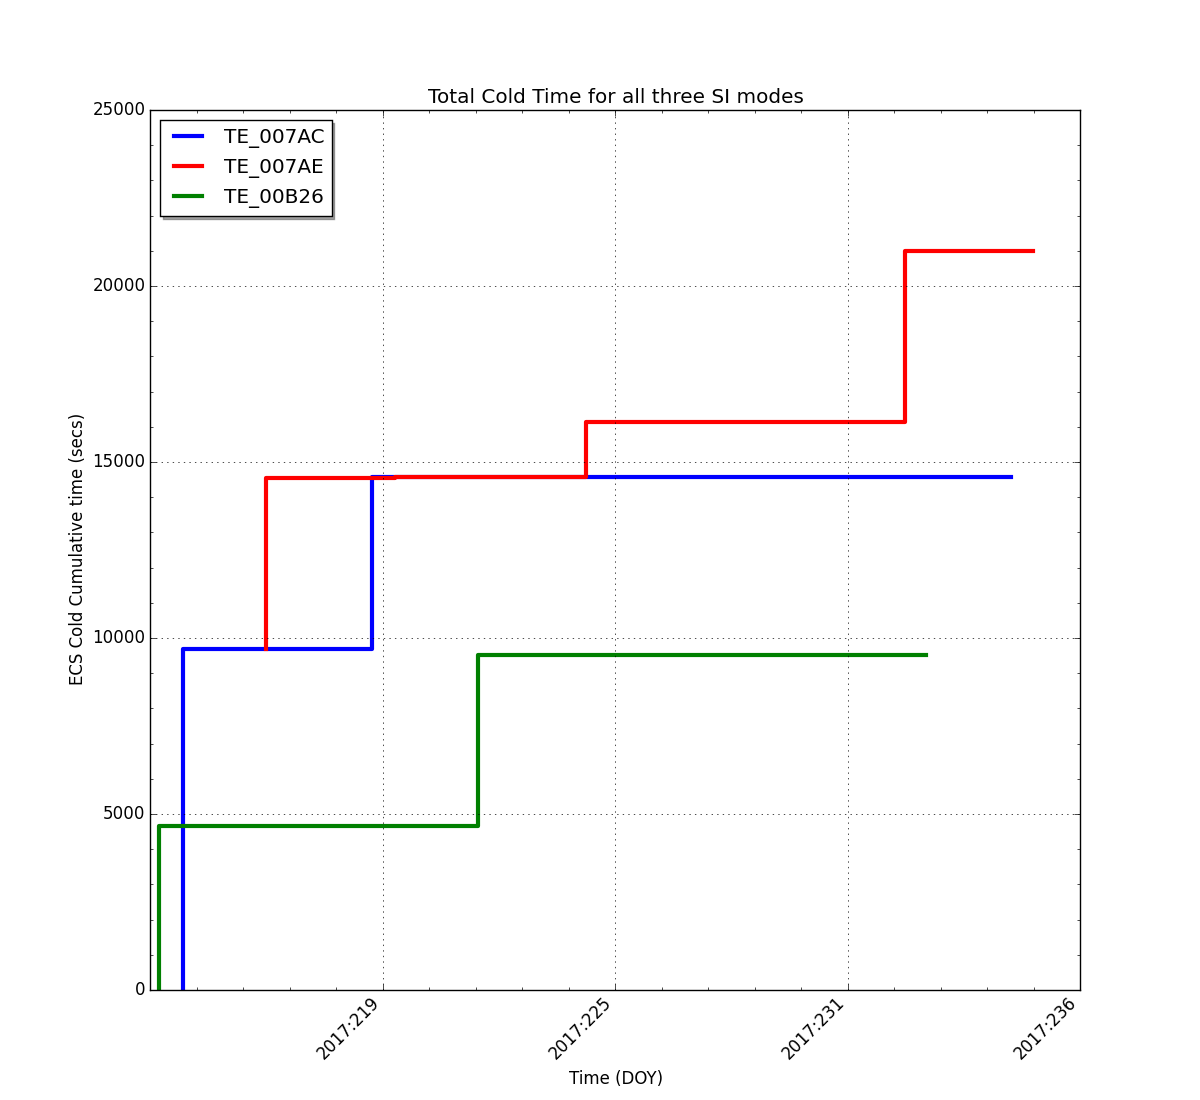
| Stats | TE_007AC | TE_007AE | TE_00B26 |
|---|---|---|---|
| Total Exp. Cold Time (secs) | 27360.0 | 27360.0 | 27360.0 |
| Total Actual Cold Time (secs) | 14565 | 20991 | 9525 |
| Delta From Expected (secs) | -12794.49 | -6368.26 | -17834.93 |
| % of Exp. Cold Total (secs) | 53.24% | 76.72% | 34.81% |
| SI Mode | Total Number of Obs. | Total Exposure Time (sec) | Average Exposure (sec/obs) | |
|---|---|---|---|---|
| Primary 6 Chip SI Modes | TE_007AC | 6 | 39922.00 | 6653.67 |
| TE_007AE | 6 | 41843.00 | 6973.83 | |
| TE_00B26 | 6 | 40300.00 | 6716.67 | Old 6 Chip SI Modes | TE_00216 | 0 | 0.00 | 0.00 |
| TE_0021C | 0 | 0.00 | 0.00 | |
| TE_008EA | 0 | 0.00 | 0.00 | 5 Chip SI Modes | TE_00C60 | 0 | 0.00 | 0.00 |
| TE_00CA8 | 0 | 0.00 | 0.00 | 4 Chip SI Modes | TE_00C62 | 0 | 0.00 | 0.00 |
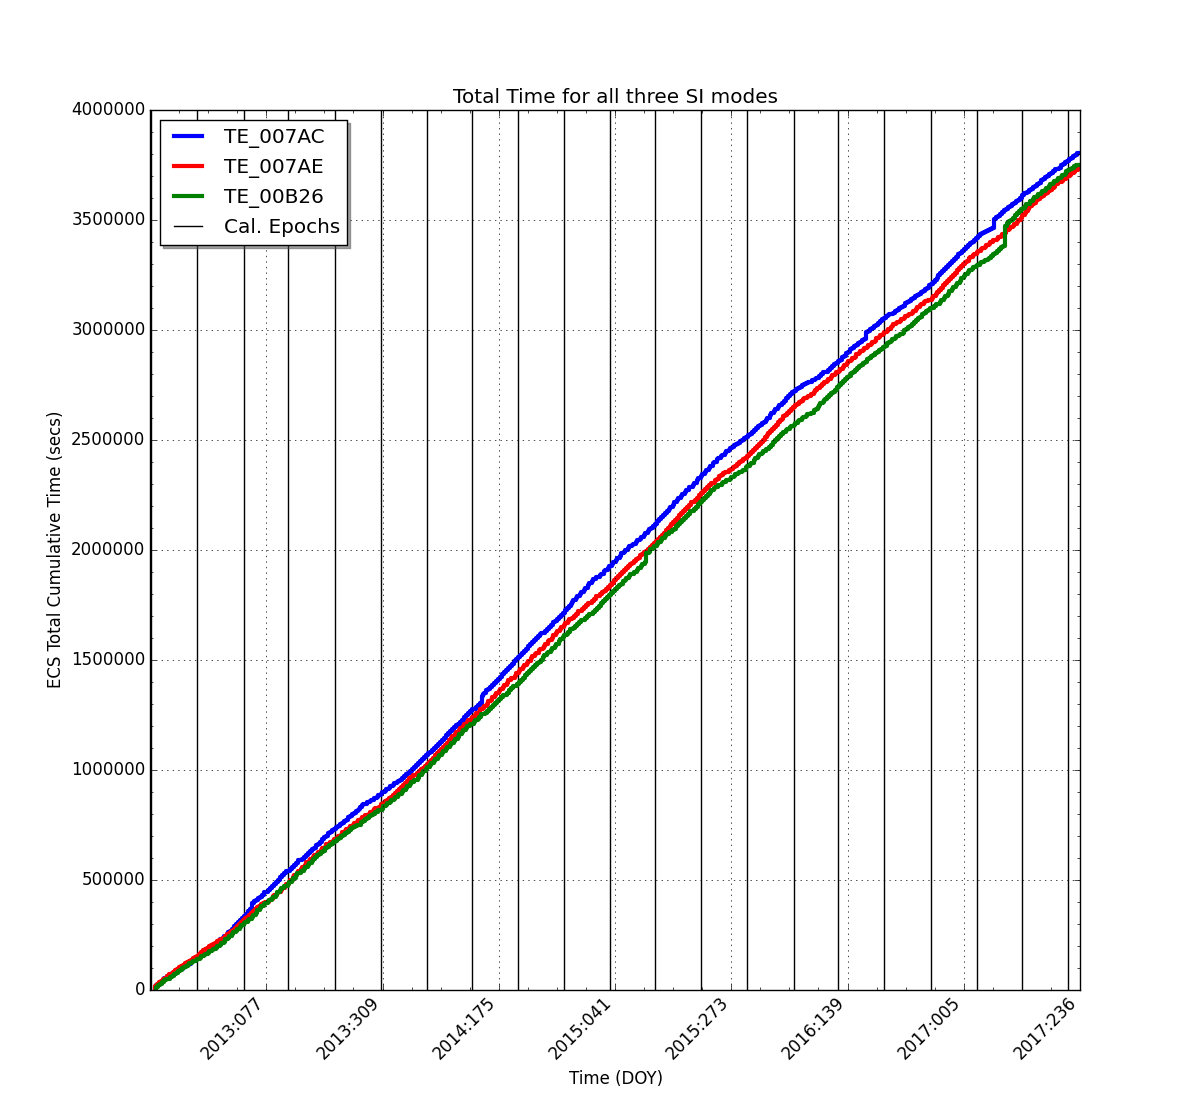
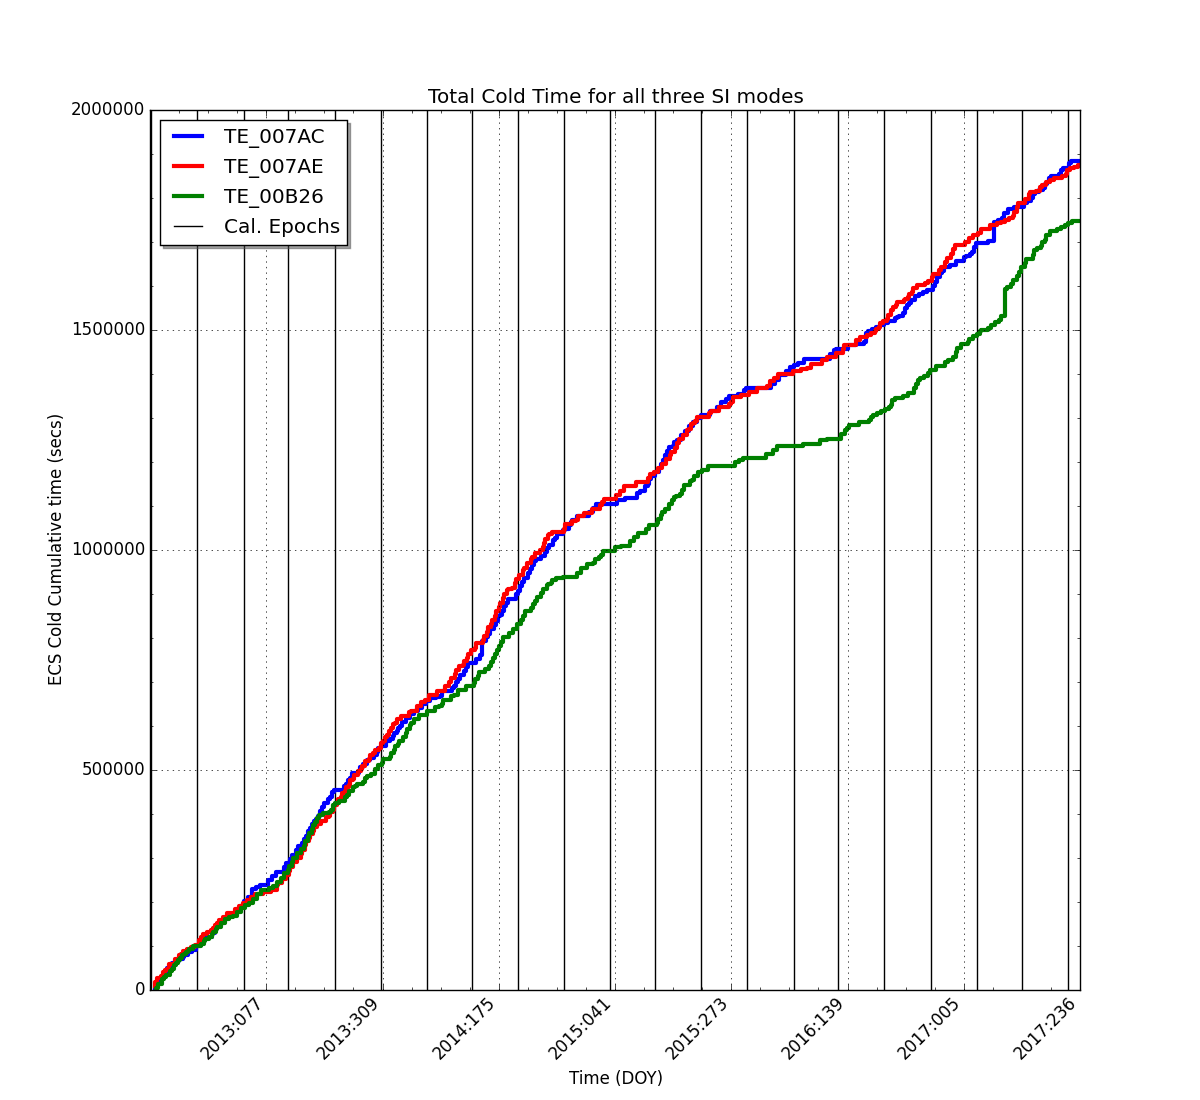
IV. Statistics Since Mid 2012
Total ECS Time:
| Stats | TE_007AC | TE_007AE | TE_00B26 |
|---|---|---|---|
| Total Expected Time (secs) | 3465600 | 3458000 | 3397200 |
| Total Actual Time (secs) | 3802451 | 3733027 | 3751077 |
| Delta From Expected (secs) | 336851.52 | 275027.04 | 353877.42 |
| % of Expected Total (secs) | 109.72% | 107.95% | 110.42% |
| Stats | TE_007AC | TE_007AE | TE_00B26 |
|---|---|---|---|
| Total Exp. Cold Time (secs) | 2079360.0 | 2074800.0 | 2038320.0 |
| Total Actual Cold Time (secs) | 1883491 | 1875583 | 1747403 |
| Delta From Expected (secs) | -195868.33 | -199216.97 | -290916.81 |
| % of Exp. Cold Total (secs) | 90.58% | 90.40% | 85.73% |
| SI Mode | Total Number of Obs. | Total Exposure Time (sec) | Average Exposure (sec/obs) | |
|---|---|---|---|---|
| Primary 6 Chip SI Modes | TE_007AC | 454 | 3749174.52 | 8258.09 |
| TE_007AE | 454 | 3723310.04 | 8201.12 | |
| TE_00B26 | 445 | 3655317.93 | 8214.20 | Old 6 Chip SI Modes | TE_00216 | 5 | 478338.25 | 95667.65 |
| TE_0021C | 0 | 0.00 | 0.00 | |
| TE_008EA | 0 | 0.00 | 0.00 | 5 Chip SI Modes | TE_00C60 | 2 | 16400.00 | 8200.00 |
| TE_00CA8 | 1 | 9717.00 | 9717.00 | 4 Chip SI Modes | TE_00C62 | 2 | 132636.50 | 66318.25 |