MTA Monitoring Report 05/22/08 - 05/29/08
Archive of all weekly reports
Archive of monthly reports
Quiet.
Although we have quoted CTI values of the cleanest data (FT <= -119.7 C, int time > 7000sec),
the data fills these conditions are getting rare. From this week,
we quote CTI temperature factor corrected ones. The values in the parentheses are
CTI based on the cleanest data.
| Average of ACIS-I CCDs (MnKa) slope: | 1.525e-9 CTI/day | (2.227e-9 CTI/day) |
| Detrended slope: | 7.038e-9 CTI/day | (7.427e-9 CTI/day) |
We display all bad pixels showed up in past, and, if any, previously unknown
bad pixels appeared in the last 14 days.
We also list hot pixels (defined as 1000 above
the average of bias background).
Warm columns 509-514 are probably due to a computational artificial effect
due to boundaries.
| | CCD0 | CCD1 | CCD2 | CCD3 | CCD4 | CCD5 | CCD6 | CCD7 | CCD8 | CCD9 |
|---|
| Previously Unknown Bad Pixels
|
|
|
|
|
|
|
|
|
|
|
| Current Warm Pixels
|
|
|
|
|
|
|
|
|
|
|
| Flickering Warm Pixels
| (153,205)
| (427,125) (802,665)
| (526,66)
| (703,739) (931,553)
| (247,364) (227,467)
|
(233,321) (233,322)
(233,323) (233,324)
(369,376) (352,544)
(258,797) (669,577)
| (360,249)
| (662,995)
|
(197,241) (391,982)
(881,53)
| (636,819)
|
| Current Hot Pixels
|
|
|
|
|
|
|
|
|
|
|
| Flickering Hot Pixels
|
|
|
|
|
|
|
|
|
|
|
| Warm column candidates
|
|
|
|
|
|
| 518
|
| 509
|
|
| Flickering Warm Column Candidates
| 509
| 509 514 1021
|
|
|
|
| 509 514 1021
|
| 509 514 518 1021
|
|
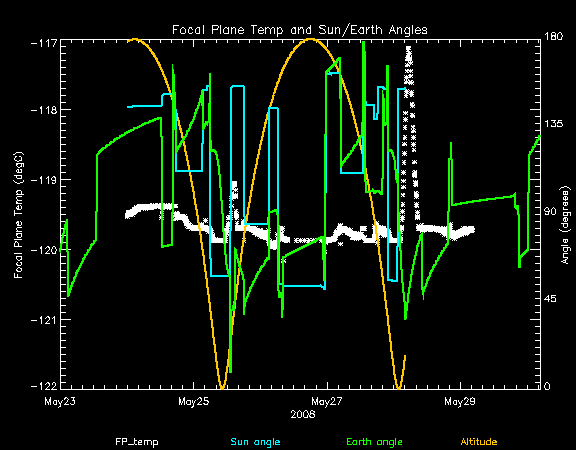
For this period 2 peaks are observed.
| Day (DOY) | Temp (C) | Width (Days) | |
|---|
| 146.99 | -119.06 | 0.12 | |
| 149.23 | -117.12 | 0.24 | |
Weekly focal plane temperature with sun angle, earth angle, and altitude overplotted. Sun angle is the solar array angle, that is the angle between the sun and the optical axis (+X axis). The earth angle is the angle between earth and the ACIS radiator (+Z axis). Altitude varies from 34 kkm to 128 kkm.
12 TSC moves this period
weekly average time/step 0.00127 s
mission average time/step 0.00135 s
New violations or new extrema are shown in blue cells.
| MSID
| 05/23/08 |
05/24/08 |
05/25/08 |
05/26/08 |
05/27/08 |
05/28/08 |
05/29/08 |
yellow limits
(lower)
upper
| red limits
(lower)
upper
| Units | Description
|
| 1CBAT
| (203.40) |
(205.86) |
(200.95) |
(200.95) |
(200.95) |
(200.95) |
(203.40) |
(210.16)
216.16 | (197.66)
223.16
| K | #CAMERA BODY TEMP. A
|
| 1CBBT
| (203.40) |
(205.86) |
(200.95) |
(200.95) |
(200.95) |
(200.95) |
(203.40) |
(210.16)
216.16 | (197.66)
223.16
| K | #CAMERA BODY TEMP. B
|
| 1CRAT
| |
|
|
(142.83) |
|
|
|
(143.16)
148.16 | (131.16)
183.16
| K | #COLD RADIATOR TEMP. A
|
| 1CRAT
| |
|
|
|
|
150.00 |
|
(143.16)
148.16 | (131.16)
183.16
| K | #COLD RADIATOR TEMP. A
|
| 1CRBT
| |
|
|
|
|
150.00 |
|
(143.16)
148.16 | (131.16)
183.16
| K | #COLD RADIATOR TEMP. B
|
| 1OAHBT
| |
|
|
(233.08) |
|
|
|
(233.16)
293.16 | (216.66)
309.66
| K | #OPEN ACTUATOR HOUSING TEMP. B
|
| 1WRAT
| |
|
(183.83) |
(183.83) |
(183.83) |
(183.83) |
|
(185.16)
198.16 | (169.66)
213.16
| K | #WARM RADIATOR TEMP. A
|
| 1WRBT
| |
|
(183.83) |
(183.83) |
(183.83) |
(183.83) |
|
(185.16)
198.16 | (169.66)
213.16
| K | #WARM RADIATOR TEMP. B
|
| 1DPPWRA
| |
|
|
(11.74) |
(18.70) |
|
|
(23.4)
59.5 | (-999)
999
| W | # DPA POWER A
|
| 1DPPWRB
| |
|
|
(7.26) |
(7.46) |
|
|
(18.2)
59.5 | (-999)
999
| W | # DPA POWER B
|
| 5EPHINT
| 317.71 |
315.58 |
318.14 |
318.14 |
318.99 |
318.56 |
314.73 |
(261.0)
300.0 | (258.0)
303.0
| K | #EPHIN TEMP
|
| HKEBOXTEMP
| 322.29 |
322.29 |
322.29 |
322.97 |
323.67 |
322.97 |
|
(268.0)
308.0 | (253.0)
343.0
| K | #EPHIN HOUSEKEEPING EBOX: TEMPERATURE (5EHSE300)
|
| HKFBIASLEAKI
| 3.37 |
3.37 |
3.43 |
3.50 |
3.73 |
3.60 |
|
(-100.0)
2.0 | (-200.0)
3.0
| uA | #EPHIN HOUSEKEEPING F-BIAS: LEAKAGE CURRENT (5EHSE900)
|
| TEIO
| |
|
333.98 |
337.13 |
|
|
|
(253.0)
320.2 | (250.2)
323.0
| K | #EPHIN ELECTRONICS HOUSING TEMP
|
| TEPHIN
| 317.77 |
316.12 |
318.59 |
318.59 |
319.42 |
318.59 |
|
(260.8)
300.2 | (258.0)
303.0
| K | #EPHIN SENSOR HOUSING TEMP
|
| TFSSBKT1
| |
|
344.71 |
346.67 |
342.75 |
|
|
(237.4)
333.0 | (223.0)
348.0
| K | #FSS BRACKET-1 TEMP (+Y)
|
| TFSSBKT2
| |
|
344.71 |
346.67 |
|
|
|
(237.4)
333.0 | (223.0)
348.0
| K | #FSS BRACKET-2 TEMP (-Y)
|
| TMZLGABM
| 328.72 |
|
|
|
|
|
|
(244.1)
321.9 | (208.0)
388.0
| K | #-Z LOW-GAIN ANTENNA BOOM TEMP
|
| TRSPMTPC
| |
|
|
295.00 |
295.00 |
|
|
(260.8)
294.1 | (216.3)
349.7
| K | #RAD SHR PNL TEMP:TTWN MUPS AND PCAD
|
| TSCTSF1
| |
|
|
|
295.00 |
|
|
(260.8)
294.1 | (253.0)
303.0
| K | #SC-TS FITTING -1 TEMP
|
| 4RT581T
| |
|
|
288.83 |
|
|
|
(281.9)
288.6 | (250.2)
308.0
| K | #RT 581 - OB CONE TEMP
|
| 4RT590T
| |
|
|
288.75 |
290.01 |
289.76 |
289.00 |
(281.9)
288.6 | (250.2)
308.0
| K | #RT 590 - STRUT TEMP
|
| 4RT700T
| 288.83 |
|
288.83 |
288.83 |
288.83 |
288.83 |
|
(281.9)
288.6 | (250.2)
308.0
| K | #RT 700 - OB BULKHEAD TEMP
|
| OOBTHR26
| |
|
|
289.07 |
|
|
|
(281.9)
288.6 | (250.2)
308.0
| K | #RT 48: OBA CONE
|
| OOBTHR28
| |
|
|
288.64 |
|
|
|
(281.9)
288.6 | (250.2)
308.0
| K | #RT 50: OBA CONE
|
| OOBTHR31
| |
|
291.11 |
291.98 |
|
|
|
(281.9)
289.7 | (250.2)
308.0
| K | #RT 53: OBA AFT BULKHEAD
|
| OOBTHR39
| 287.25 |
|
287.25 |
287.34 |
287.21 |
287.25 |
|
(281.9)
285.8 | (250.2)
308.0
| K | #RT 61: TFTE CONE
|
| OOBTHR51
| |
|
|
288.63 |
289.72 |
289.50 |
288.76 |
(281.9)
288.6 | (250.2)
308.0
| K | #RT 77: S/C STRUT
|
| OOBTHR57
| |
|
292.40 |
292.94 |
|
290.08 |
|
(281.9)
288.6 | (250.2)
308.0
| K | #RT 150: OBA CONE
|
| OBSID |
DETECTOR |
GRATING |
TARGET |
ANALYSIS |
ACA |
|---|
| 9076 |
ACIS-456789
|
HETG |
X1822-371
|
OK
|
OK |
| 9856 |
ACIS-012367
|
NONE |
Carina South Pillars Ptg 4
|
OK |
OK |
| 8906 |
HRC-I
|
NONE |
Alpha Centauri
|
OK |
OK |
| 8684 |
ACIS-01237
|
NONE |
GBSGTO4
|
OK |
OK |
| 8685 |
ACIS-01237
|
NONE |
GBSGTO4
|
OK |
OK |
| 8686 |
ACIS-01237
|
NONE |
GBSGTO4
|
OK |
OK |
| 9604 |
ACIS-235678
|
NONE |
AX J165707-4255
|
OK |
OK |
| 9857 |
ACIS-012367
|
NONE |
Carina South Pillars Ptg 3
|
OK |
OK |
| 9508 |
ACIS-012367
|
NONE |
Carina South Pillars Ptg 3
|
OK |
OK |
| 9858 |
ACIS-456789
|
HETG |
X1822-371
|
OK
|
OK |
| 8947 |
ACIS-235678
|
NONE |
NGC 6402
|
OK |
OK |
| 9600 |
HRC-I
|
NONE |
AX J153818-5541
|
OK |
OK |
| 9498 |
ACIS-012367
|
NONE |
Carina Superbubble Ptg 3
|
OK |
OK |
| 9862 |
ACIS-456789
|
NONE |
SHB 080503
|
OK |
OK |
| 9701 |
ACIS-6
|
NONE |
G21.5-09[S2,-120,5.15,0,8.0]
|
CAL |
OK |
| 9224 |
ACIS-23678
|
NONE |
SDSS J0051-0102
|
OK |
OK |
| 8965 |
ACIS-235678
|
NONE |
NGC 6139
|
OK |
OK |
| 9496 |
ACIS-012367
|
NONE |
Carina Superbubble Ptg 1
|
OK |
OK |
| 9007 |
HRC-I
|
NONE |
K 1632-477
|
OK |
OK |
| 9702 |
ACIS-6
|
NONE |
G21.5-09[S3,-120,1.0,0,0]
|
CAL |
OK |
| 9612 |
ACIS-235678
|
NONE |
AX J184738-0156
|
OK |
OK |
| 9860 |
ACIS-012367
|
NONE |
Carina Superbubble Ptg 1
|
OK |
OK |
| 9602 |
ACIS-235678
|
NONE |
AX J162011-5002
|
OK |
OK |
This week's focus is
Ground Computed Gradients..
Trends last reported on
Feb 28.
Only the most interesting or representative msids are shown below.
For a full listing choose the bulletted link.
Min/max envelopes in dark blue appear on the trending plots.
The envelopes are 4th degree fits to the monthly minimum and maximum values
for each MSID.
The final polynomial form and binning are still being experimented with. We
will soon add to the trending pages a report of the fits and predictions
they give on future limit violations. The light blue curve is our original
smoothing of all the data over 30 day moving boxcars.
The green/yellow line is a
linear fit to all the data; the break occurs at a limit change.
- HRMA Struts
| Gradients HRMA Struts |
| MSID | MEAN | RMS | DELTA/YR | DELTA/YR/YR | UNITS | DESCRIPTION |
| HSTRTGRD1 |
-2.74 |
6.424e-02 |
-7.227e-02 |
2.248e-02 |
K |
RT25-RT26: HRMA STRUTS |
| HSTRTGRD2 |
-1.75 |
0.22 |
-8.699e-02 |
-1.401e-02 |
K |
RT26-RT27: HRMA STRUTS |
- OBA Aft Bulkhead
| Gradients OBA AFT Bulkhead |
| MSID | MEAN | RMS | DELTA/YR | DELTA/YR/YR | UNITS | DESCRIPTION |
| HAFTBGRD1 |
2.57 |
2.18 |
-6.350e-02 |
-8.648e-02 |
K |
RT53-RT54: OBA AFT Bulkhead |
| HAFTBGRD2 |
0.15 |
0.17 |
-2.874e-02 |
9.527e-03 |
K |
RT54-RT55: OBA AFT Bulkhead |
- OBA Cone
| Gradients OBA Cone |
| MSID | MEAN | RMS | DELTA/YR | DELTA/YR/YR | UNITS | DESCRIPTION |
| HCONEGRD3 |
0.60 |
0.14 |
4.218e-02 |
-1.394e-03 |
K |
RT32-RT33: OBA Cone Panel |
| HCONEGRD9 |
0.98 |
0.42 |
1.439e-01 |
1.624e-02 |
K |
RT35-RT36: OBA Cone Panel |
| HCONEGRD11 |
-0.96 |
0.40 |
-1.345e-01 |
-2.056e-02 |
K |
RT36-RT37: OBA Cone Panel |
| HCONEGRD12 |
-0.44 |
0.67 |
-2.103e-01 |
-2.942e-02 |
K |
RT36-RT45: OBA Cone Panel |
| HCONEGRD17 |
-0.45 |
6.246e-02 |
-1.598e-02 |
-1.277e-03 |
K |
RT39-RT40: OBA Cone Panel |
| HCONEGRD19 |
-0.15 |
6.304e-02 |
-2.105e-02 |
NaN |
K |
RT40-RT31: OBA Cone Panel |
| HCONEGRD21 |
0.29 |
0.12 |
5.652e-02 |
8.774e-03 |
K |
RT41-RT42: OBA Cone Panel |
| HCONEGRD24 |
-0.16 |
0.20 |
-4.658e-02 |
1.016e-02 |
K |
RT42-RT49: OBA Cone Panel |
| HCONEGRD35 |
0.74 |
0.21 |
1.334e-01 |
-4.076e-02 |
K |
RT48-RT49: OBA Cone Panel |
| HCONEGRD38 |
2.35 |
0.63 |
2.763e-01 |
-1.484e-01 |
K |
RT49-RT55: OBA Cone Panel |
| HCONEGRD41 |
-0.80 |
0.31 |
-1.054e-01 |
-6.278e-03 |
K |
RT51-RT52: OBA Cone Panel |
| HCONEGRD42 |
0.53 |
0.54 |
1.914e-01 |
2.406e-02 |
K |
RT51-RT54: OBA Cone Panel |
- S/C Struts
| Gradients Spacecraft Struts |
| MSID | MEAN | RMS | DELTA/YR | DELTA/YR/YR | UNITS | DESCRIPTION |
| HSSTRTGRD2 |
-2.84 |
1.05 |
-3.676e-01 |
2.624e-02 |
K |
RT76-RT77: Spacecraft Struts |
| HSSTRTGRD3 |
-0.38 |
0.11 |
5.133e-03 |
-1.017e-03 |
K |
RT77-RT78: Spacecraft Struts |
| HSSTRTGRD4 |
3.39 |
0.85 |
3.139e-01 |
5.346e-02 |
K |
RT78-RT79: Spacecraft Struts |
- TFTE
| Gradients TFTE |
| MSID | MEAN | RMS | DELTA/YR | DELTA/YR/YR | UNITS | DESCRIPTION |
| HTFTEGRD4 |
1.39 |
0.20 |
1.179e-01 |
4.958e-03 |
K |
RT61-RT62: TFTE Cone |
| HTFTEGRD5 |
1.25 |
0.20 |
1.477e-01 |
-4.202e-02 |
K |
RT62-RT63: TFTE Cone |
| HTFTEGRD6 |
-2.67 |
0.34 |
-2.314e-01 |
NaN |
K |
| HTFTEGRD8 |
-27.37 |
0.86 |
-3.331e-01 |
2.275e-02 |
K |
RT65-RT66: TFTE Cover |
| HTFTEGRD9 |
-2.57 |
0.23 |
-8.073e-02 |
-4.696e-03 |
K |
RT66-RT67: TFTE Cover |
| HTFTEGRD10 |
2.51 |
0.24 |
1.452e-01 |
NaN |
K |
RT67-RT68: TFTE Cover |
)
)
)
)
)
)
)
)
)
)
)
)
)
)
)
)
)
)
)
)
)
)
)
)
)