ACIS
ACIS DOSE Registered-Photon-Map
The steps we took to compute the dose map are;
- Level 1 Event files for a specified month are obtained from archive.
- Image data including I2, I3, S2, S3 CCDs are extracted from all event files.
- All the extracted image data were merged to create a month long exposure map for the month.
- The exposure map is opened with ds9, and check a distribution of count rates against energy. From this, estimate the upper threshold value. Any events beyond this upper threshold are assumed erroneous events such as bad pixels.
- Using this upper threshold, the data is filtered, and create a cleaned exposure map for the month.
- The exposure map from each month from the Sep 1999 is added up to create a cumulative exposure map for each month.
- Using fimgstatistic, we compute count rate statistics for each CCDs.
- For observations with high data drop rates (e.g., Crab nebula, Cas A), we corrected the observations by adding events.
-
Note: Counts and RMS's of Cumulative maps are lower than the previous months.
This is because we excluded extreme outliers.
Please check more detail plots at Telemetered Photon Dose Trend page.
)
)
)
Statistics:
# IMAGE     NPIX        MEAN           RMS              MIN     MAX
ACIS_may10 6004901       8.928         13.525           0.0     730.0

 I2 node 0  262654      10.494629       4.096922        0.0      77.0
 I2 node 1  262654      11.192232       4.622033        0.0     265.0
 I2 node 2  262654      11.185078       4.279077        0.0      83.0
 I2 node 3  262654      11.490428       4.742378        0.0      66.0

 I3 node 0  262654      11.457857       4.588695        0.0      52.0
 I3 node 1  262654      11.678478       11.416985       0.0     263.0
 I3 node 2  262654      10.392105       3.936978        0.0      80.0
 I3 node 3  262654      10.329338       3.999309        0.0     191.0

 S2 node 0  262654      11.995060       4.599936        0.0      64.0
 S2 node 1  262654      12.553303       5.482137        0.0      96.0
 S2 node 2  262654      12.826134       5.145581        0.0     131.0
 S2 node 3  262654      12.187813       4.529559        0.0     623.0

 S3 node 0  262654      11.574023       4.818503        0.0     108.0
 S3 node 1  262654      12.864064       4.614626        0.0      70.0
 S3 node 2  262654      12.483869       3.922545        0.0      47.0
 S3 node 3  262654      11.470331       3.728100        0.0      47.0
)
)
)
Statistics:
 IMAGE        NPIX      MEAN          RMS              MIN    MAX
ACIS_total  6004901    1403.70          1892.25         0.0    85646.0

 I2 node 0  262654      1142.897991     217.281973      0.0     5465.0
 I2 node 1  262654      1204.513974     289.910310      0.0     21489.0
 I2 node 2  262654      1242.105698     270.215490      0.0     8717.0
 I2 node 3  262654      1237.689132     315.166408      0.0     27531.0

 I3 node 0  262654      1300.480380     318.986053      0.0     6130.0
 I3 node 1  262654      1363.444370     1004.678503     0.0     26065.0
 I3 node 2  262654      1179.645752     210.029903      0.0     5386.0
 I3 node 3  262654      1167.713406     225.791950      0.0     21206.0

 S2 node 0  262654      1684.826107     229.471874      855.0   19990.0
 S2 node 1  262654      1791.163006     376.997853      880.0   9674.0
 S2 node 2  262654      1983.461160     367.010472      1137.0  13747.0
 S2 node 3  262654      1908.601769     258.331861      1109.0  28324.0

 S3 node 0  262654      2842.583747     1340.886811     1178.0  11338.0
 S3 node 1  262654      4090.175253     1831.499171     0.0     12154.0
 S3 node 2  262654      3075.912186     857.263017      1107.0  7707.0
 S3 node 3  262654      2351.275696     374.286547      1252.0  8903.0
)
|
)
|
)
|
)
|
| Mar 2010 | Dec 2009 | Sep 2009 | Jun 2009 |
|---|
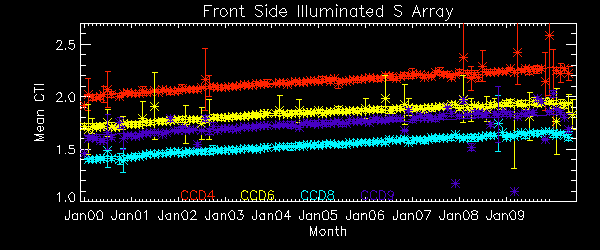
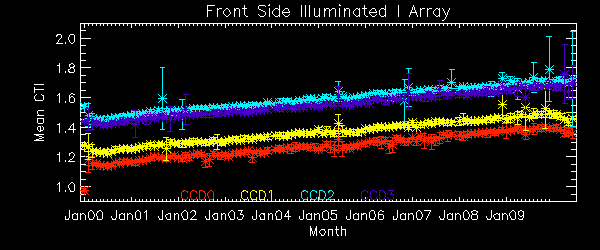
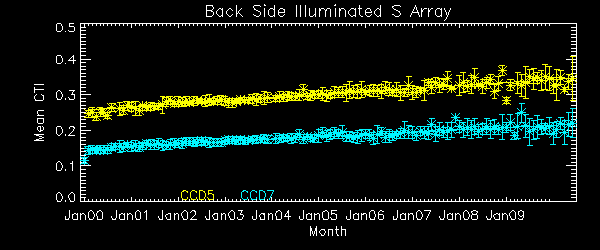
The Mean Detrended CTI
We report CTIs with a refined data definition. CTIs were computed for the temperature dependency corrected data. Please see CTI page for detailed explanation. CTI's are computed for Mn K alpha, and defined as slope/intercept x10^4 of row # vs ADU. Data file: here
Focal Plane Temperature
Jun 2010 Focal Temperature
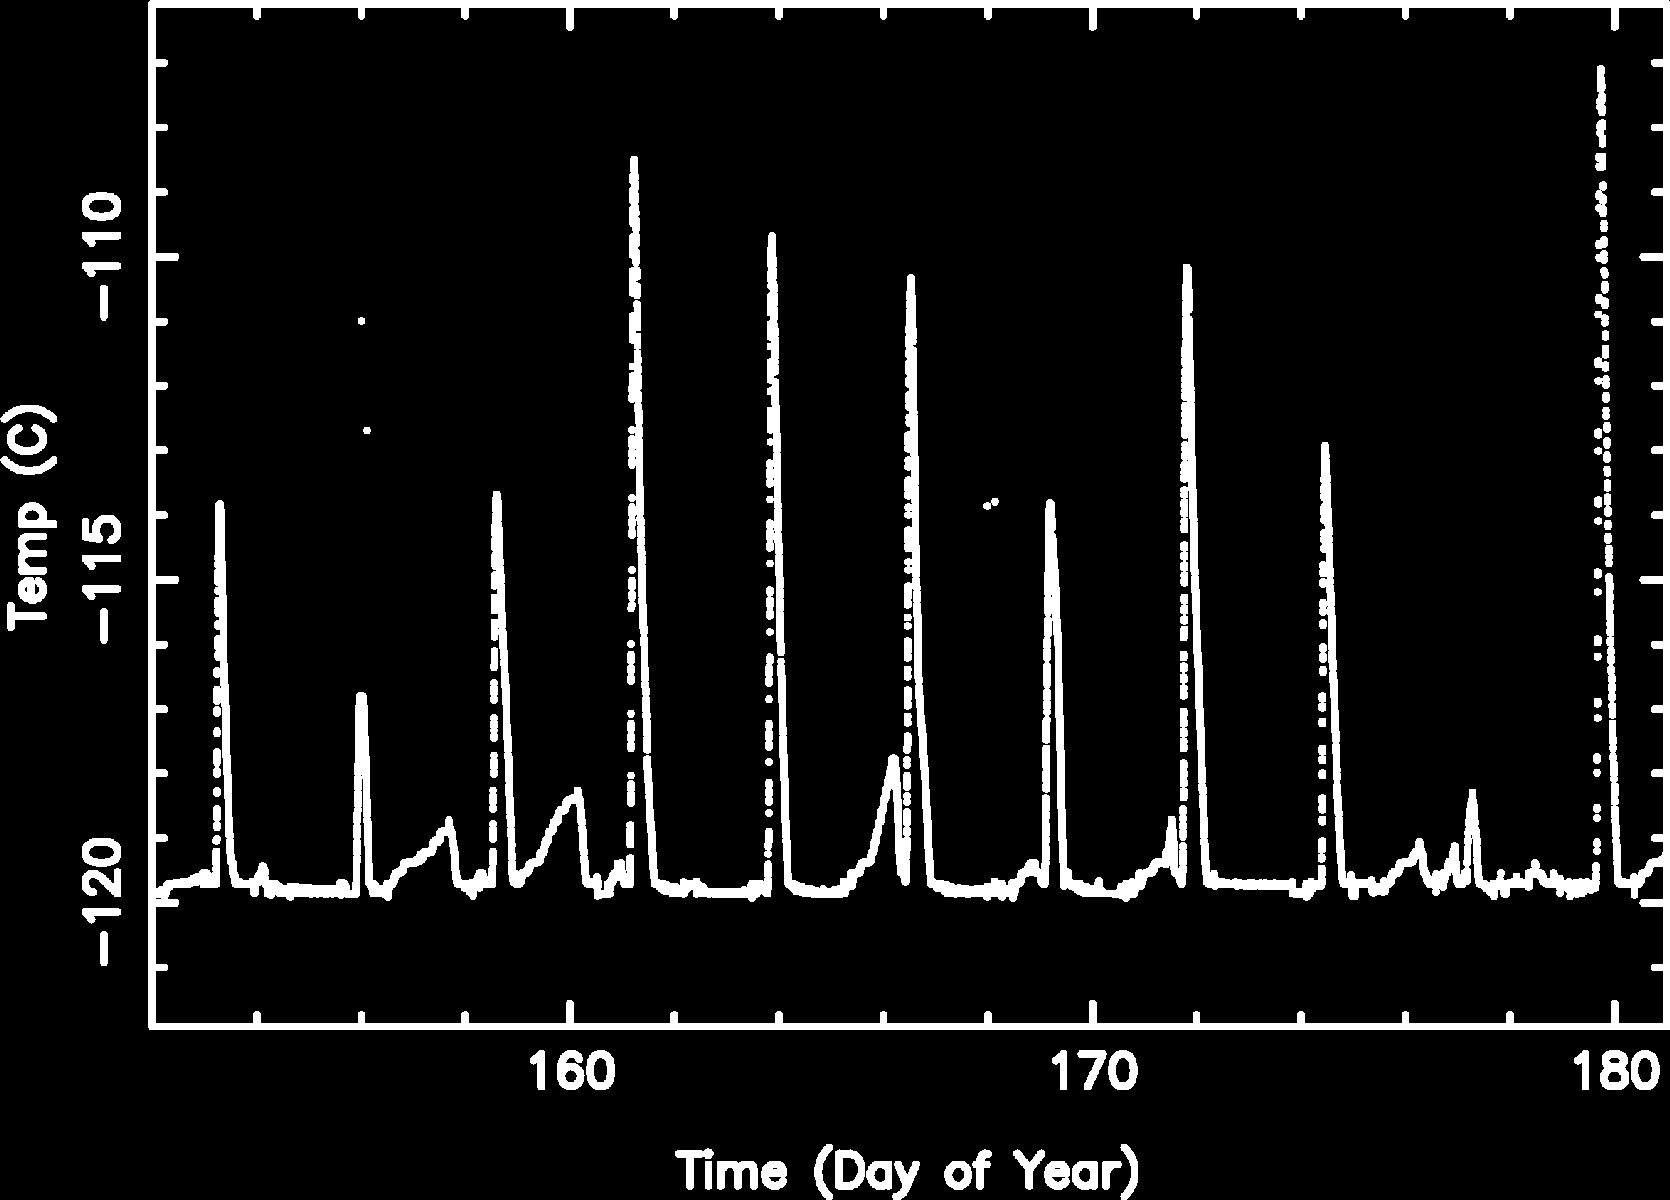
| The Mean (max) FPT: | |
|---|---|
| -113.88 | +/- 3.90 C |
| Mean Width: | |
| 0.43 | +/- 0.21 days |
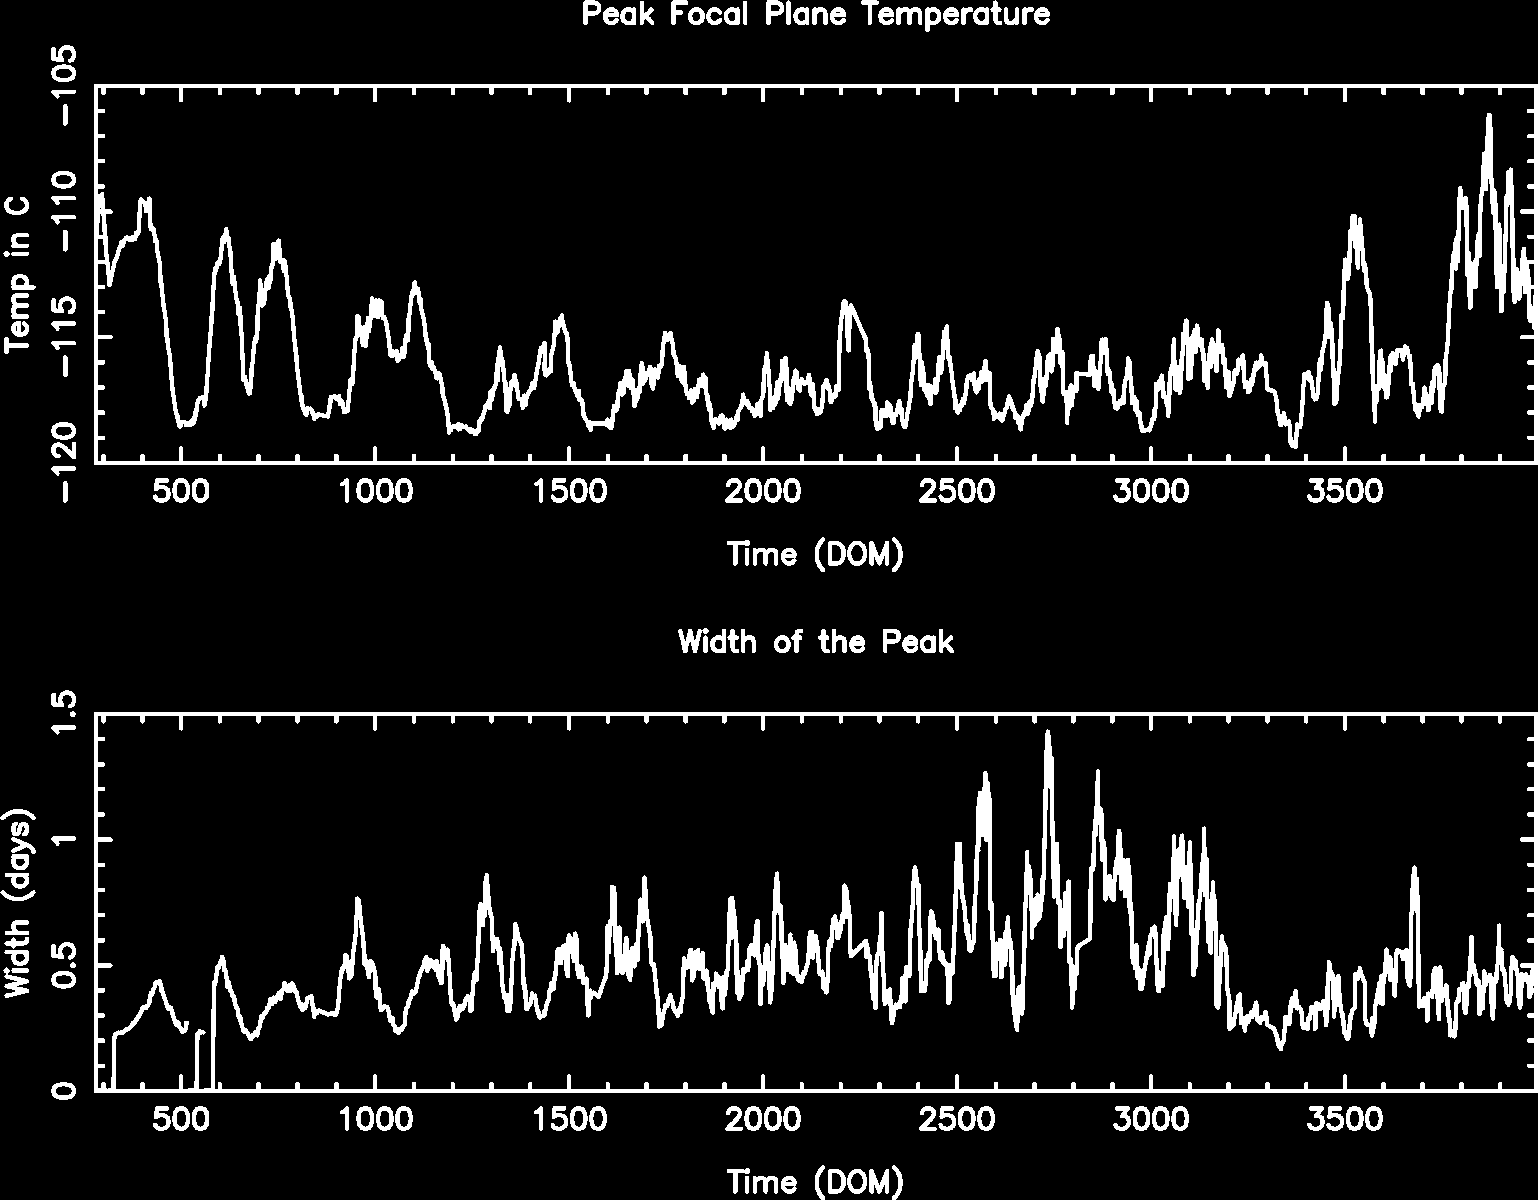
Averaged Focal Plane Temperature
We are using 10 period moving averages to show trends of peak temperatures and peak widths. Note, the gaps in the width plot are due to missing/corrupted data.
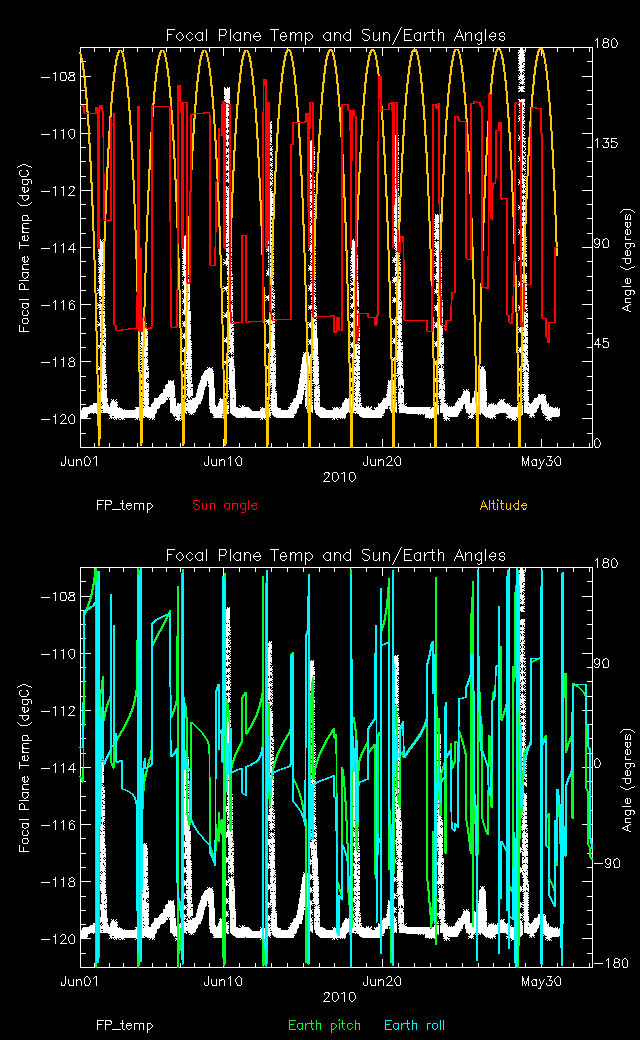
Focal Plane Temperature and Sun Angle, Earth Engle, and Altitude
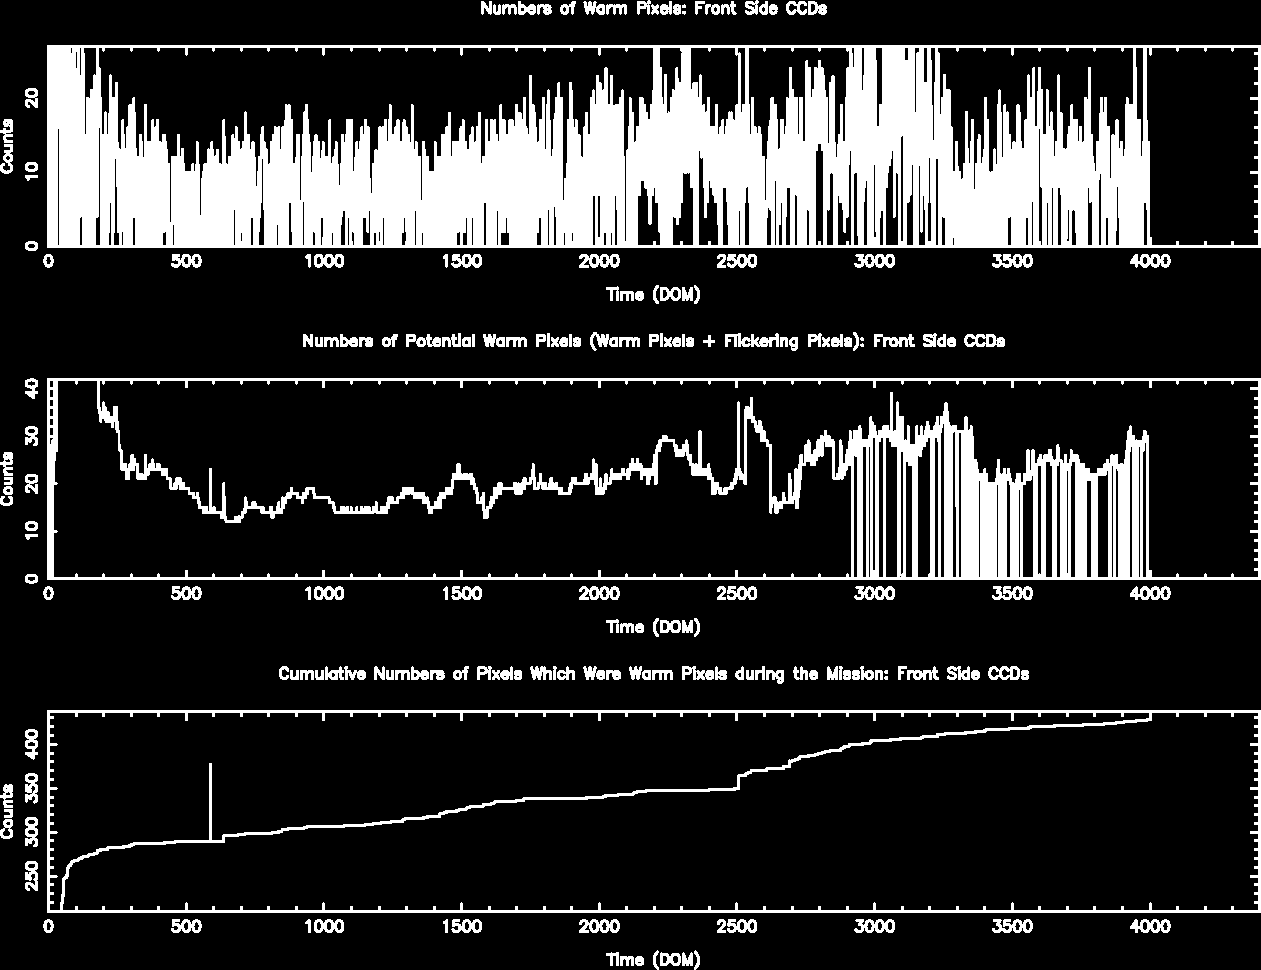
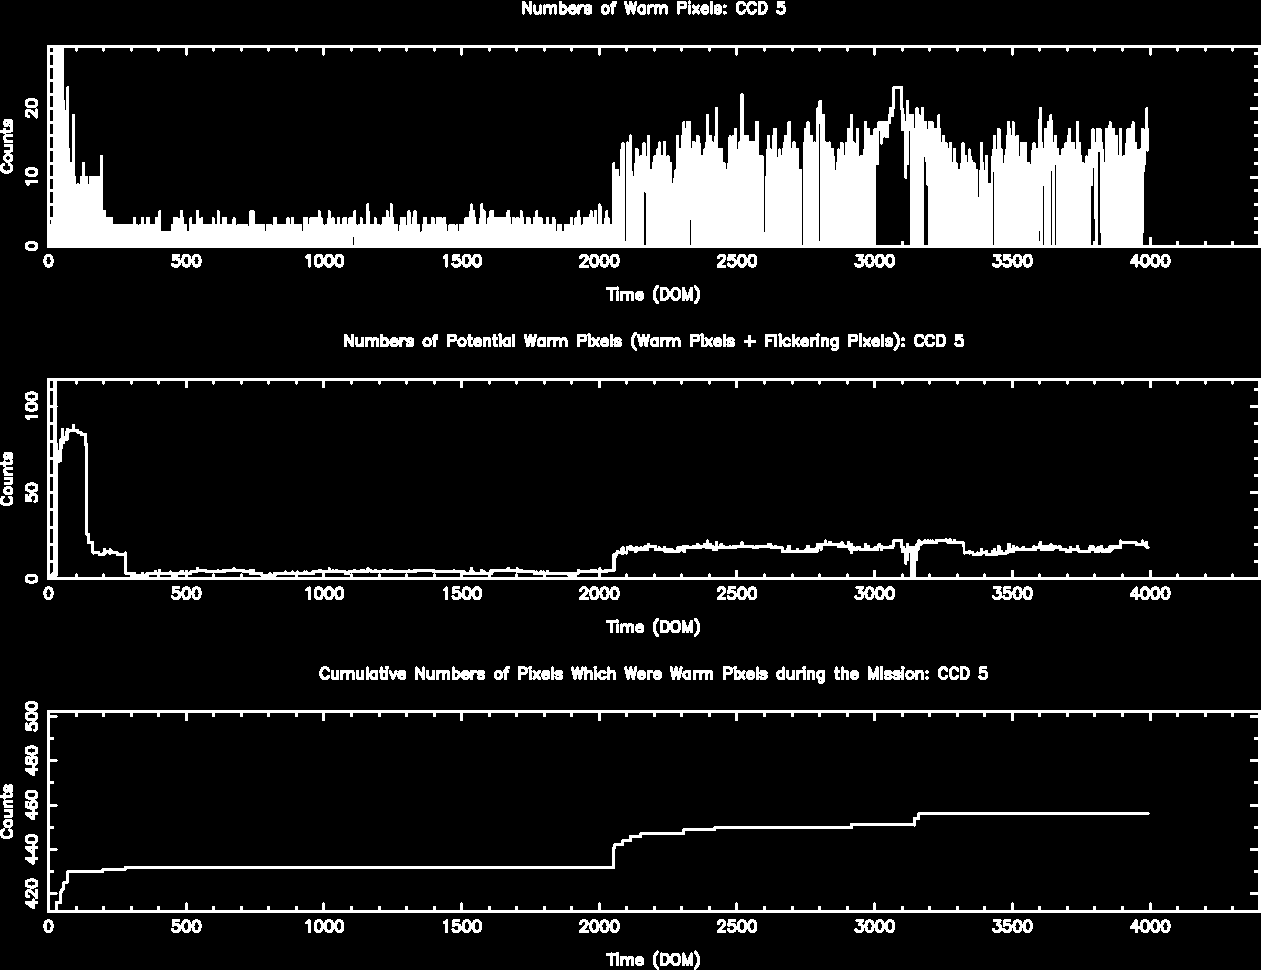
Bad Pixels
The plots below were generated with a new warm pixel finding script. Please see Acis Bad Pixel Page for details.
Front Side CCDs
Back Side CCD (CCD5)
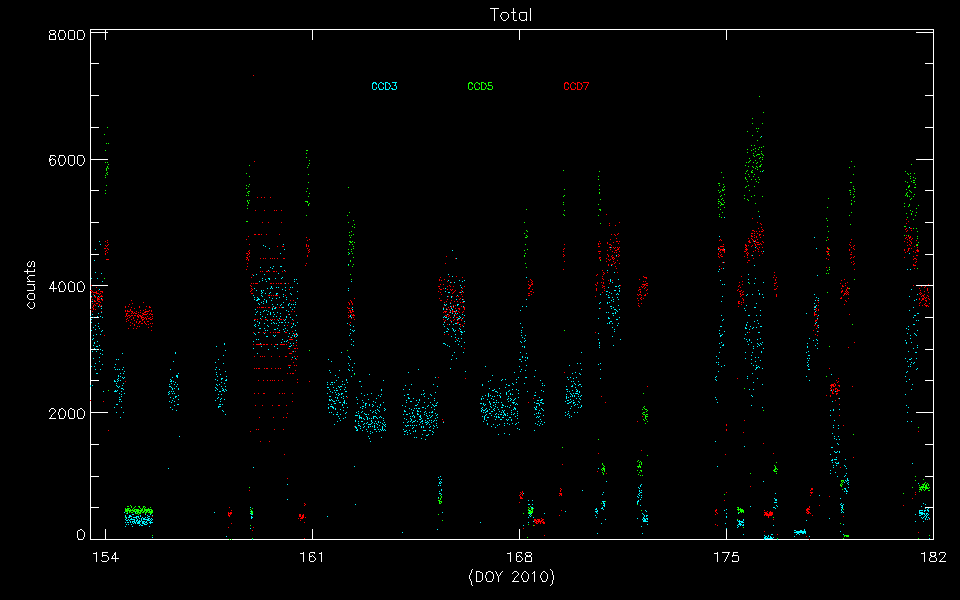
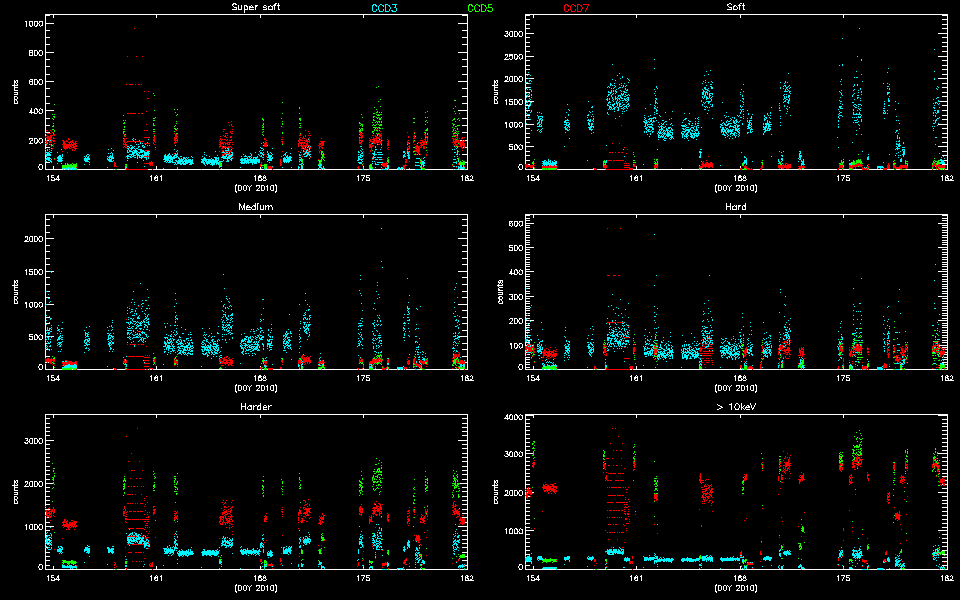
Science Instrument Background Rates
| Name | Low (keV) | High(KeV) | Description |
|---|---|---|---|
| SSoft | 0.00 | 0.50 | Super soft photons |
| Soft | 0.50 | 1.00 | Soft photons |
| Med | 1.00 | 3.00 | Moderate energy photons |
| Hard | 3.00 | 5.00 | Hard Photons |
| Harder | 5.00 | 10.00 | Very Hard photons |
| Hardest | 10.00 | Beyond 10 keV |
HRC
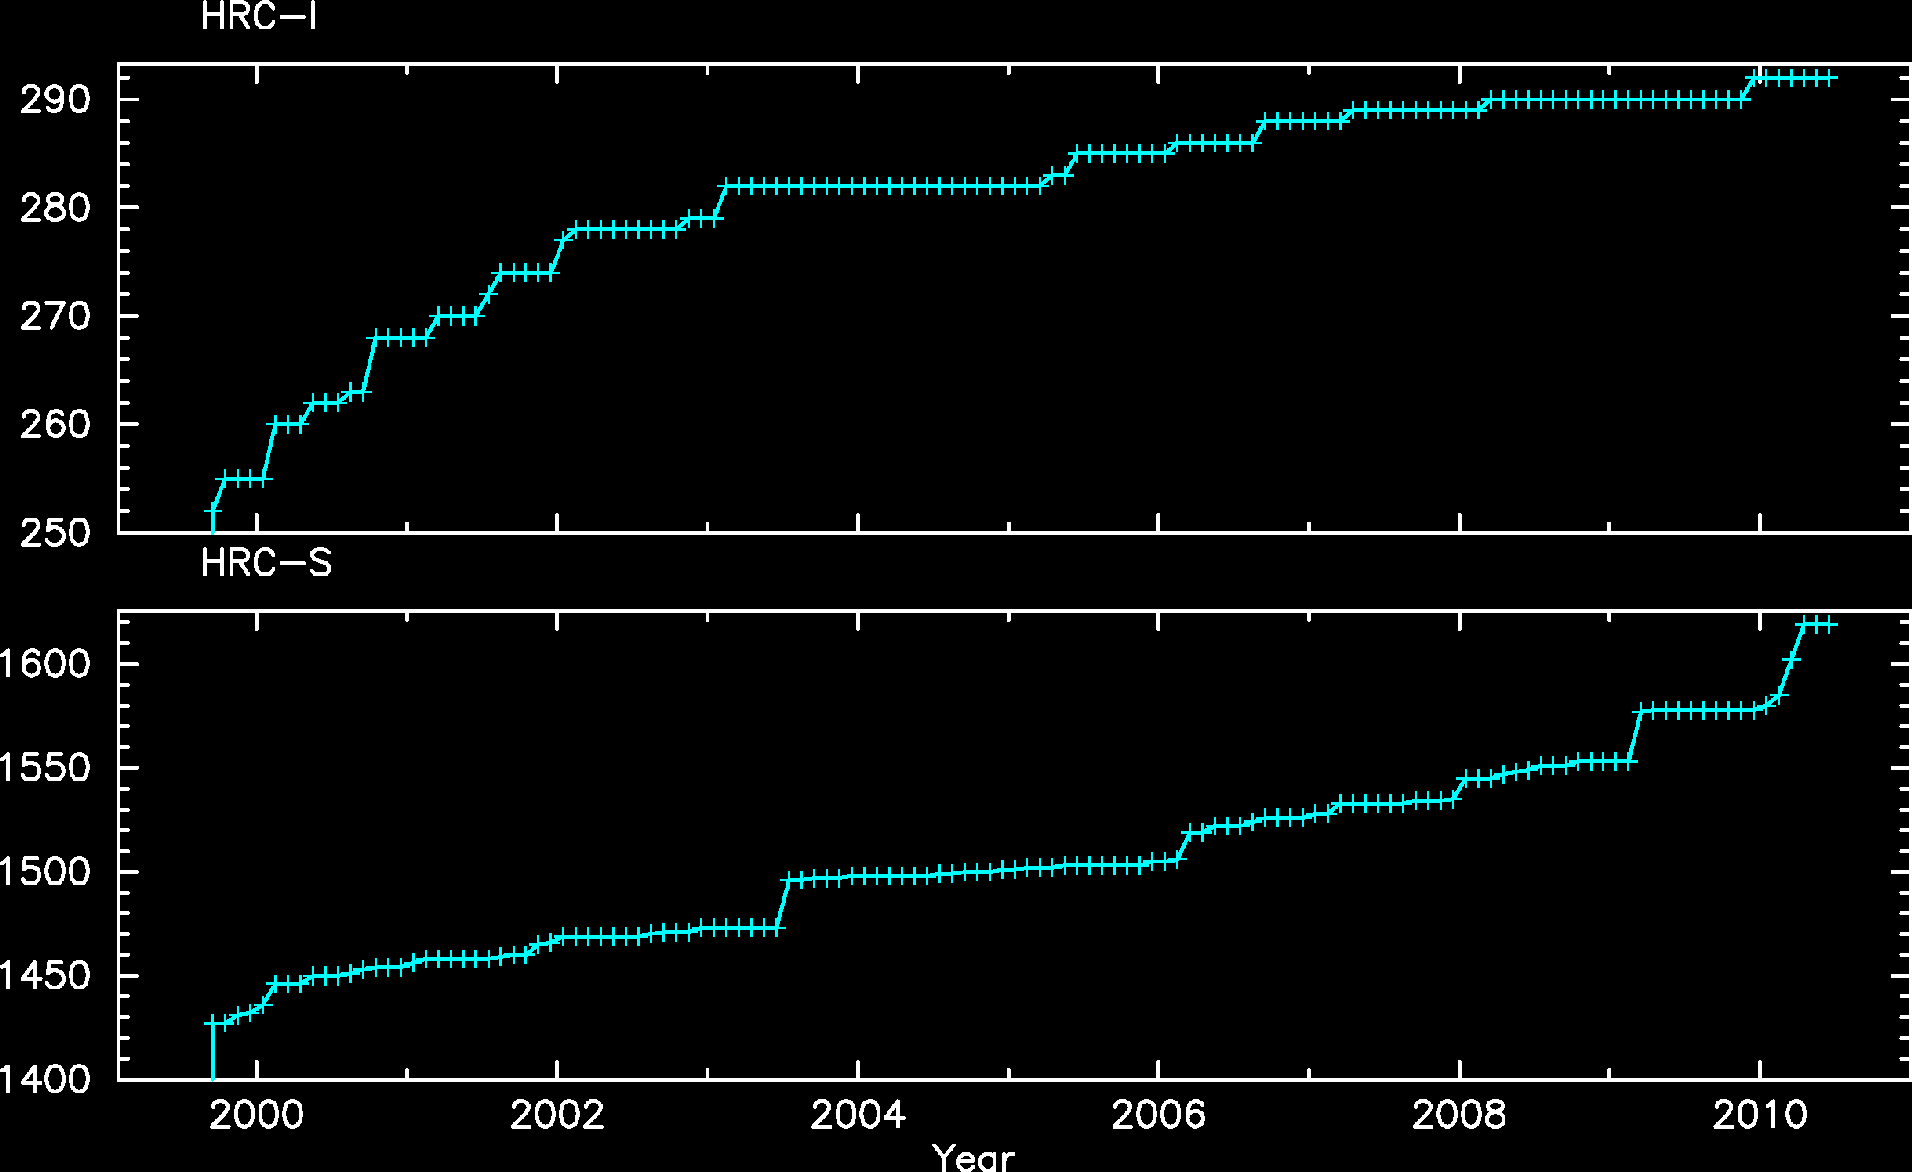
DOSE of Central 4K Pore-Pairs
Please refer to Maximum Dose Trends for more details.
)
        IMAGE                NPIX      MEAN    STDDEV      MIN       MAX
HRCI_08_1999_04_2010.fits  16777216   3.238    4.084       0.0       292.0
)
        IMAGE                NPIX      MEAN    STDDEV      MIN       MAX
HRCS_06_2010.fits          16777216   0.018    0.135       0.0       4.0
)
        IMAGE                NPIX     MEAN      STDDEV      MIN      MAX
HRCS_08_1999_06_2010.fits  16777216  13.070      21.973      0.0      1619.0
|
|
Max dose trend plots corrected for events that "pile-up"
in the center of the taps due to bad position information.
|
)
|
)
|
)
|
)
|
| Mar 2010 | Dec 2009 | Sep 2009 | Jun 2009 |
|---|
)
|
)
|
)
|
)
|
| Mar 2010 | Dec 2009 | Sep 2009 | Jun 2009 |
|---|
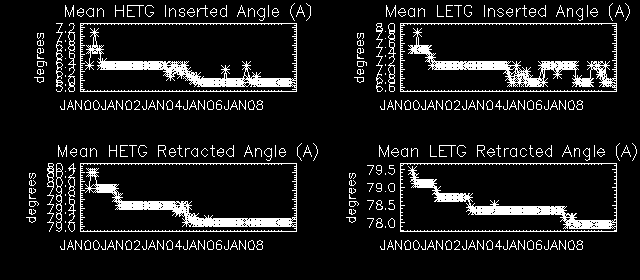
Gratings
Focus
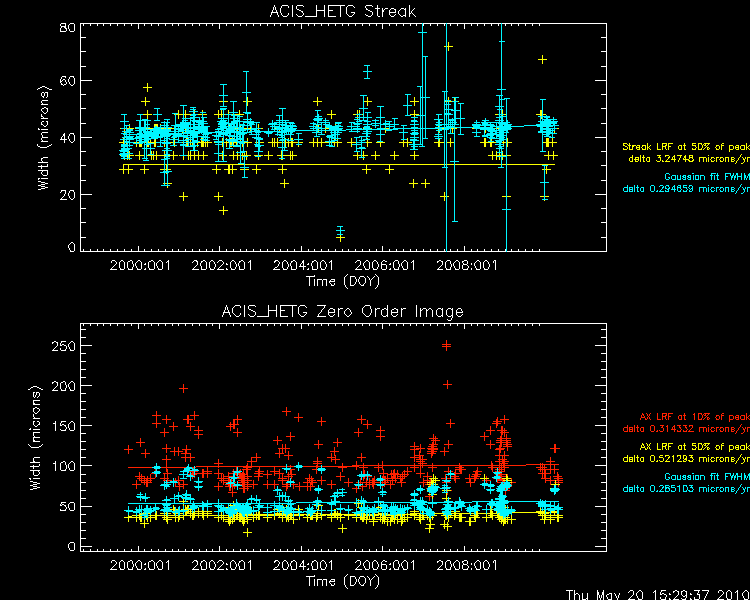
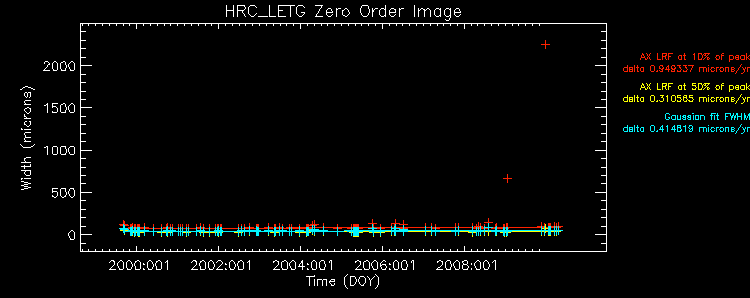
We plot the width of the zero order streak of ACIS/HETG observations and the width of the zero order image for HRC/LETG observations of point sources. No significant defocusing trend is seen at this time. See Gratings Focus pages. (NOTE: the figures are not updated from Mar 2009 due to a system problem.)
PCAD
ACA Trending
Fid Light Drift
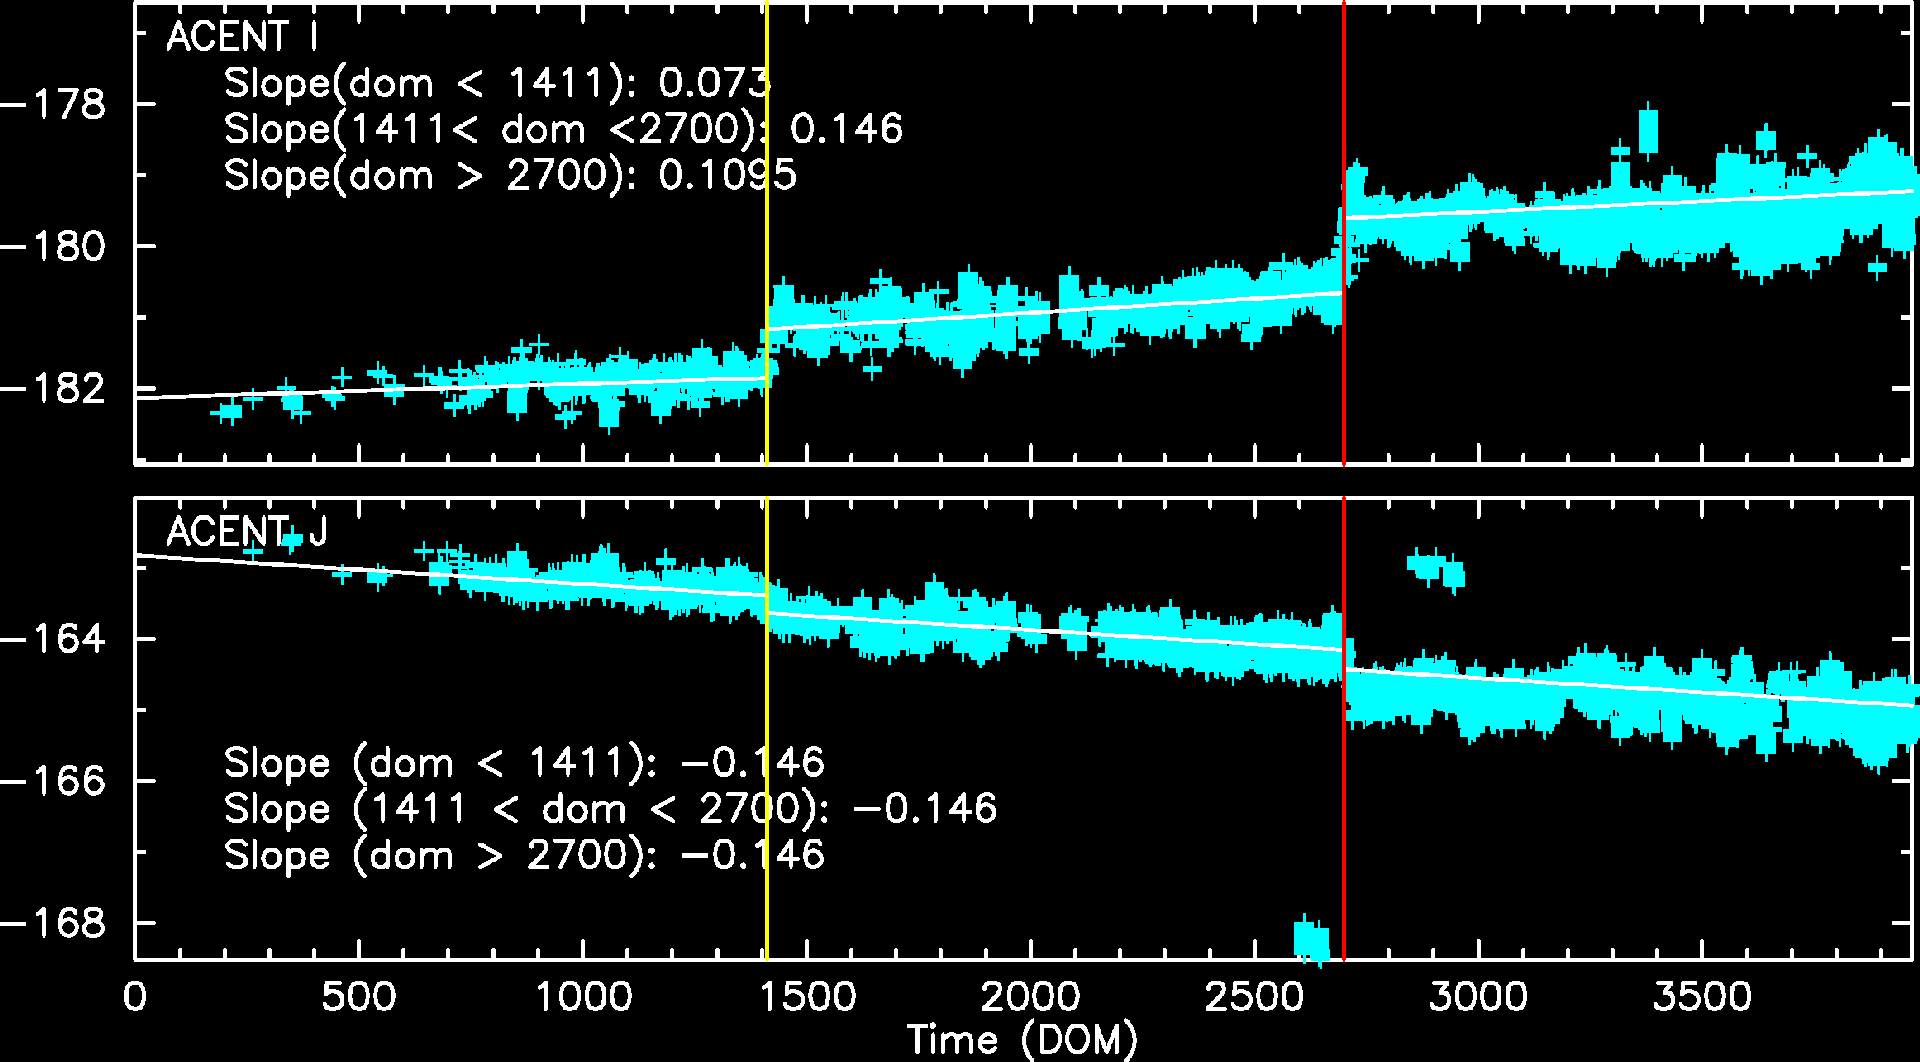
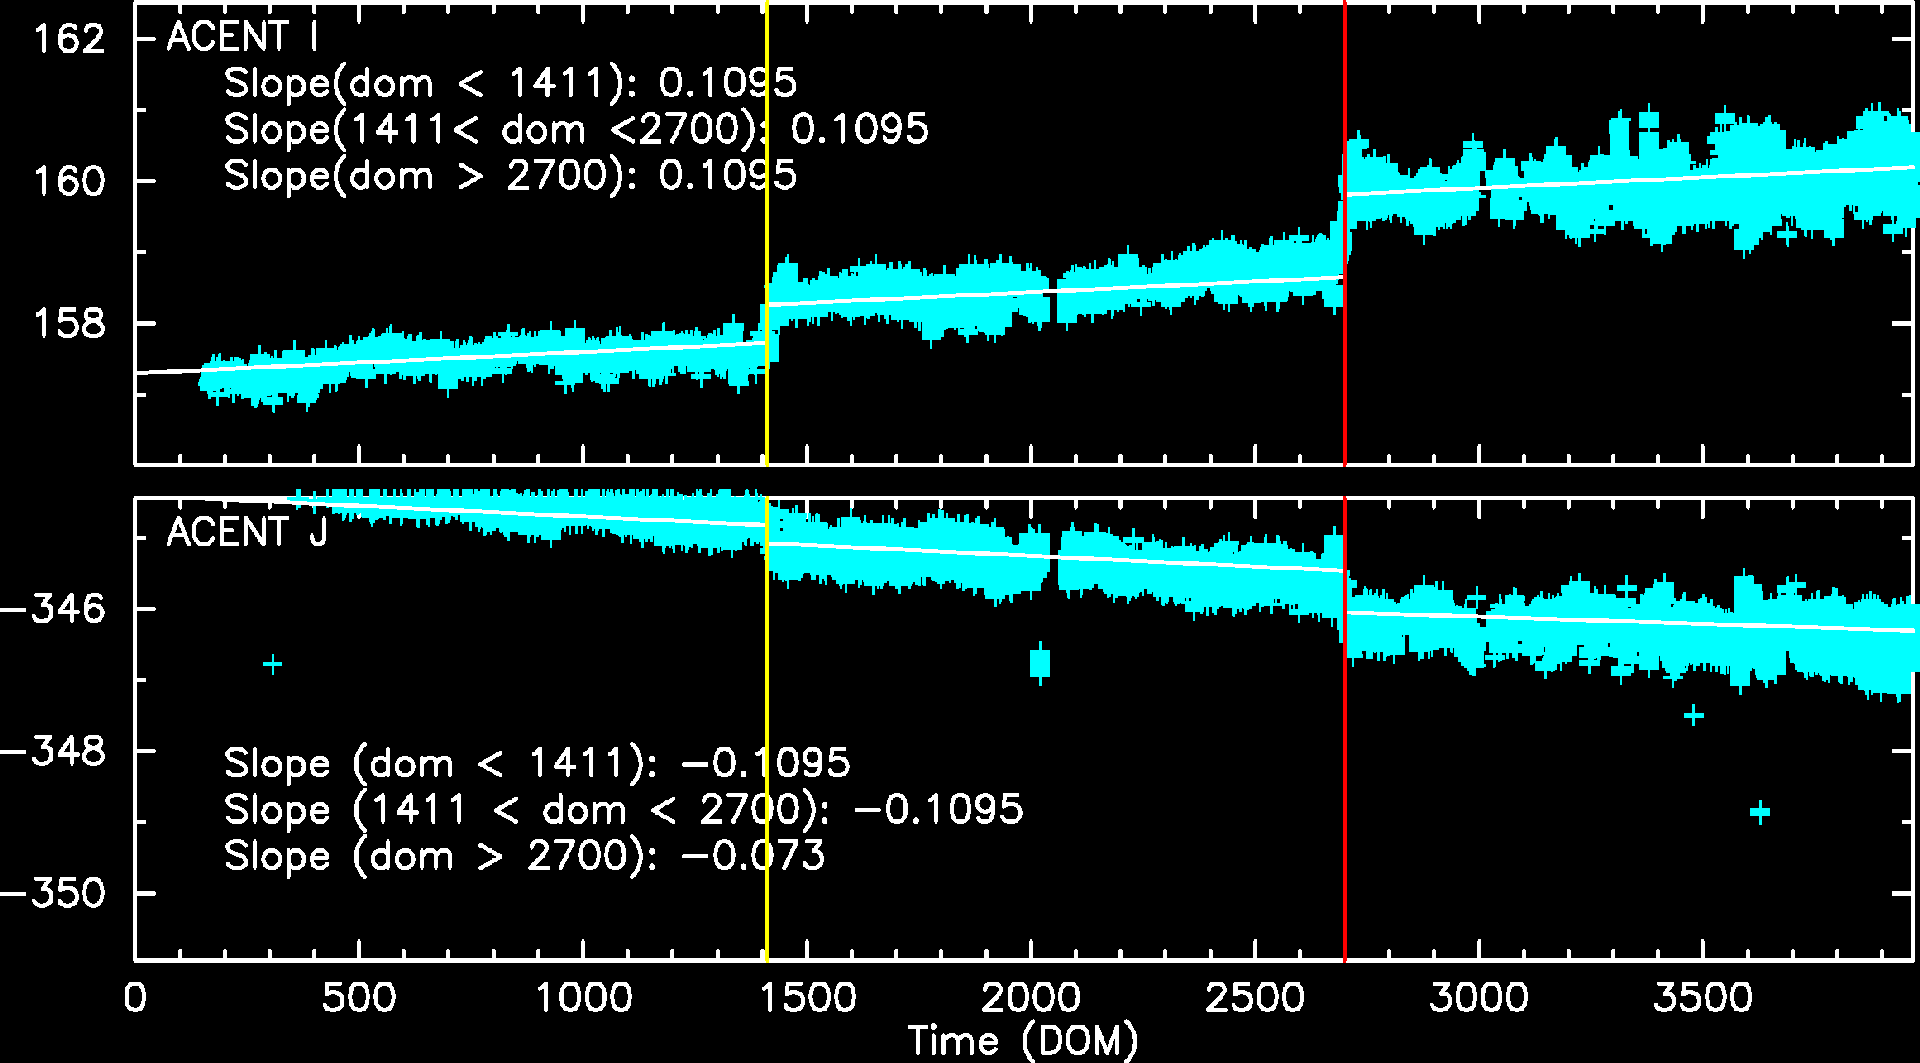
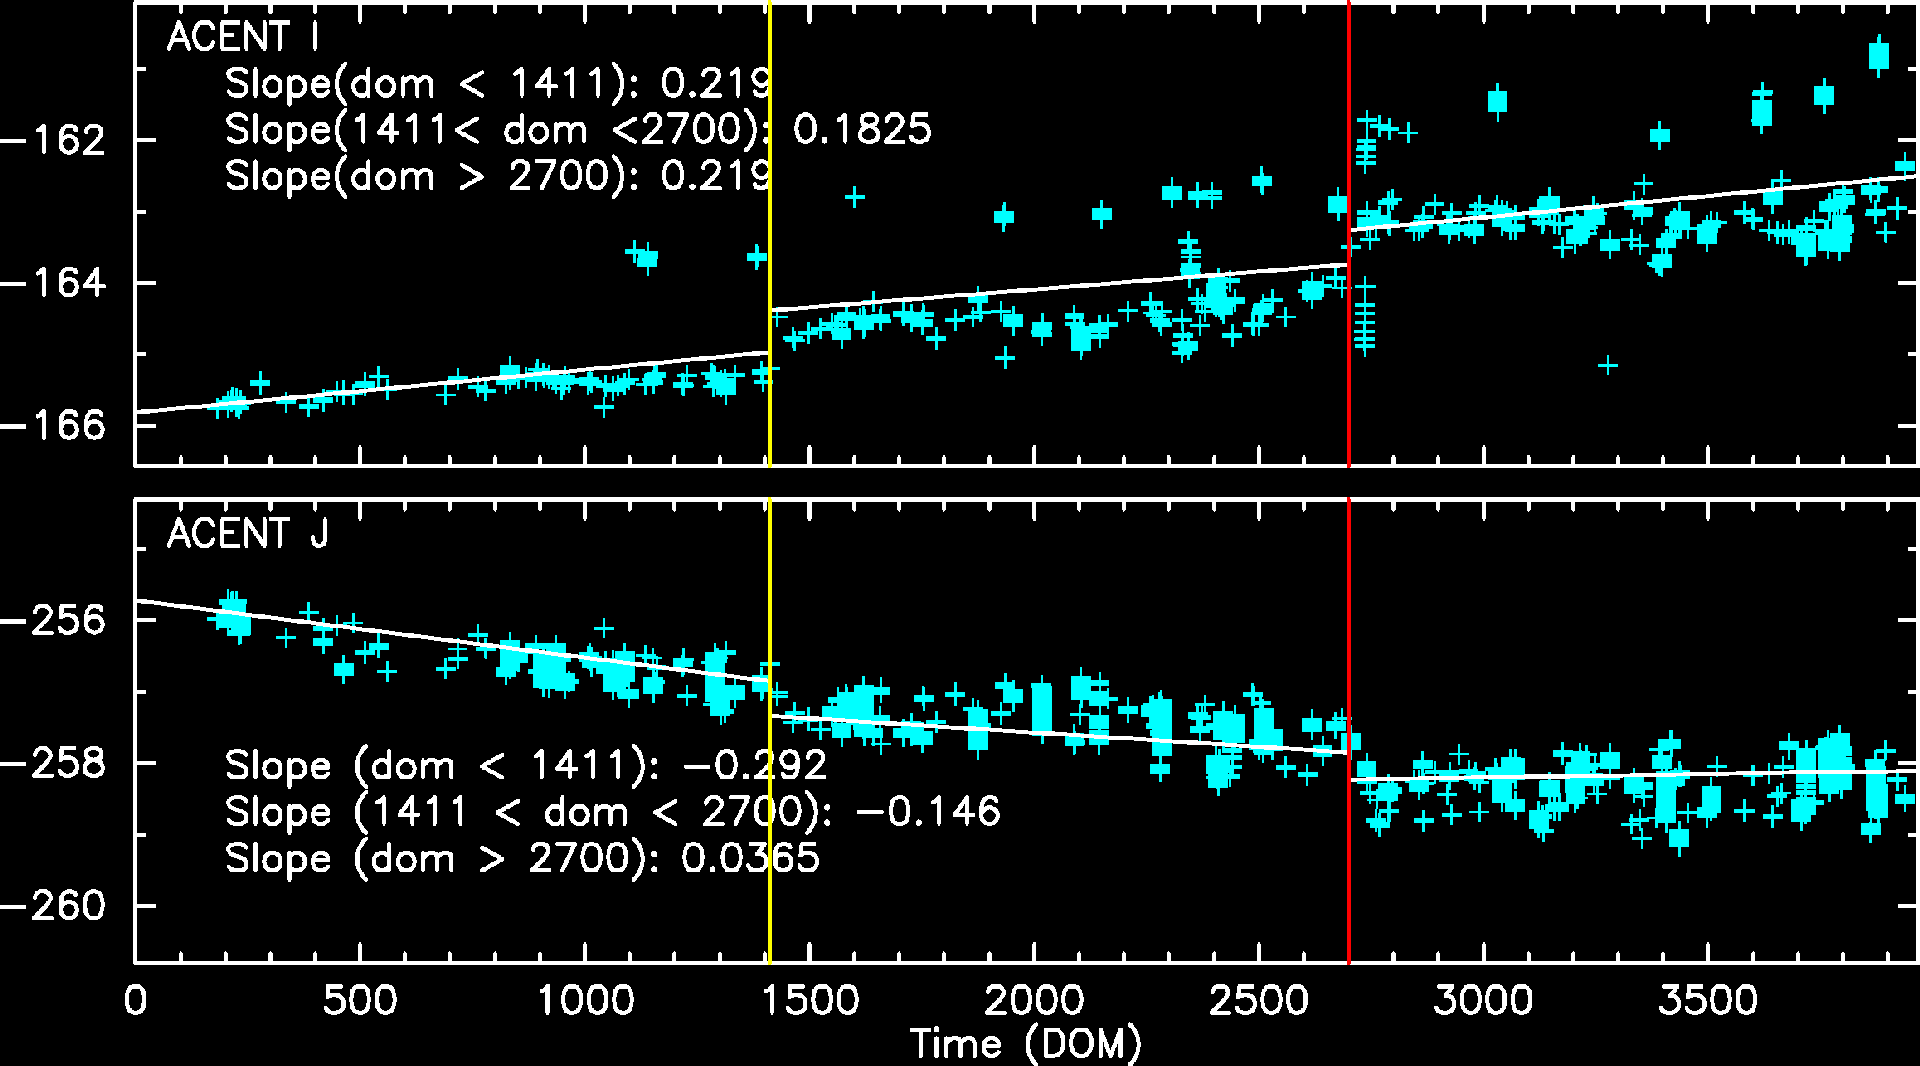
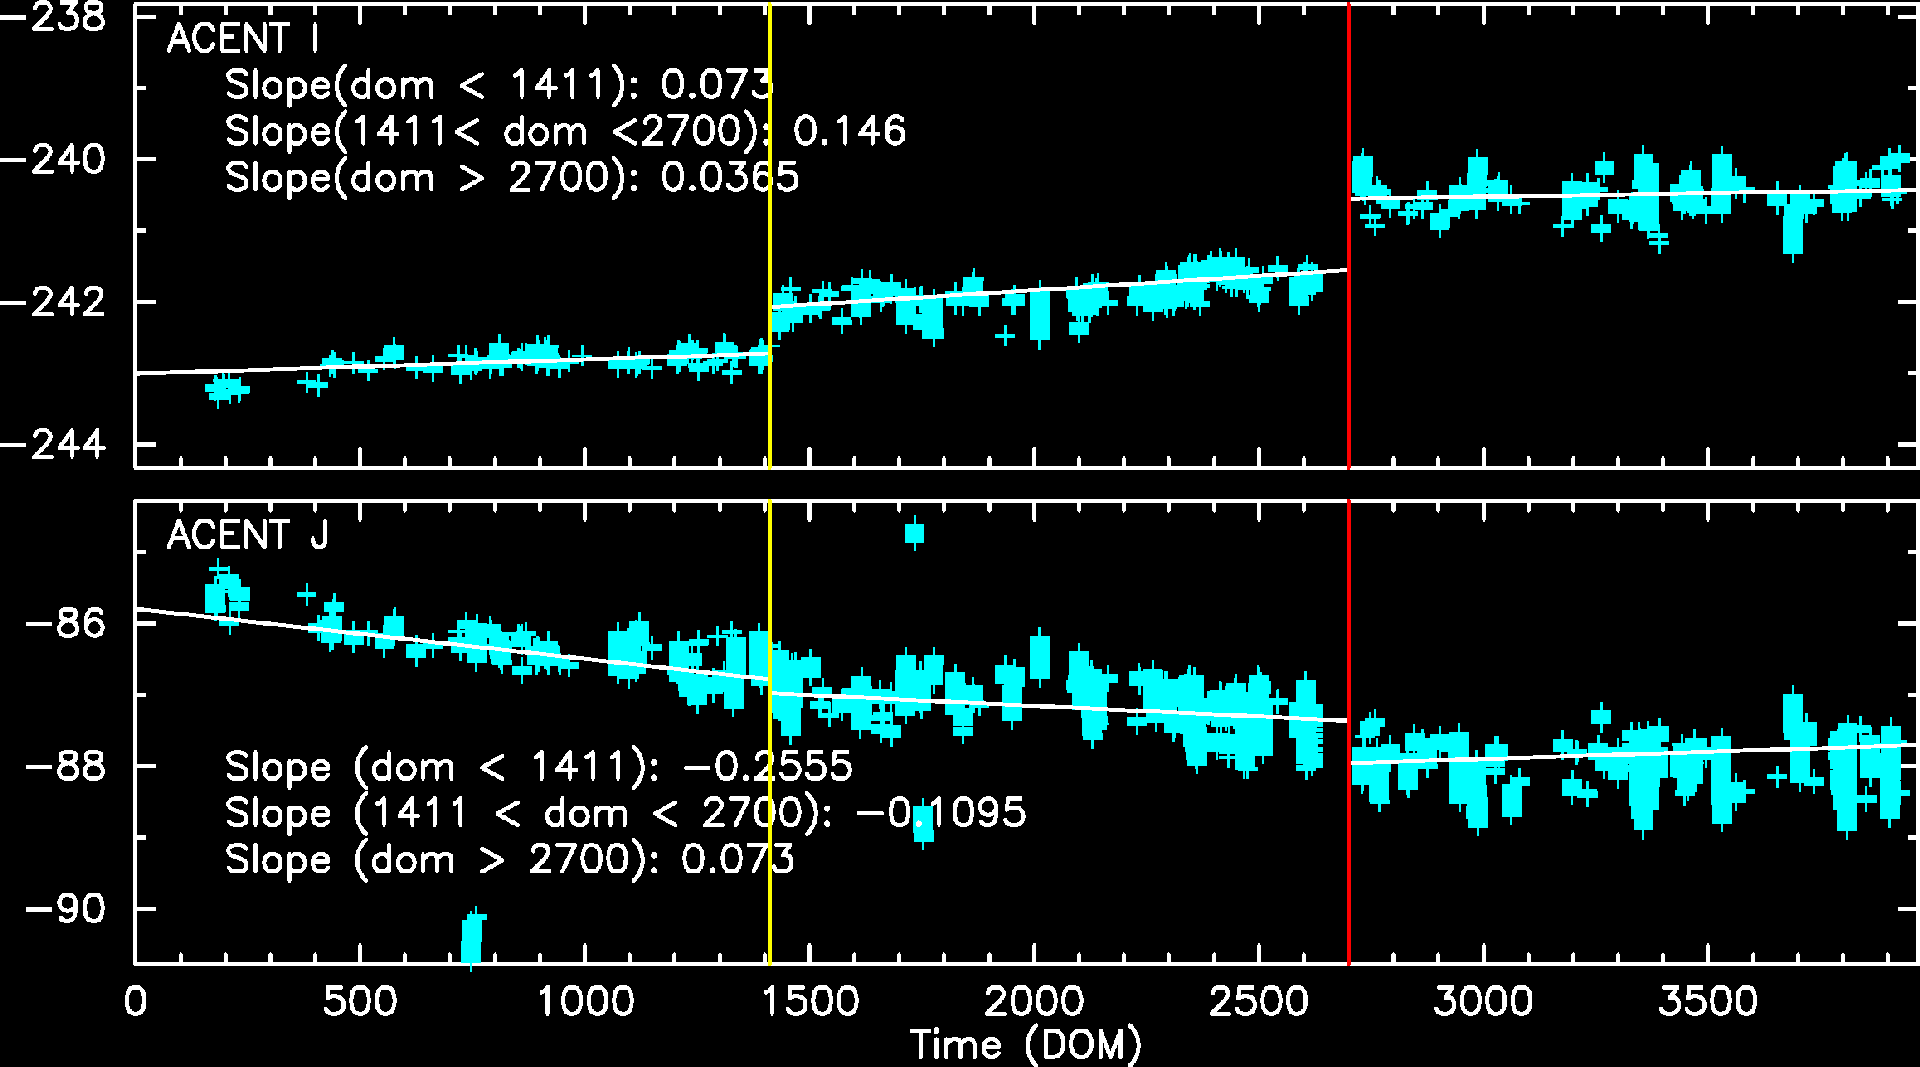
Fid light positions on ACA drift with time. The drift trends of Fid light 2 with ACIS-I and ACIS-S configurations are shown below.
The top panel shows Fid light 2 drift in ACENT I (app. along with -Y axis), and the
bottom panel shows that in ACENT J (app. along with Z axis). The unit is a pixel, and
one pixel is approximately 0.5 arcsec. The slope listed at the top right corner is
the change in a position per year (arcsec/yr). The vertical line on DOM = 1411 (Jun 1, 2003)
indicates a transition date of use of IRU-1 to IRU-2.
See also Tom Aldcroft's updated page:
https://cxc.cfa.harvard.edu/mta/ASPECT/fid_drift
Fid 2 (ACIS-I)
Fid 2 (ACIS-S)
Fid 8 (HRC-I)
Fid 12 (HRC-S)
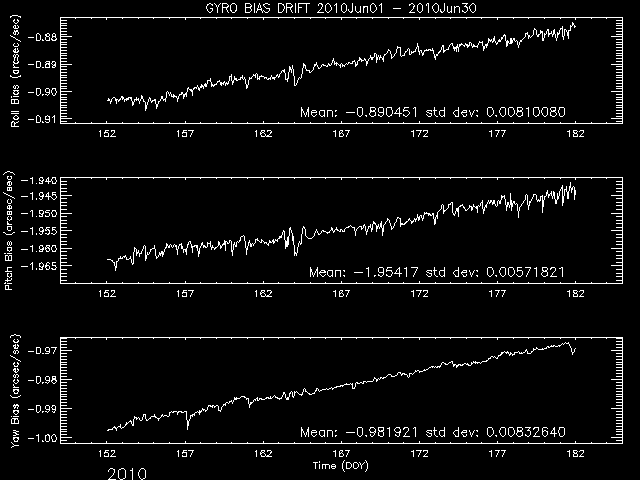
Gyro Bias Drift
Radiation History
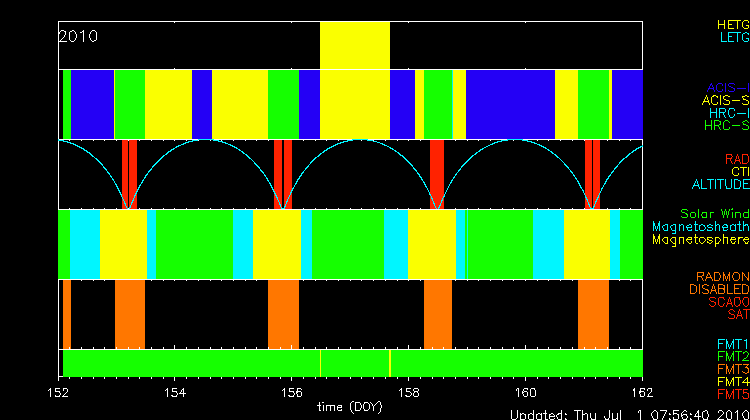
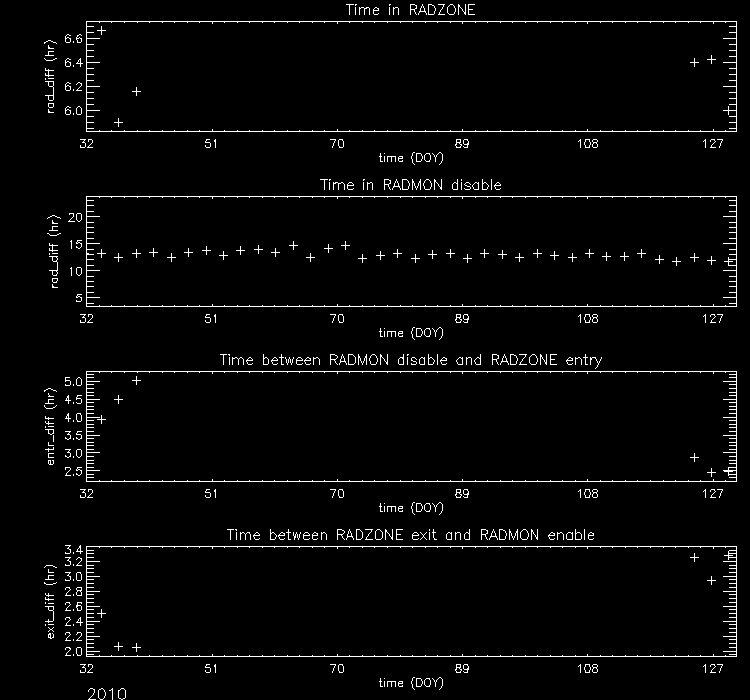
Radiation Zone Timing
Plotted below are radiation zone timing plots based on the following definitions of radiation zone:
- RADZONE - Ephin levels (in any of the E1300,P4GM,P41GM channels) are more than 1/3 of RADMON safing thresholds.
- RADMON - Radmon is disabled for radiation zone (as commanded based on OFLS model, for comparison with actual radiation levels).
- PERIGEE - Time of closest earth approach (for comparison)
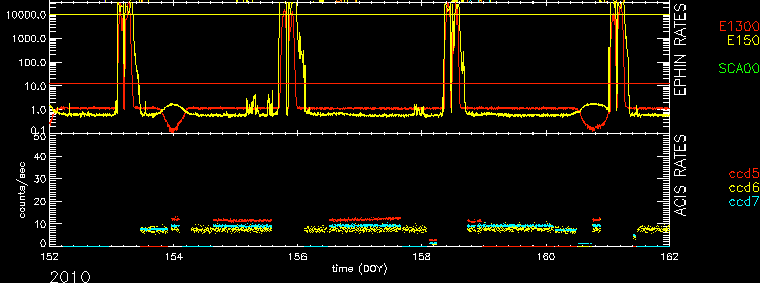
Radiation Count Rates of Jun 2010
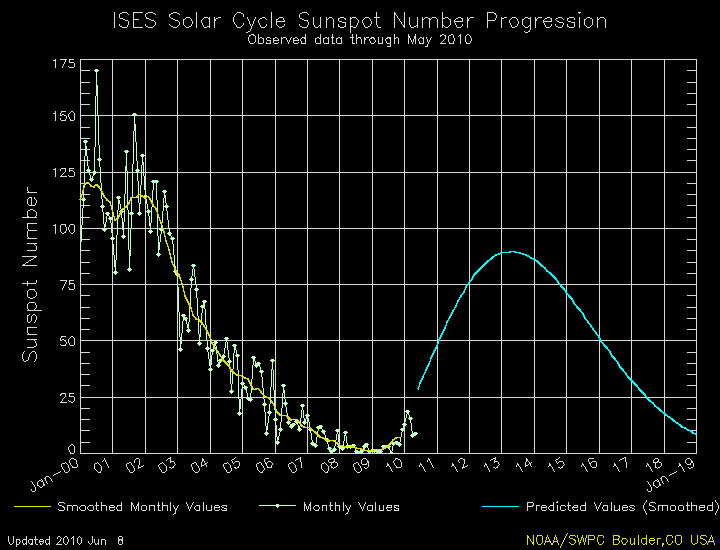
Sun Spot History
Trending
Critical Trends
| ACIS Temperatures - Daily Maximums | ||||||
|---|---|---|---|---|---|---|
| MSID | MEAN | RMS | DELTA/YR | DELTA/YR/YR | UNITS | DESCRIPTION |
| 1PDEAAT | 307.57 | 8.20 | -6.421e-01 | 2.310e+00 | K | PSMC DEA PS A TEMP |
| 1PIN1AT | 293.59 | 7.31 | -4.351e-01 | 2.204e+00 | K | PSMC TEMP 1A |
| HRMA Computed Averages - Daily Maximums | ||||||
| OBAAVG | 284.65 | 0.87 | 2.755e-01 | 3.119e-02 | K | OBA/TFTE TEMP |
| EPHIN Temperatures - Daily Maximums | ||||||
| TEIO | 312.62 | 17.74 | 2.137e+00 | 1.692e+00 | K | EPHIN ELECTRONICS HOUSING TEMP |
| TEPHIN | 309.55 | 7.80 | 2.736e+00 | -3.373e-01 | K | EPHIN SENSOR HOUSING TEMP |
| SIM EQ Temperatures - Daily Maximums | ||||||
| 3TRMTRAT | 3.23 | 10.29 | -1.288e+00 | -7.485e+00 | TEMP | SEA A TRANSLATION DRIVE MOTOR |
| S/C Main Temperatures - Daily Maximums | ||||||
| TCYLFMZM | 296.76 | 23.14 | 8.226e-01 | -5.623e-01 | K | CNT CYL TEMP:-Z SIDE UNDER LAE-1 |
| TCYLFMZP | 299.40 | 22.01 | 7.512e-01 | -4.657e-01 | K | CNT CYL TEMP:-Z SIDE UNDER LAE-2 |
| S/C Ancillary Temperatures - Daily Maximums | ||||||
| TFSSBKT1 | 326.90 | 19.37 | 1.328e+00 | -7.511e-01 | K | FSS BRACKET-1 TEMP (+Y) |
| TFSSBKT2 | 322.83 | 23.81 | 8.587e-01 | -1.107e+00 | K | FSS BRACKET-2 TEMP (+Y) |
| TSCTSF1 | 289.63 | 3.80 | 9.379e-01 | 2.165e-01 | K | SC-TS FITTING -1 TEMP |
| TSCTSF6 | 289.33 | 4.27 | 1.079e+00 | 3.237e-01 | K | SC-TS FITTING -6 TEMP |
| MUPS - Daily Maximums | ||||||
| PM1THV1T | 330.71 | 9.47 | 1.563e+00 | -1.452e+00 | K | MUPS 1 THRUSTER VALVE 01 TEMP |
| PLINE02T | 308.68 | 10.42 | 1.667e+00 | -1.385e-01 | K | PROP LINE TEMP 02 |
| PLINE03T | 310.04 | 10.80 | 1.129e+00 | -7.137e-02 | K | PROP LINE TEMP 03 |
| PLINE04T | 297.95 | 9.77 | 9.489e-02 | 9.714e-02 | K | PROP LINE TEMP 04 |
)
)
)
)
)
)
)
)
)
)
)
)
)
)
)
)
Quarterly Trends
- EPHIN Thermal and Electronics
| Previous Quarter | ||||||
| MSID | MEAN | RMS | DELTA/YR | DELTA/YR/YR | UNITS | DESCRIPTION |
| 5EIOT | 343.19 | 16.59 | 2.530e+01 | 3.639e+02 | K | EIO TEMP |
| 5EPHINT | 315.99 | 4.39 | -4.943e+00 | 1.113e+02 | K | EPHIN TEMP |
| HKEBOXTEMP | 320.66 | 4.45 | -3.831e+00 | 1.045e+02 | K | EPHIN HOUSEKEEPING EBOX: TEMPERATURE (5EHSE300) |
| HKP27I | 7.21 | 7.672e-02 | 1.545e-01 | 2.665e+00 | AMP | HK 27 Volts Rail - Current |
| HKP27V | 26.79 | 4.370e-04 | -1.301e-04 | 0.000e+00 | V | HK 27 Volts Rail - Voltage |
| TEIO | 316.36 | 18.98 | 2.785e+01 | 4.153e+02 | K | EPHIN ELECTRONICS HOUSING TEMP |
| TEPHIN | 316.15 | 4.53 | -2.749e+00 | 7.309e+01 | K | EPHIN SENSOR HOUSING TEMP |
)
)
)
)
)
)
)
- PCAD Thermal
| Previous Quarter | ||||||
| MSID | MEAN | RMS | DELTA/YR | DELTA/YR/YR | UNITS | DESCRIPTION |
| AACCCDRT | 296.11 | 0.66 | 6.909e-01 | 4.849e+01 | K | AC CCD TEMP (RDNT) |
| AAOTAPMT | 292.21 | 0.59 | 7.137e-01 | 4.250e+01 | K | AC OPT TEL ASSY PRIMARY MIRROR TEMP |
| AAOTASMT | 292.33 | 0.60 | 6.531e-01 | 4.172e+01 | K | AC OPT TEL ASSY SECONDARY MIRROR TEMP |
| AAOTH2MT | 292.78 | 0.62 | 6.790e-01 | 4.676e+01 | K | AC OPT TEL ASSY SECONDARY MIRROR TEMP (HRMA) |
)
)
)
)
- MUPS
| Previous Quarter | ||||||
| MSID | MEAN | RMS | DELTA/YR | DELTA/YR/YR | UNITS | DESCRIPTION |
| PMTANKP | 239.35 | 26.28 | -2.832e+02 | -5.373e+03 | PSIA | MUPS TANK PRESSURE |
| PLINE02T | 315.02 | 9.89 | 1.682e+01 | 5.763e+02 | K | PROP LINE TEMP 02 |
| PLINE03T | 314.57 | 12.60 | 2.560e+01 | 7.377e+02 | K | PROP LINE TEMP 03 |
| PLINE04T | 300.05 | 11.04 | 2.428e+01 | 6.796e+02 | K | PROP LINE TEMP 04 |
)
)
)
)
Spacecraft Motions
|
|
Reaction Wheel Rotations
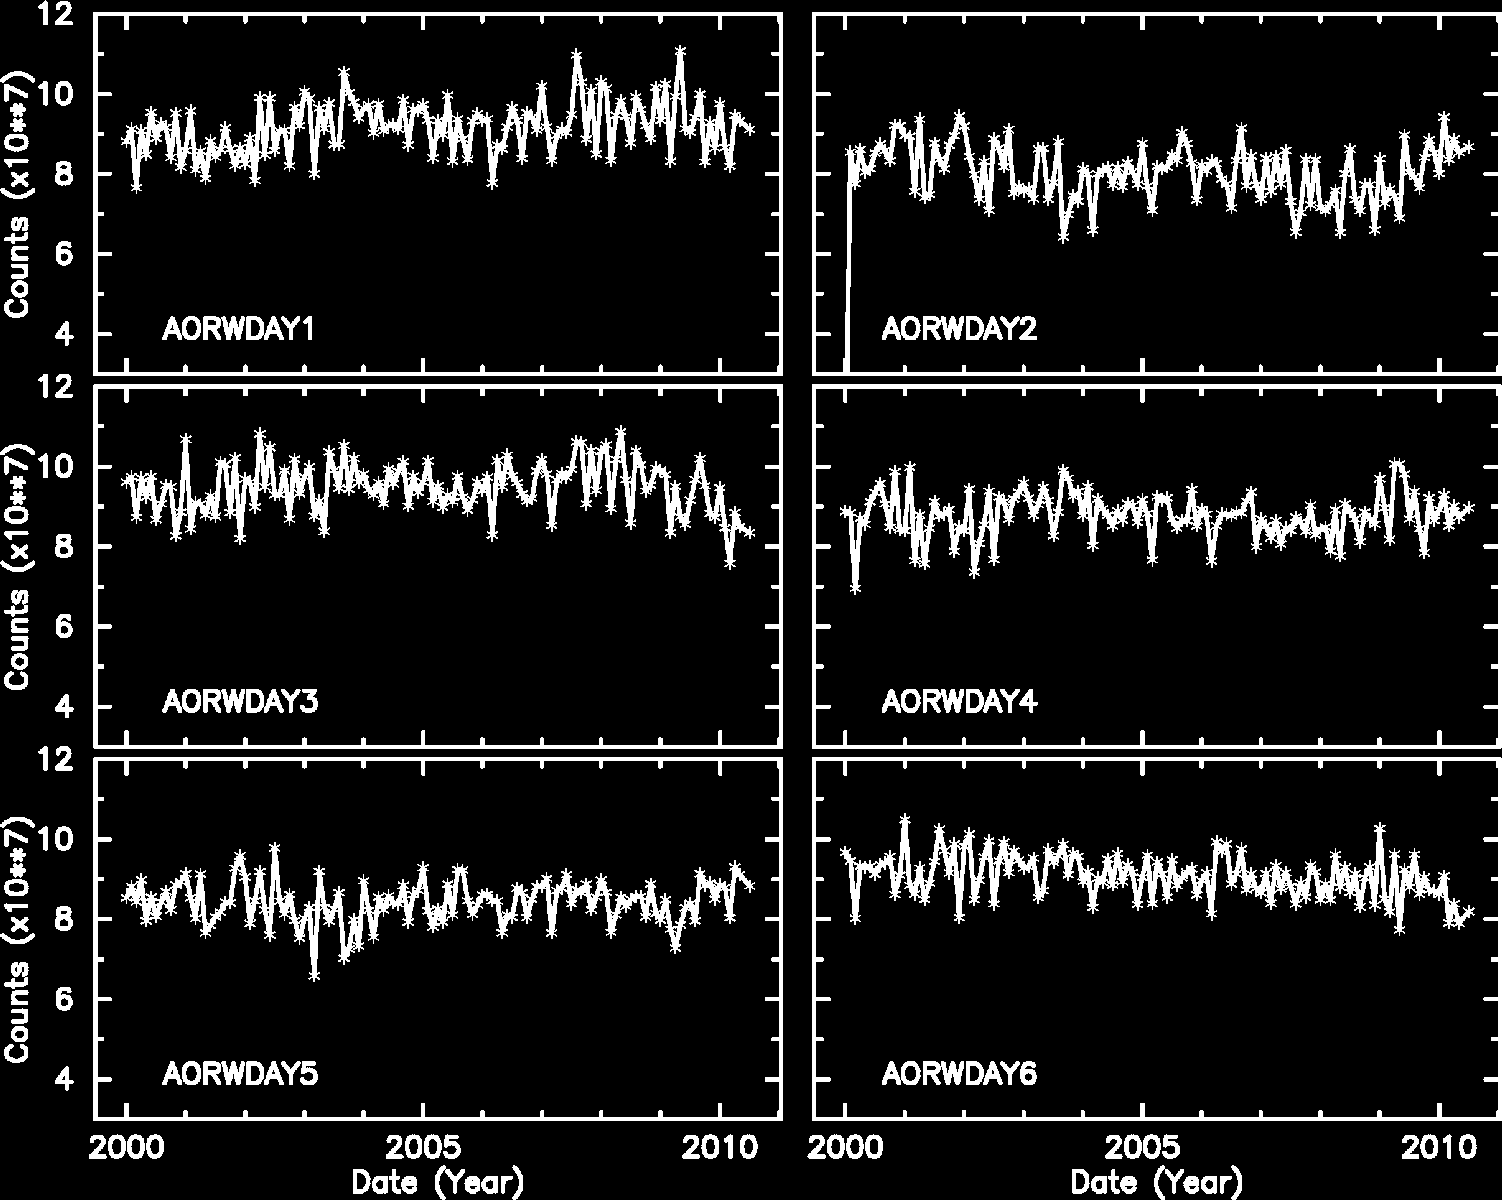
Note: From Feb 2010, the computation of reaction wheel rotations are slightly modified.
Links to Past Monthly Reports
| Year | Month | |||||||||||
|---|---|---|---|---|---|---|---|---|---|---|---|---|
| 1999 | Jul | Aug | Sep | Oct | Nov | Dec | ||||||
| 2000 | Jan | Feb | Mar | Apr | May | Jun | Jul | Aug | Sep | Oct | Nov | Dec |
| 2001 | Jan | Feb | Mar | Apr | May | Jun | Jul | Aug | Sep | Oct | Nov | Dec |
| 2002 | Jan | Feb | Mar | Apr | May | Jun | Jul | Aug | Sep | Oct | Nov | Dec |
| 2003 | Jan | Feb | Mar | Apr | May | Jun | Jul | Aug | Sep | Oct | Nov | Dec |
| 2004 | Jan | Feb | Mar | Apr | May | Jun | Jul | Aug | Sep | Oct | Nov | Dec |
| 2005 | Jan | Feb | Mar | Apr | May | Jun | Jul | Aug | Sep | Oct | Nov | Dec |
| 2006 | Jan | Feb | Mar | Apr | May | Jun | Jul | Aug | Sep | Oct | Nov | Dec |
| 2007 | Jan | Feb | Mar | Apr | May | Jun | Jul | Aug | Sep | Oct | Nov | Dec |
| 2008 | Jan | Feb | Mar | Apr | May | Jun | Jul | Aug | Sep | Oct | Nov | Dec |
| 2009 | Jan | Feb | Mar | Apr | May | Jun | Jul | Aug | Sep | Oct | Nov | Dec |
| 2010 | Jan | Feb | Mar | Apr | May | |||||||