Plot of CTI correction factor against Time of CCD 7
This short memo investigates whether temperature-CTI correction factor evolves with time.
Data were gathered in the following way;
The Mn K alpha data between Feb 2000 and Feb 2004 were obtained, The data were divided into 4 month period chunk (total 11 periods). Each period contains about 100 data points.
We excluded the data colder than -119.6 C. This is because there are far too many data points clustered in that range, and skewed fitting significantly. This step reduced the number of data to 2/3; for the first two periods, the number of the data were down to 1/4. This is because most calibration observations were done at or colder then -199.6 C during these two periods.
There are also many out-layers due to short integration time, and other problems.
We dropped these data by following steps.
First, a mean and a standard deviation for CTI are
computed, then the data points outside of two sigma away from the mean were
dropped.
Second, a linear fit was made for the remaining data. Drop any data points outside
of two sigma from the fitting line. Then the final fitting was done.
An example fit are shown below (DOM around 1107, CCD6 in 10**4).
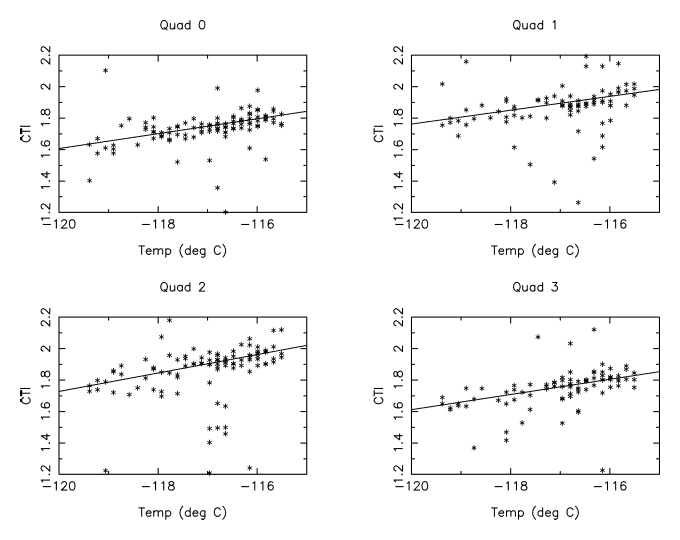 All other plots
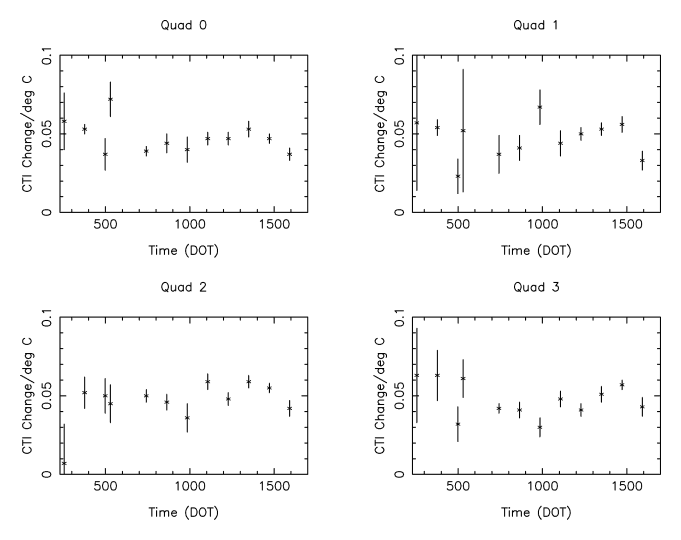
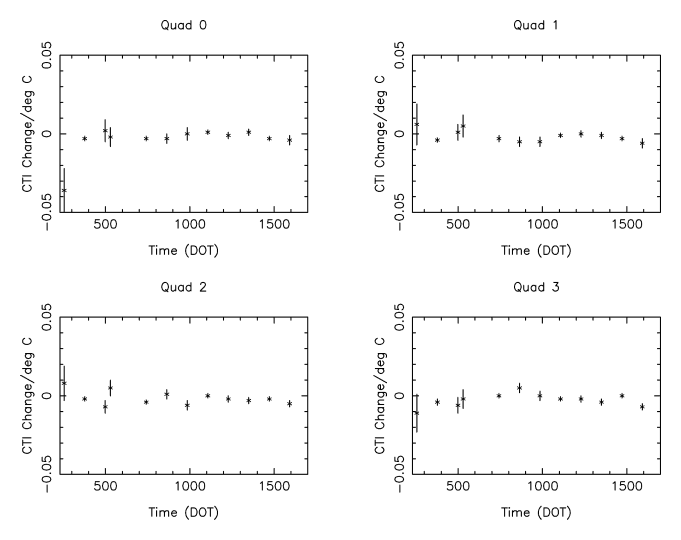
The fitting results for CCD6 and CCD7 were shown in the tables and figures. The date are in DOM, and the correction factors are in 10**4 CTI/degree C.
 mn_ccd6
Date             Quad 0                 Quad 1                  Quad 2                  Quad 3
255      0.058 +/- 0.018         0.057 +/- 0.043         0.007 +/- 0.025         0.063 +/- 0.030
377      0.053 +/- 0.003         0.054 +/- 0.005         0.052 +/- 0.010         0.063 +/- 0.016
499      0.037 +/- 0.010         0.023 +/- 0.011         0.050 +/- 0.011         0.032 +/- 0.011
530      0.072 +/- 0.011         0.052 +/- 0.039         0.045 +/- 0.012         0.061 +/- 0.012
742      0.039 +/- 0.003         0.037 +/- 0.012         0.050 +/- 0.004         0.042 +/- 0.003
864      0.044 +/- 0.006         0.041 +/- 0.008         0.046 +/- 0.005         0.041 +/- 0.005
985      0.040 +/- 0.008         0.067 +/- 0.011         0.036 +/- 0.009         0.030 +/- 0.006
1107     0.047 +/- 0.004         0.044 +/- 0.008         0.059 +/- 0.005         0.048 +/- 0.005
1229     0.047 +/- 0.004         0.050 +/- 0.004         0.048 +/- 0.004         0.041 +/- 0.004
1350     0.053 +/- 0.005         0.053 +/- 0.004         0.059 +/- 0.004         0.051 +/- 0.005
1472     0.047 +/- 0.003         0.056 +/- 0.005         0.055 +/- 0.003         0.057 +/- 0.003
1592     0.037 +/- 0.004         0.033 +/- 0.006         0.042 +/- 0.005         0.043 +/- 0.006

 mn_ccd7
Date             Quad 0                 Quad 1                  Quad 2                  Quad 3
255      -0.036 +/- 0.014         0.006 +/- 0.013         0.008 +/- 0.011        -0.011 +/- 0.012
377      -0.003 +/- 0.001        -0.004 +/- 0.001        -0.002 +/- 0.001        -0.004 +/- 0.002
499       0.002 +/- 0.007         0.001 +/- 0.005        -0.007 +/- 0.004        -0.006 +/- 0.005
530      -0.002 +/- 0.006         0.005 +/- 0.007         0.005 +/- 0.005        -0.002 +/- 0.006
742      -0.003 +/- 0.001        -0.003 +/- 0.002        -0.004 +/- 0.001        -0.000 +/- 0.001
864      -0.003 +/- 0.003        -0.005 +/- 0.003         0.001 +/- 0.003         0.005 +/- 0.003
985      -0.000 +/- 0.004        -0.005 +/- 0.003        -0.006 +/- 0.003         0.000 +/- 0.003
1107      0.001 +/- 0.001        -0.001 +/- 0.001        -0.000 +/- 0.001        -0.002 +/- 0.001
1229     -0.001 +/- 0.002        -0.000 +/- 0.002        -0.002 +/- 0.002        -0.002 +/- 0.002
1350      0.001 +/- 0.002        -0.001 +/- 0.002        -0.003 +/- 0.002        -0.004 +/- 0.002
1472     -0.003 +/- 0.001        -0.003 +/- 0.001        -0.002 +/- 0.001        -0.000 +/- 0.001
1592     -0.004 +/- 0.003        -0.006 +/- 0.003        -0.005 +/- 0.002        -0.007 +/- 0.002
As we can see the plots, there are no strong time dependency of the correction factors. At this stage, it seems permissible to use the current correction factor for the future observations.