MTA_DB_GET
    result = mta_db_get(ter_cols='', [ prim='', sec='', timestart='', timestop='', $
                                       outfile='', opt='', /debug ] )
     where - ter_cols is a string containing comma delimited column
                        names (eg. '_1dahacu_avg') or full
                        DataSeeker style specs
                        (eg. 'mtaacis..aciseleca_avg._1dahacu_avg')
           - prim is an optional comma delimited list of DataSeeker
                        primary criteria, value pairs
                        (eg. prim='obsid=9999, grating=HETG')
                        valid criteria are: obsid, rafrom, rato,
                             decfrom, decto, rollfrom, rollto,
                             si, grating, format, pcadmode, radmon
           - sec is an optional comma delimited list of DataSeeker
                        secondary (configuration) criteria, value pairs
                        (eg. sec='_ctufmtsl=FMT2')
           - timestart is an optional start time filter
              valid formats are:
                    SECS    Elapsed seconds since 1998-01-01T00:00:00
                    DATE    YYYY:DDD:hh:mm:ss.ss...
                    CALDATE YYYYMonDD at hh:mm:ss.ss...
                    FITS date/time format YYYY-MM-DDThh:mm:ss.ss...
           - timestop is an optional stop time filter
           - outfile is an optional filename for the fits output.
           - opt is an optional string of additional DataSeeker options
                      to append to command line. Use with caution.
           - debug is an optional keyword for extra verbosity
EXAMPLES:
; get columns _ohrthr42_avg and _1hoprapr_avg between
;  Jan 01,2002 and Jan 02,2002 and save a fits file, as well as assigning
;  output structure to test_data
test_data = mta_db_get(timestart='2002-01-01',timestop='2002-01-02', ter_cols='_ohrthr42_avg,_1hoprapr_avg,_1hoprapr_std', outfile='test2.fits')

; get some columns during a specific time specified as seconds since 01/01/1998
test_data = mta_db_get(timestart=127500000,timestop=128500000, ter_cols='_tscpos_avg,_ohrthr42_avg,_1hoprapr_avg', outfile='test2.fits')

; get some columns during a specific time in FMT4
test_data = mta_db_get(timestart=127500000,timestop=128500000, sec='ctufmtsl=FMT4', ter_cols='_tscpos_avg,_ohrthr42_avg,_1hoprapr_avg', outfile='test2.fits')

; get some columns for obsid 3383
test_data = mta_db_get(prim='obsid=3383', ter_cols='_tscpos_avg,_ohrthr42_avg,_1hoprapr_avg', outfile='test2.fits')

; get a whole table and some other columns for obsid 3383
test_data = mta_db_get(prim='obsid=3383', ter_cols='mtaacis..acismech_avg,_ohrthr42_avg,_1hoprapr_avg', outfile='test2.fits')

; get some columns for obsid 3383 during FMT4, but use a different ccdm lookup table
test_data = mta_db_get(prim='obsid=3383', sec='ctufmtsl=FMT4', ter_cols='mtaacis..acismech_avg,_ohrthr42_avg,_1hoprapr_avg', outfile='test2.fits', opt='-c myccdm.tab')
MTA_DB_PLOT
This is an IDL wrapper routine around the standard IDL plot routine, to specifically plot filtered data from the MTA average databases.
SYNOPSIS:
   mta_db_plot, struct, 'xaxis', 'yaxis', [ filter='', opt='' ]
      where - struct is an idl structure of arrays (variable)
            - xaxis is the tagname of values to plot on x axis (string)
            - yaxis is the tagname of values to plot on y axis (string)
            - filter is an optional keyword to specify a where-like
                        filter using the struct tagnames (string)
            - opt is an optional string of comma delimited
                        idl plot keywords to apply (string)
EXAMPLES:
; plot data
test = mrdfits('test.fits', 1) ; use this instead of mta_db_get if you already have a data file

; plot test.time vs test.1dahacu_avg
mta_db_plot, test, 'time', '1dahacu_avg'

; plot some different columns
mta_db_plot, test, '1dahacu_avg', '1dahavo_avg'

; plot some columns, but first filter by time
mta_db_plot, test, 'time', '1dahacu_avg', filter='time gt 95050000'

; plot some columns, apply more complicated filter
mta_db_plot, test, '1dahacu_avg', 'ohrthr27_avg', filter='time gt 95050000 and time lt 95060000'

; again
mta_db_plot, test, '1dahacu_avg', 'ohrthr27_avg', filter='time lt 95050000 or time gt 95060000'

; weird filter
mta_db_plot, test, 'time', 'ohrthr27_avg', filter='ohrthr27_avg * 6 - 4 lt 1778'

; weirder
mta_db_plot, test, 'time', 'ohrthr27_avg', filter='ohrthr27_avg * 6 - 4 lt 1778 and (time lt 95010000 or time gt 95030000)'

; customize plot with IDL plot routine options
mta_db_plot, test, 'time', 'ohrthr27_avg', filter='ohrthr27_avg * 6 - 4 lt 1778 and (time lt 95010000 or time gt 95030000)', opt='psym=5, ystyle=1, xtitle="time", ytitle="ohrthr27_avg", title="Test Plot"'
QUICK EXAMPLE
If everything is working correctly, you should be able to do this.
data = mta_db_get(timestart='2002:001:00:00:00',timestop='2002:003:00:00:00', ter_cols='_aogbias1_avg,_tsapyt_avg,_tscedge_avg,_1hoprapr_avg', outfile='test.fits', /debug)
;command used > dataseeker.pl -o test.fits -s "timestart=2002:001:00:00:00 timestop=2002:003:00:00:00 columns=_aogbias1_avg,_tsapyt_avg,_tscedge_avg,_1hoprapr_avg "
;MRDFITS: Binary table. 5 columns by 576 rows.
;
;Columns:
;TIME X1HOPRAPR_AVG AOGBIAS1_AVG TSCEDGE_AVG TSAPYT_AVG
; retrieved in 9.5503811 seconds
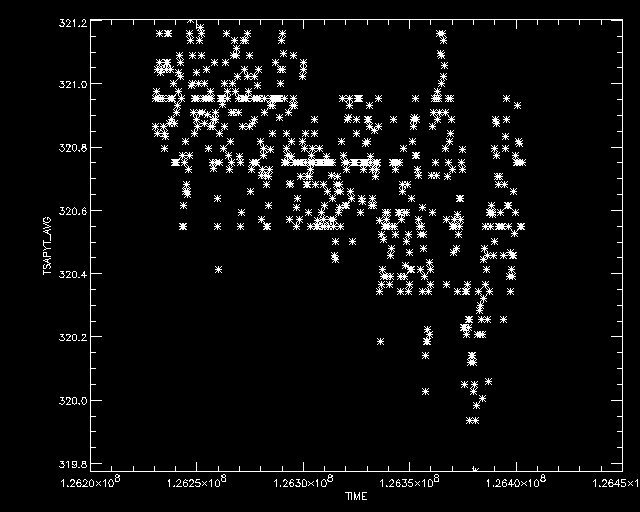
mta_db_plot, data, 'time', 'TSAPYT_AVG'
;plotting TIME vs TSAPYT_AVG
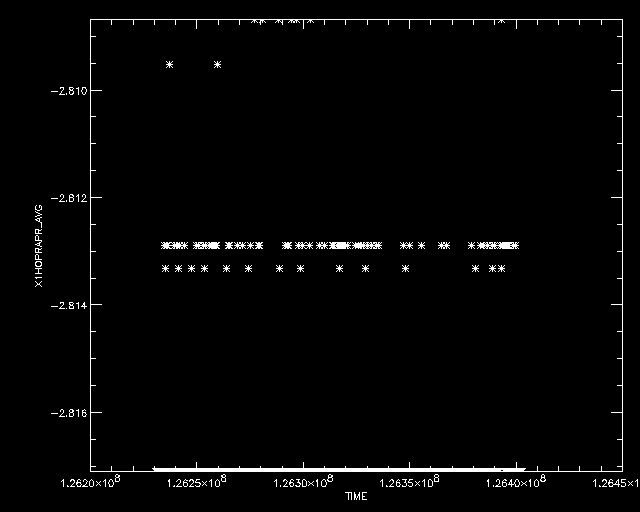
 mta_db_plot, data, 'time', 'X1HOPRAPR_AVG'
;plotting TIME vs X1HOPRAPR_AVG
mta_db_plot, data, 'time', 'X1HOPRAPR_AVG'
;plotting TIME vs X1HOPRAPR_AVG
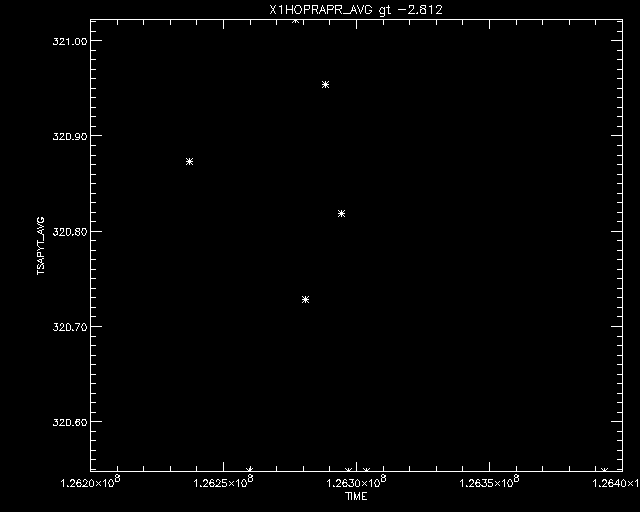
 mta_db_plot, data, 'time', 'TSAPYT_AVG', filt='X1HOPRAPR_AVG gt -2.812'
;plotting TIME vs TSAPYT_AVG
mta_db_plot, data, 'time', 'TSAPYT_AVG', filt='X1HOPRAPR_AVG gt -2.812'
;plotting TIME vs TSAPYT_AVG
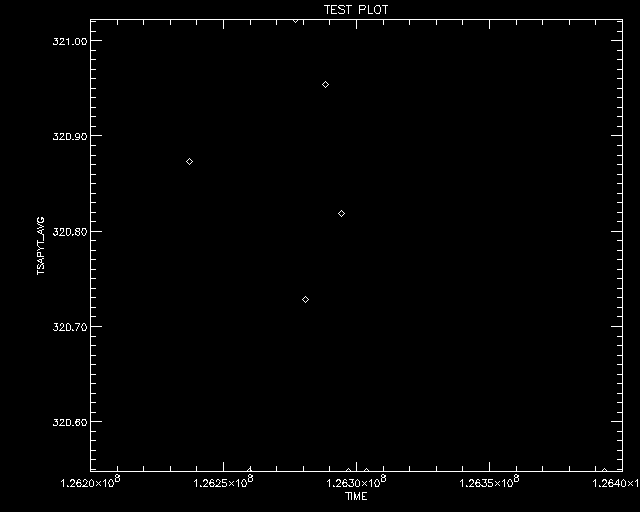
 mta_db_plot, data, 'time', 'TSAPYT_AVG', filt='X1HOPRAPR_AVG gt -2.812', opt='title="TEST PLOT", psym=4'
;plotting TIME vs TSAPYT_AVG
mta_db_plot, data, 'time', 'TSAPYT_AVG', filt='X1HOPRAPR_AVG gt -2.812', opt='title="TEST PLOT", psym=4'
;plotting TIME vs TSAPYT_AVG
12. FEB 2002 BDS