ACIS Science Instrument Background
Enteir Period
Last Three Months
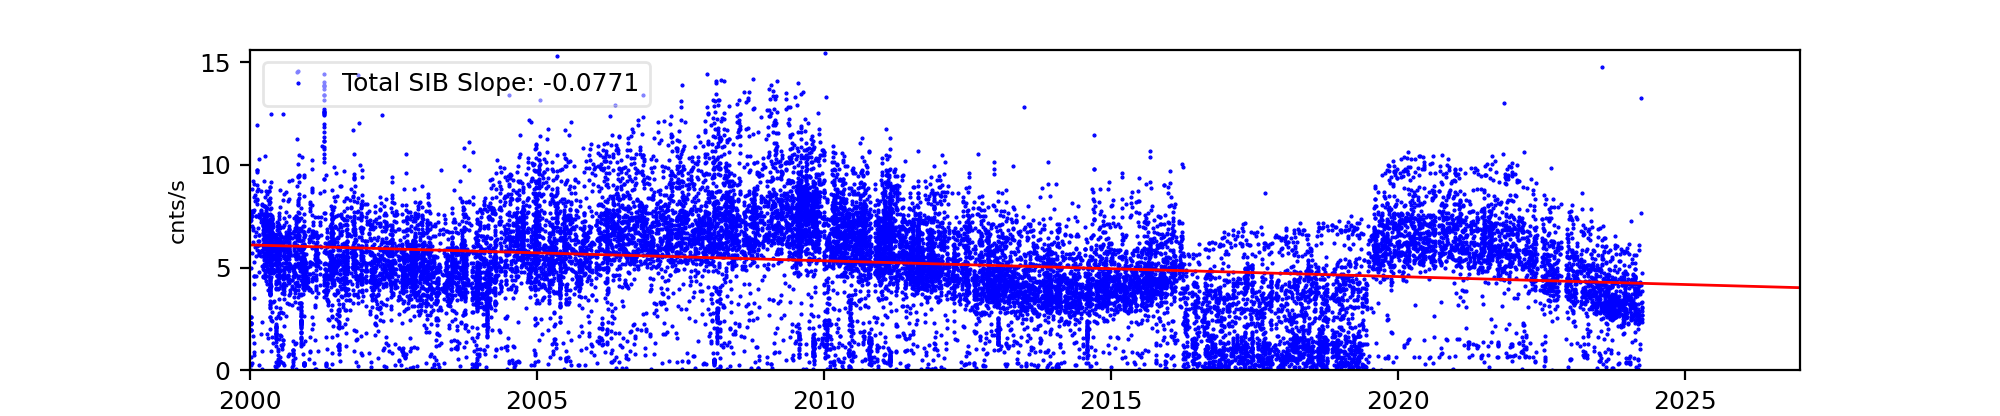
This page shows scientific instrument background (SIB) data based on ACIS observations, using Level 1 data.
The SIB is computed using the following steps.
- First, locate the main source and remove about 200 pixel radius around the source.
- Locsate all point sources using celldetect function
- To lower the probability of leakage from bright sources, increase the size of covered area around
the sources to three times of that of celldetect estiamate
- Add up all the removed area. The ratio / will be used later to correct SIB value.
- Compute SIB of the data
- SIB value is corrected by deviding the ratio esitmated above
If you are interested in checking the scientific instrument background
computed with Level 2 data set, please to go to
level 2 SIB page.
On each page, you find:
- All CCD combined SIB plots
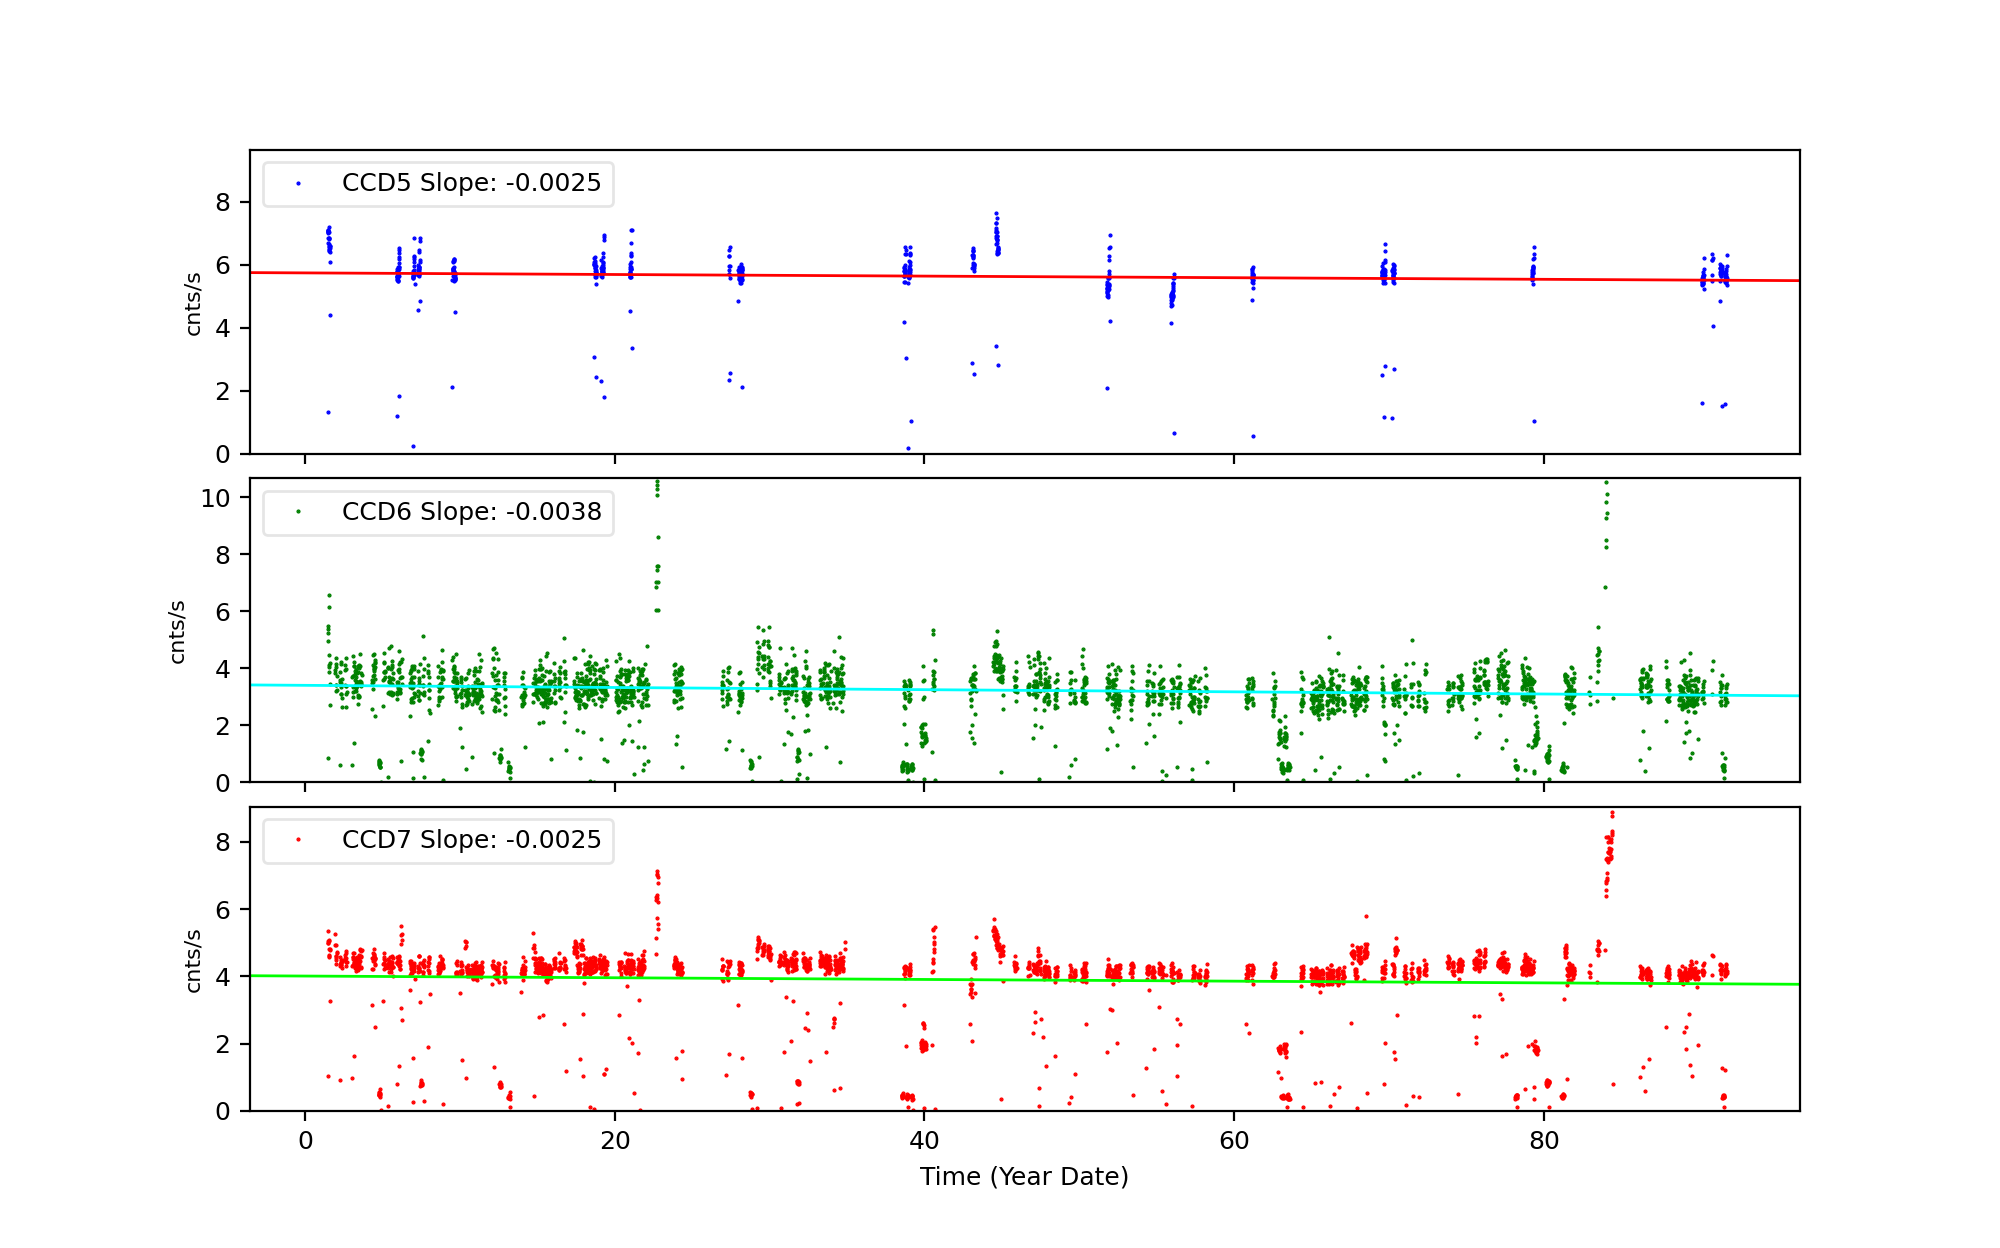
- CCD5, 6, and 7 SIB plots
- Each CCD plot with no energy range separated
- Each CCD plot with 6 energy ranges. The energy ranges are:
| Name | Low (keV) | Hight(KeV) | Description |
|---|
| SSoft | 0.00 | 0.50 | Super soft photons |
|---|
| Soft | 0.50 | 1.00 | Soft photons |
|---|
| Med | 1.00 | 3.00 | Moderate energy photons |
|---|
| Hard | 3.00 | 5.00 | Hard Photons |
|---|
| Harder | 5.00 | 10.00 | Very Hard photons |
|---|
| Hardest | 10.00 | | Beyond 10 keV |
|---|
The following three links give long term trending pages.
Last Updated: May-03-2026
If you have any questions, contact: swolk@cfa.harvard.edu