PKS 0637 and X-ray Jets From Quasars
Dan Schwartz, Aneta Siemiginowska
Chandra has made critical contributions to virtually every field of observational astrophysics, from planetary systems to cosmology (Wilkes & Tucker, 2019). These discoveries literally began at the very start of the mission; from its first in-orbit focus observations, Chandra opened up the study of extended, extragalactic jets in the X-ray band. This article is the story of how that happened, what we have learned, and what is yet to be learned.
Focusing Chandra
Quasar jets are typically only a few arcsec long and not resolved across the jet. Thus very good resolution is required to concentrate the flux and detect it against the non-X-ray background. To achieve this level of precision, the Chandra mirror that had been calibrated to have half-arcsec resolution on the ground first needed to be focused on-orbit.
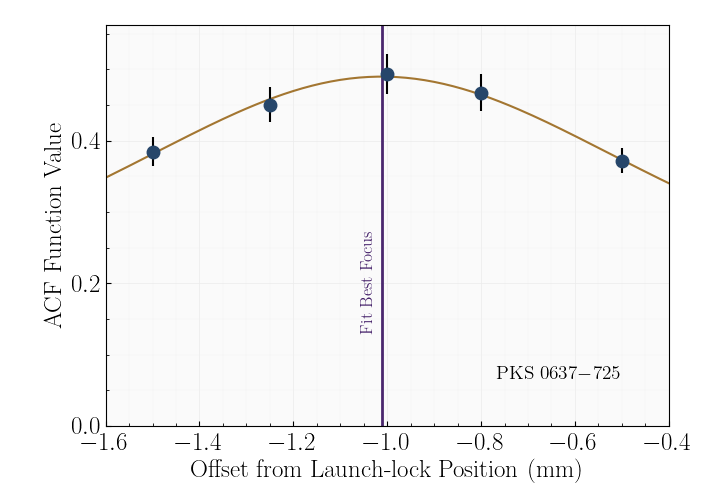
Figure 1: Illustration of the method used to establish the best focus for the Chandra telescope. The maximum correlation of the predicted and measured two dimensional image when we remeasured the focus eight months after launch had not changed from our established zero reference position.
Since X-rays reflect efficiently only near grazing incidence and cannot be transmitted through one atmosphere of air, it was not practical to simulate a point source to establish the Chandra mirror focus on the ground. Therefore, the science instrument module (SIM) incorporated motion along the optical axis, so that the best focus could be set on orbit, separately for each of the two X-ray cameras. The procedure to determine this focus adjusted the focal plane position in small steps around what was the best measurement of focus based on design and ground metrology measurements. The adjustment range was 10 mm, while the estimated accuracy of the focal plane placement was 1 mm. At each step of the adjustment an image was taken and correlated with a predicted image based on our best ray tracing prediction of the mirror performance. The focus measurement was performed immediately after deployment and repeated eight months after launch, with the two measurements found to be identical. Figure 1 shows the results of this focus measurement, while Figure 2 shows some of the images taken. The quadratic curve fit to the focus measurements shows that the depth of focus, i.e., the range over which the imaging quality does not appreciably change, is about 0.1 mm. The entire focusing procedure was repeated for each of the two arrays of each of the two focal plane cameras, with and without the gratings.
To perform the correlation with the predicted image of a point source, we needed to choose an appropriate target for calibration. But as we were looking at a much sharper angular resolution than any previous X-ray observatory, we needed to be sure our target was truly a point source. Since sources cannot be larger than the distance that light can propagate over the timescale that the source flux changes substantially, we choose the variable quasar PKS 0637−752 (PKS0637 for short). The source was known to be relatively bright, having been discovered in the High Energy Astronomy Observatory 1 all-sky survey (Wood et al., 1984), meaning that the focus determination could be made quickly. Positive identification of the X-ray source with the radio-loud quasar had been made by Elvis & Fabbiano (1984), so that a precise position was known. And subsequent observations with the Ginga and ASCA satellites showed variability of at least a factor of 3 (Yaqoob et al., 1998) over an order of years-long timescales, ensuring that the target at this redshift was certainly a point source.
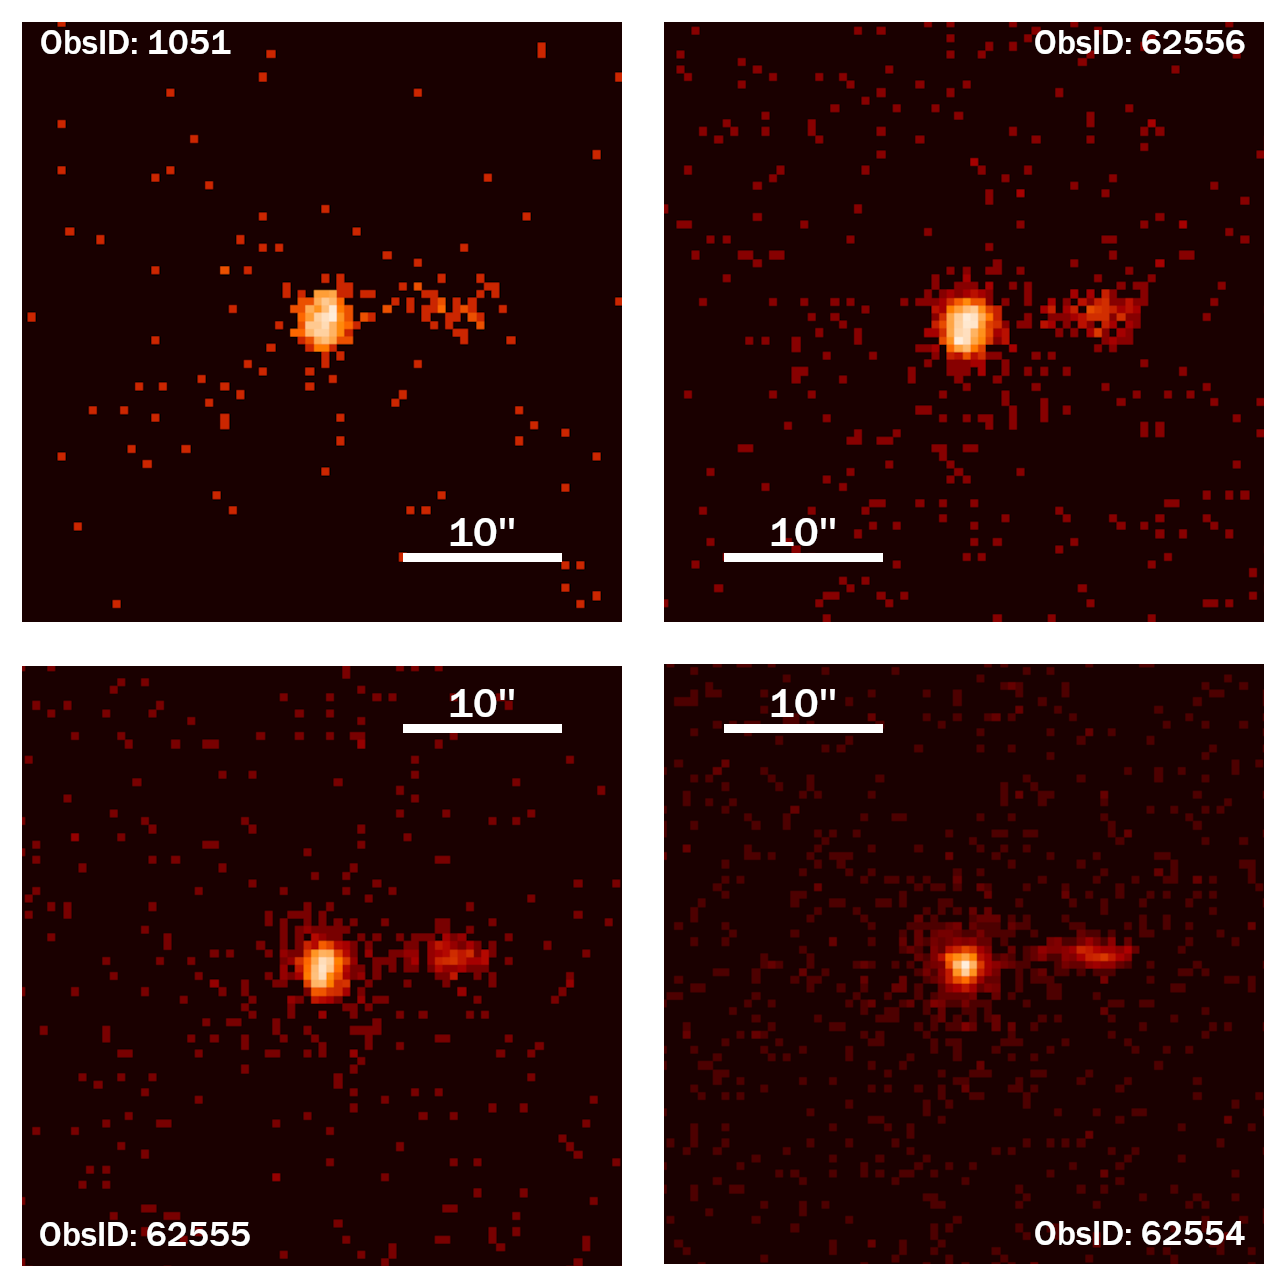
Figure 2: First observations to establish the focus of the Chandra telescope, with the source about 90″ off-axis. The upper left image was at the launch-lock position of the SIM. It was soon realized that the blurring to the west of the quasar core was X-ray emission from the previously known radio jet. These images were part of a larger sequence used to establish the best focus.
The upper left panel of Figure 2 shows the first image of PKS0637. This was certainly not the expectation for a point source image, even far out of focus! A blurring is visible to the west of what should be a point-like quasar core. This deviation raised the question of whether Chandra was pointing stably, or if the start of data collection had been commanded before the spacecraft finished slewing.
However the PKS name, indicating the Parkes radio survey, gave a hint to what was happening. The blurring to the west was not a problem with the observatory but an X-ray jet coincident with the previously known radio jet (Tingay et al., 1998, 2000). Because of the superb, sub-arcsecond angular resolution of the Chandra mirror, it turned out that the jet did not contaminate the focus measurements. Eight months later, when we retested the focus on another point source, we found that it was the same value we had derived using PKS0637, jet and all.
The PKS 0637−752 Jet
The story of PKS0637 did not end with the focusing observations; rather, it was the start of an ongoing investigation, one that would return Chandra to this source 18 years later. Figure 3 shows the Chandra observations from the two epochs that this system was observed. Also shown are 20 GHz and 5 GHz flux densities from the Australian Compact Array. The top X-ray image from August 1999 has 34 ks merged from six observations during the focus and calibration sequence. It might not represent the very best Chandra imaging performance, but it does clearly show an apparently continuous jet extending out to 11″ from the quasar and faint X-ray emission from the lobe at the end of the unseen receding jet. The bottom panel is merged data from 113 ks in November 2017. The quasar has more than 7 times as many counts in this observation with only 3.3 times the exposure, so it has brightened by more than a factor of 2. Due to the contamination of the ACIS optical blocking filter, the jet has only 2.6 times as many counts, and the receding lobe is not detected.
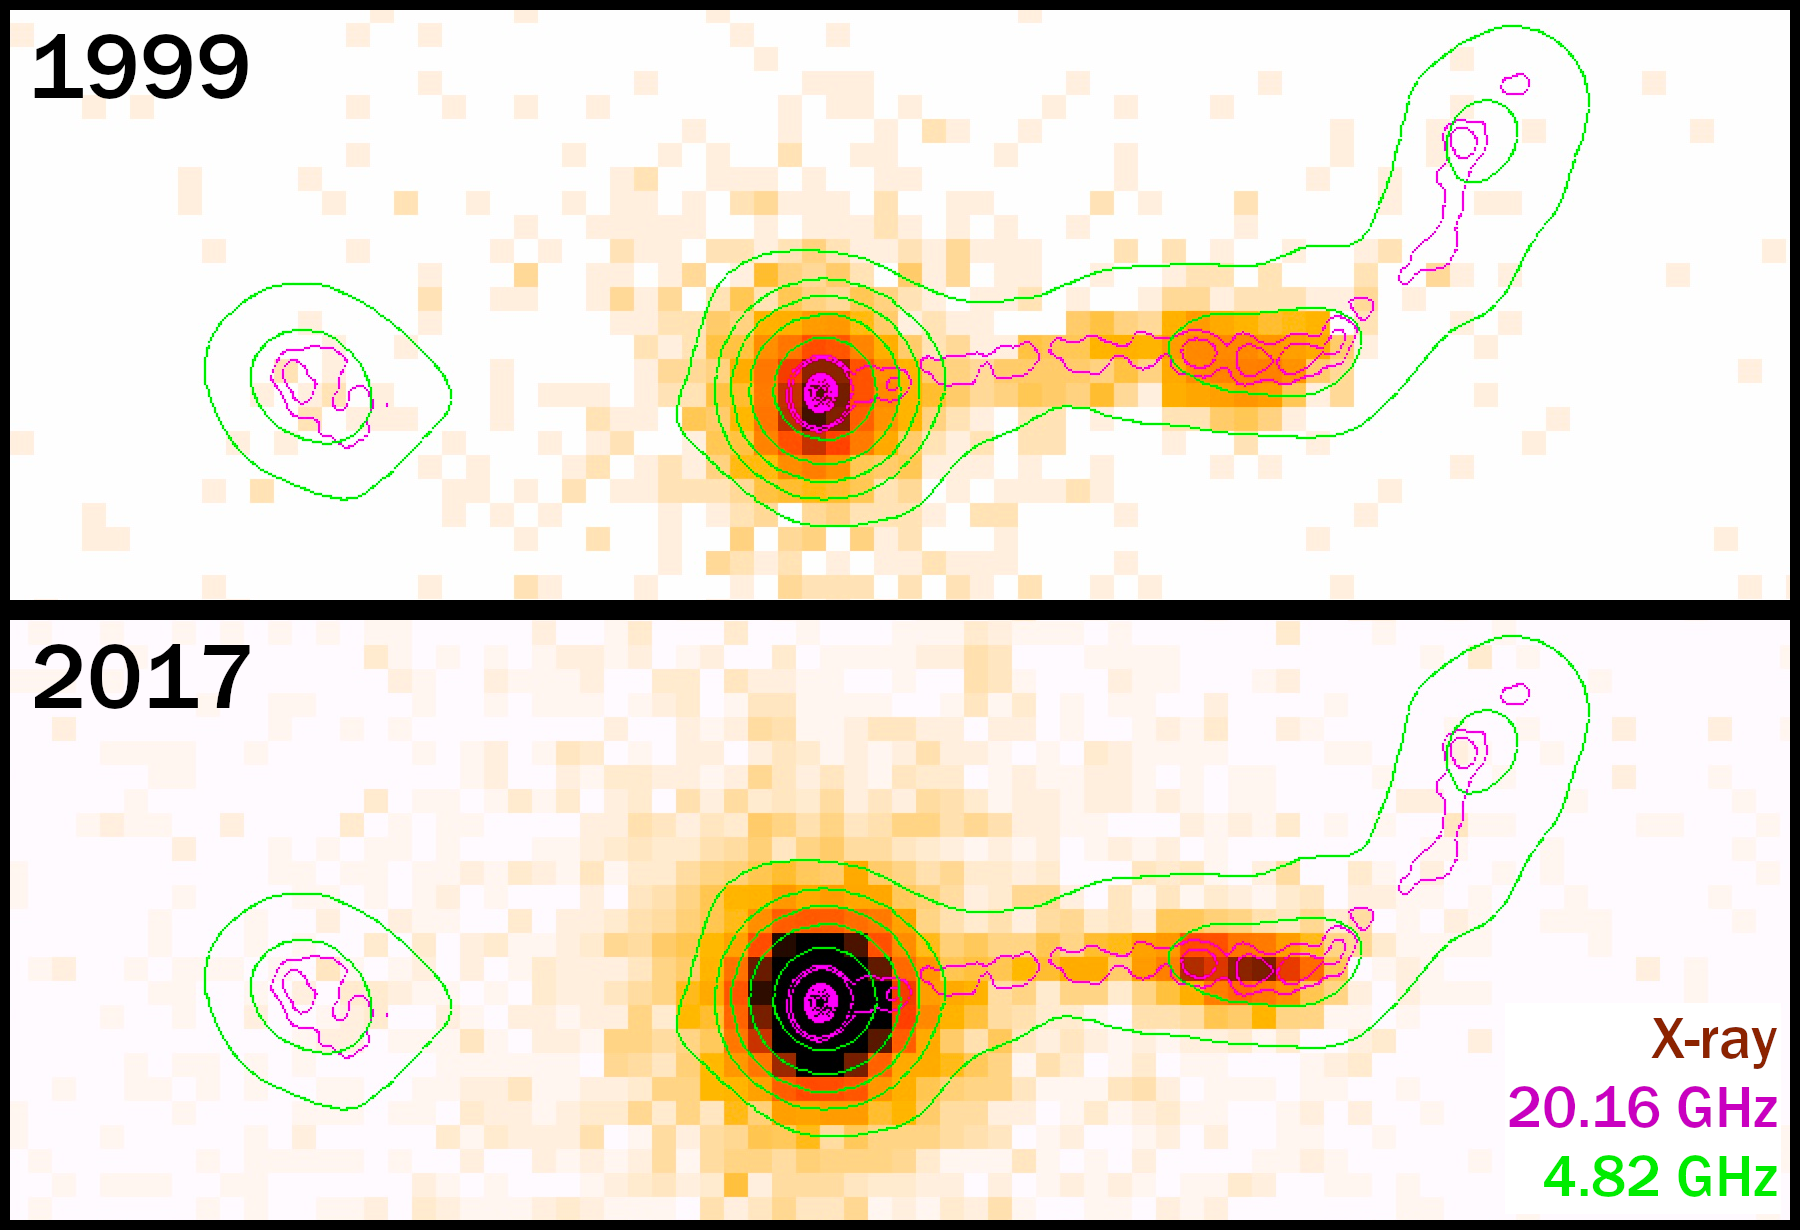
Figure 3: 0.3–7 keV Chandra images of the PKS0637 quasar and its jet merged from 34 ks of observations from August 1999 (top panel) and 113 ks of observations from November 2017 (bottom panel). Magenta and green contours trace the 20.16 and 4.82 GHz flux densities, respectively, from observations by Godfrey et al. (2012) and Tingay et al. (1998) at the Australian Telescope Compact Array. We see blended X-ray emission from the four brightest radio knots, a weaker inner jet that can be distinguished starting about 3″ from the quasar, and weak but significant emission from the receding lobe. The quasar flux has increased by at least a factor of two between the two observations, although there is some dimming observed in the jet owing to contamination on the ACIS optical blocking filter.
The discovery publications (Schwartz et al., 2000; Chartas et al., 2000) struggled to interpret the mechanism of the jet emission. Strong polarization observed in the radio features (including the jet) established the source of that radiation as synchrotron emission. Crucially, though, that spectrum could not be extended to X-ray wavelengths without violating optical upper limits. X-ray synchrotron could still be produced if there was a separate spectrum of relativistic electrons with a low energy cutoff at high Lorentz factors1, but this population would not explain the co-spatial positions of X-ray and radio flux. Compton scattering was therefore deemed to be the most likely source of X-ray photons. However, the specific Compton models considered—boosting either the synchrotron radio photons or the cosmic microwave background (CMB) photons—required significant amounts of energy and/or unlikely geometries to produce the observed flux. Tavecchio et al. (2000) and Celotti et al. (2001) independently pointed out the missing physics: the cosmic microwave background radiation intensity experienced in a relativistic jet is enhanced by the bulk Lorentz factor squared.
Since those publications, inverse Compton up-scattering of the cosmic microwave background (IC/CMB) photons has been widely invoked to model the X-ray emission from flat spectrum quasars (e.g., Sambruna et al., 2002, 2004; Marshall et al., 2005, 2011, 2018; Harris et al., 2017). The IC/CMB mechanism requires a minimum of additional assumptions to model the data, including that the magnetic field strength and the relativistic particle density in jets have only the minimum total energy required to produce the radio emission. The jets are known to be relativistic because they are one-sided, and so additional assumptions are needed to account for the degeneracy among the bulk Lorentz factor, the angle of the jet to our line of sight, and the amount of Doppler boosting of the intensity in our direction. This degeneracy is typically dealt with by assigning a fiducial value to the bulk Lorentz factor or by assuming that the angle to the line of sight is the largest it can be for the required amount of Doppler boosting.
The observed X-ray luminosity density of the jets that are detected exceeds their radio luminosities, typically by an order of magnitude. It is an open question whether this is just a selection effect, such that there exists a larger population of jets not being detected in X-rays. There have been some systematic surveys for X-ray jets (e.g., Sambruna et al., 2002; Marshall et al., 2005) that have detected about 60% of the targets, but we do not know enough about the general relation of X-ray to radio jets to assess the biases in those surveys.
Extragalactic X-ray Jets
The prevalence of jets in the Universe has important consequences beyond modeling individual X-ray sources. Jets play a fundamental role in the dynamics of a supermassive black hole (SMBH) system. They carry significant energy (or more precisely, significant enthalpy) flux that can be an important item of the active galactic nuclei (AGN) energy budget. Jets are part of the feedback process by which SMBHs influence their large-scale surroundings, which in turn affect the rate at which the SMBHs grow. X-ray observations play a vital role in determining this energy flux.
Power carried by radio jets generally has been estimated by a minimum energy calculation: the total energy contained in observed radio lobes or bubbles is divided by an estimate of the lifetime of the radio activity. Correlations and proxies based on these assumptions have been used to extend investigations to large numbers of radio sources (e.g., Daly, 2016). Assuming IC/CMB emission, the combination of X-ray data with the known temperature and energy density of the CMB at a given redshift allows us to estimate the power of any jet from observations of the given jet itself. These powers turn out to be of the order of 1045–1047 erg s−1, which is comparable to—or even in excess of—the Eddington luminosities estimated for the supermassive black holes (SMBHs) in these quasar cores. The Eddington luminosity, the luminosity at which outward radiation pressure balances the gravitational pull on accreting matter, does not apply to the highly collimated jet flux. Such jet-enabled super-Eddington accretion may be relevant to the problem of how SMBHs of 109 M☉ form less than a billion years after the Big Bang (Jolley & Kuncic, 2008; Fabian et al., 2014).
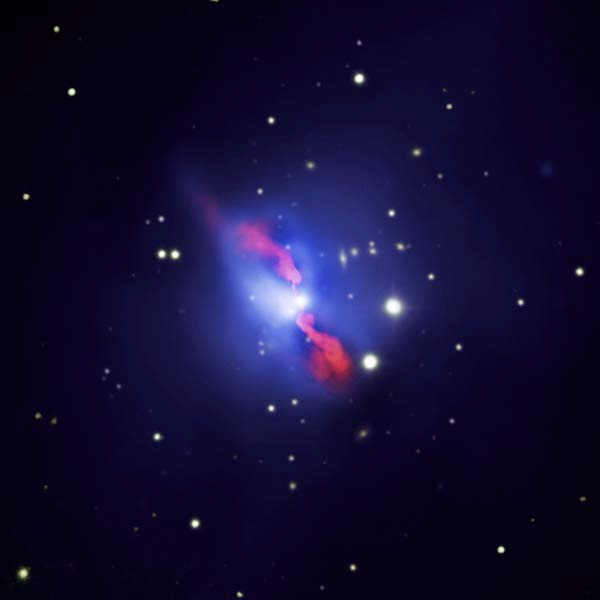
The galaxy cluster Hydra A. A radio jet (red) is inflating bubbles in the X-ray gas (blue) comprising the cluster. Chandra has shown that jets from SMBH answer the mystery of why the hot gas does not collapse catastrophically to the center of the cluster. Credit: X-ray: NASA/CXC/U.Waterloo/C.Kirkpatrick et al.; Radio: NSF/NRAO/VLA; Optical: Canada-France-Hawaii-Telescope/DSS)
How these jets inject this energy into their surroundings is also vital to interpreting X-ray observations of galaxy clusters. Such large observed enthalpy fluxes are equal to or greater than the work needed to prevent the catastrophic collapse of the gas that would otherwise cool in much shorter than a Hubble time as it falls toward the cluster center and is compressed (AGN-inflated bubbles preventing collapse of the X-ray emitting gas in Hydra A is shown in Figure 4). Although there is still much to learn about how AGN affect cluster gas, thanks to the high-resolution imaging of Chandra the broader Cooling Flow problem has been resolved.
The large jet powers intuitively suggest that quasar winds and ultra-fast outflows could also have similar powers. These energy reservoirs enable different mechanisms to play a part in the feedback process that regulates the correlation of black hole mass to the central bulge mass of galaxies. Both to model specific systems and to develop broader models of galaxy populations, a detailed understanding of the structure and X-ray emission mechanism of the jets is needed.
Inverse Compton X-rays, Not Inverse Compton X-rays
Modeling of X-ray jet emission as inverse Compton scattering of the microwave background has several attractive features. To all the common assumptions needed for modeling the radio emission of jets, this adds only one more free parameter—the unknown angle to the line of sight—and then permits calculation of the bulk Lorentz factor. If the X-rays are radiated from the same electrons emitting at GHz radio frequencies, then the observed morphological similarities of those bands is naturally explained. Since the inverse Compton emission is beamed more than the radio synchrotron (Dermer, 1995), this model also explains the extinction of X-rays when a radio jet bends through a substantial angle. Such a feature is seen in Figure 3, where the jet from PKS0637 bends 11.″2 west of the nucleus.
However, substantial problems with the IC/CMB model were also noted. These included the prevalence of radio knots to extend downstream of X-ray knots, whereas the higher energy radio emitting electrons should lose their energy first while the lower energy X-ray emitters should persist further downstream. There were concerns on how a jet could maintain bulk Lorentz factors of the order of 10 and extend out to 100’s of kpc distances. Despite these challenges, the IC/CMB model continued to be used because it avoids even larger issues with alternate mechanisms. For example, X-ray synchrotron radiation predicts short lifetimes of only 100’s of years for the emitting particles. Thus this second, independent population of relativistic electrons would have to be generated essentially continuously along the length of the jet.
An elementary and totally model independent prediction of the IC/CMB mechanism is that a jet with fixed internal parameters should retain almost its same surface brightness, less a bolometric correction, at any arbitrarily large redshift (Schwartz, 2002). This is because the energy density of the cosmic microwave background increases with redshift as (1+z)4 while the cosmological diminution of surface brightness exactly compensates as (1+z)−4. Scaling the initial surveys of jets at z≤1 to the few jets observed at larger redshifts does not confirm this. Since we cannot actually move a jet to different redshifts, the specific prediction is that the X-ray flux density to radio flux density should increase as (1+z)3+α where α is the energy spectral index. This allows the possibility of a jet that is detected in X-rays only.
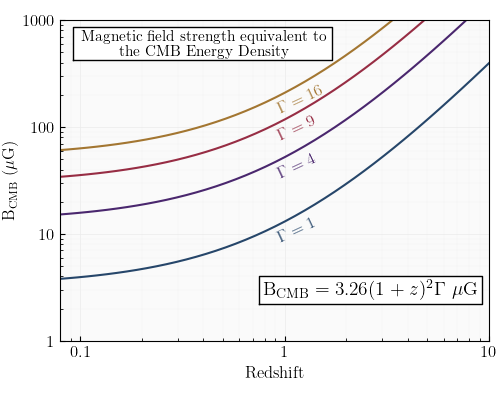
Figure 5: For any given bulk Lorentz factor, indicated by the colored curves labeled with Γ, and at any redshift, inverse Compton scattering will dominate unless the magnetic field strength is greater than indicated on the curve.
The ratio of the flux densities must actually be the ratio of the energy densities of the target photons, i.e., the CMB energy density divided by B2/(8π). For the lower redshift jets, the IC/CMB model predicts rest frame magnetic fields from about 5 to 60 microgauss. The required magnetic field strengths to dominate over the CMB are shown in Figure 5.
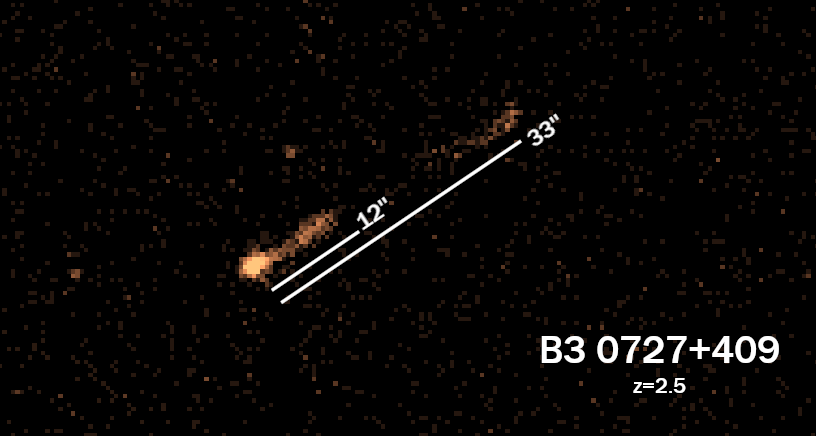
Figure 6: Chandra ACIS-S image of z = 2.5 quasar B3 0727+409, which has an extended (100’s of kpc) X-ray jet with no detected radio counterpart. This discovery was serendipitous, as the quasar was a background source in a short observation of a low-redshift galaxy cluster (Simionescu et al., 2016).
Thus inverse Compton of the CMB to produce X-rays must occur at large redshift, and it is in fact observed. Figure 6 shows a serendipitous discovery of a 35″ long X-ray jet with no radio emission detected above 0.29 mJy past 5″ from the quasar (Simionescu et al., 2016). The system is B3 0727+409 at a redshift of 2.5. Assuming only a modest angle of less than 20° to the line of sight, this jet would be over a Mpc long. Even if the rest frame magnetic field is as much as 100 microgauss, then the bulk Lorentz factor need be no more than about 3 for the IC/CMB to dominate (Figure 5).
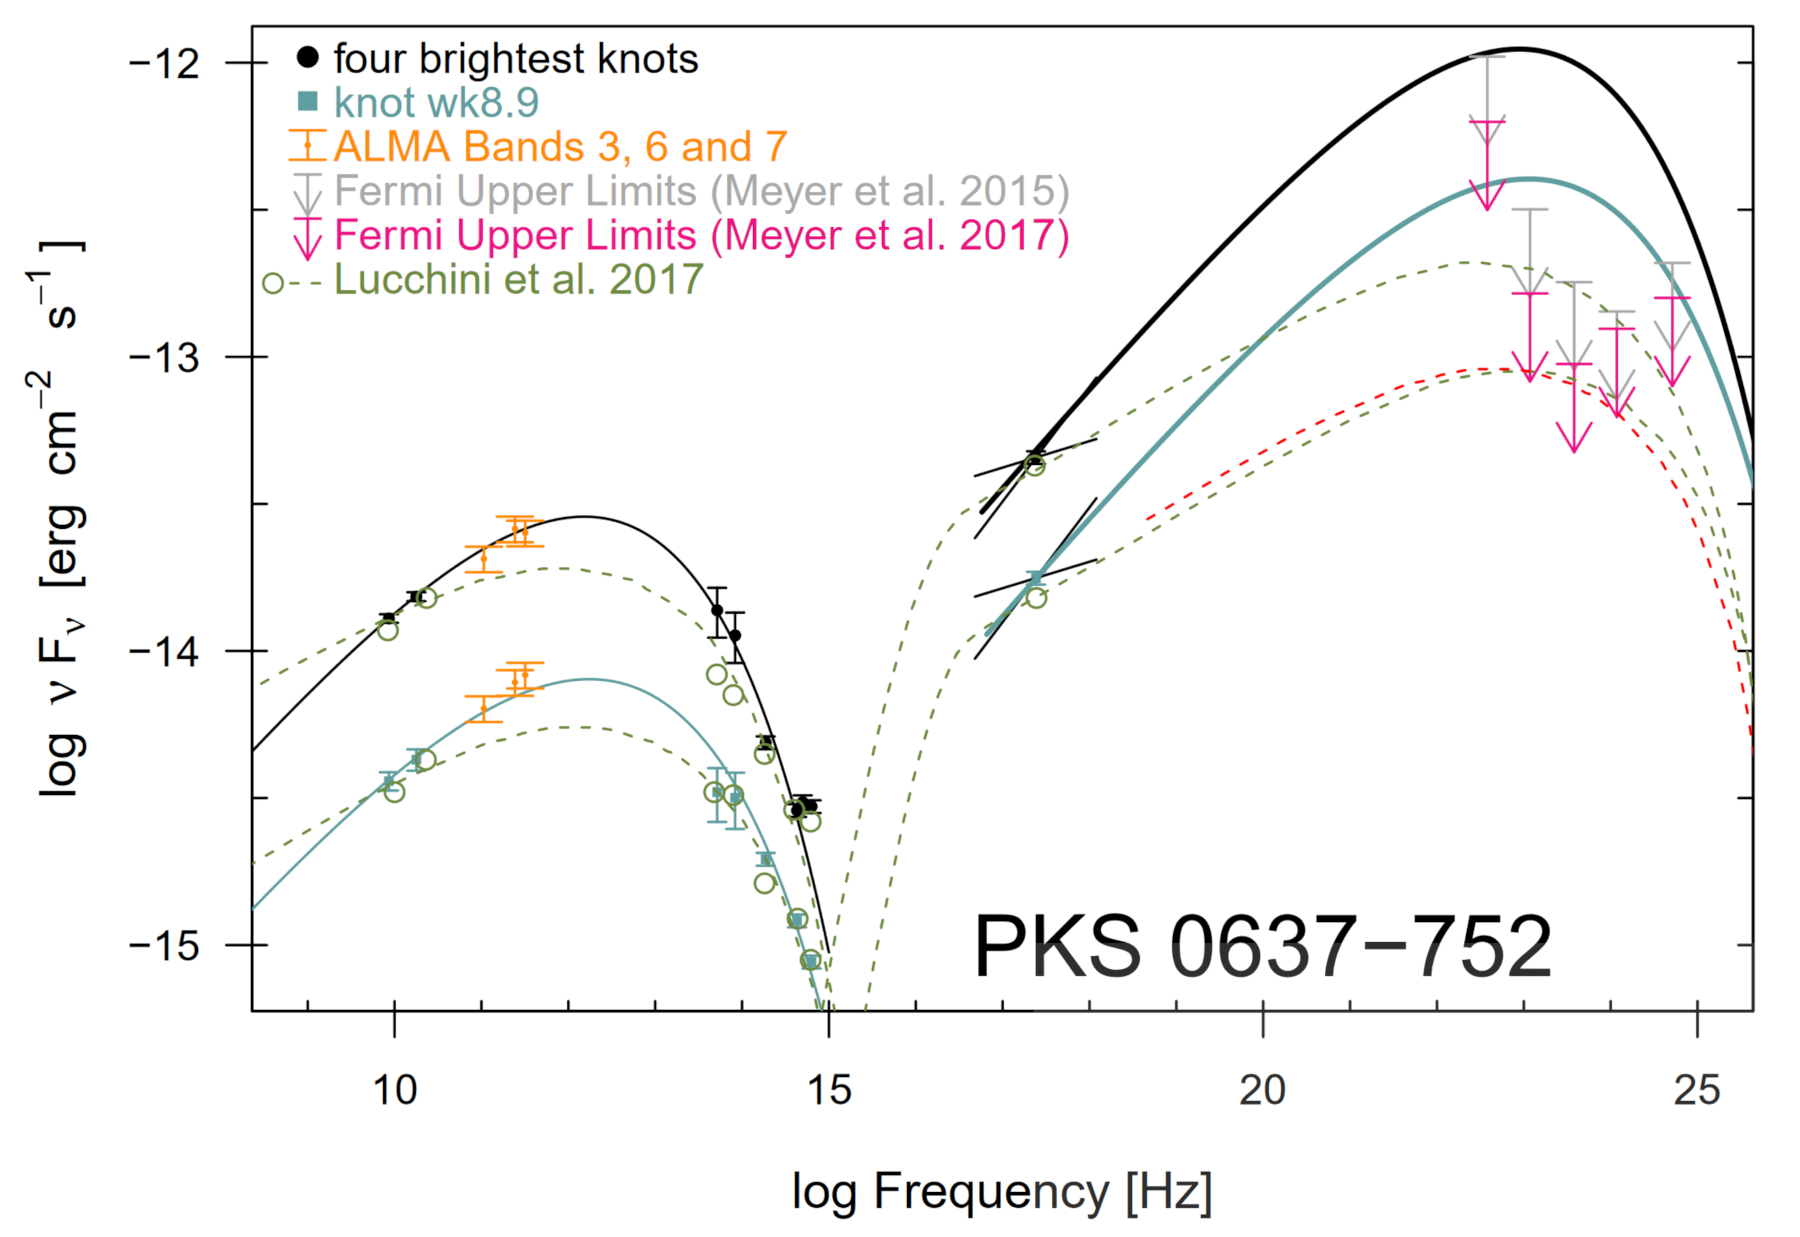
Spectral energy distribution of the four overall brightest knots (black) and the X-ray brightest knot (cyan) in the jets of PKS0637. An inverse Compton model (solid lines), parameterized by the radio fluxes and anchored by the Chandra observation, is incompatible with upper limits derived from the Fermi/LAT detector. This figure first appeared in Meyer et al. (2017) and is used with permission.
Now that we see that inverse Compton X-ray jets do occur, Figure 7 shows that inverse Compton X-rays do not occur (Meyer et al., 2017)! The figure plots the flux densities of the synchrotron component measured from radio to optical for PKS0637. If the relativistic electrons extrapolated to lower energies than those producing the radio synchrotron also produce the inverse Compton X-rays, then the high energy electrons producing the ALMA synchrotron emission must produce inverse Compton TeV gamma-rays as indicated by the solid black and green lines. However, observations by the Fermi Gamma-ray Space Telescope, shown by the bars with the down-arrows, do not allow such a TeV flux. Therefore, at least the distinct knots in PKS0637 must be synchrotron X-ray emission and must be from a relativistic electron population distinct from that producing the radio through infrared emission.
What have we learned? What don’t we know?
While X-ray radiation from jets is common, it is unfortunately faint in comparison to X-rays from bright quasars, such that a detection of X-ray jets requires high angular resolution mirrors and high dynamic range instruments. Currently only Chandra has the necessary capabilities to study large scale X-ray jets and to learn about their morphology and spectra. Over 24 years, our understanding of jets has increased from the first out-of-focus images of PKS 0637 via many discoveries of new X-ray jets. Chandra provided insights into the conditions in the regions where the emission occurs, the mechanisms that produce X-rays, and the evolution of jets over the lifetime of the Universe.
For many jets, the X-ray morphology is complex, with enhancements—knots and hotspots—pointing to changes in the jet flow and the locations of the jet’s energy release. As jets’s X-ray radiation processes are not well understood, the increasing number of observed sources is needed to build a database. There are about 200 jets in the Chandra archive (see XJet2 and Atlas-X3 for compilations) with varied data quality, but these data have already allowed for interesting statistical studies. For example, Reddy et al. (2021, 2023) examined the offsets between peaks of the X-ray and radio brightnesses in the knots and hotspots, as these offsets have specific model predictions. They concluded that the one-zone model of jet emission—whereby emission at all frequencies is produced cospatially—is not supported by these data and that more complex multi-zone models are more appropriate, as postulated for a few jets with deep X-ray observations (e.g. Stawarz & Ostrowski, 2002; Stawarz et al., 2004; Jester et al., 2006; Siemiginowska et al., 2007).
Breiding et al. (2023) have performed tests for the IC/CMB radiation using the gamma-ray predictions of the one-zone model. They analyzed jet knots in the 45 jets with Fermi/LAT observations and found that, combined with nine X-ray jets analyses from the literature, the IC/CMB model predictions exceeded the observed gamma-ray flux in 27 out of 54 quasars. They included three high redshift (z > 3) jets in this sample and ruled out IC/CMB for the z = 4.3 jet in GB 1508+5714. Interestingly, though, independent analysis of the LOFAR observations of this quasar suggest that the radio source has FRII4 morphology seen at a small viewing angle and that the diffuse X-rays are originating in the radio lobe via the IC/CMB process (Kappes et al., 2022).
Worrall et al. (2020) presented a deep Chandra observation of a jet associated with PKS J1421−0643 at z=3.69. The X-ray jet is just under 5 arcsec long (around 30 kpc projected), and it is one of the longest yet known at z > 3.5. The Chandra observation together with the radio and optical band data allow for constraining the jet’s X-ray radiation processes. The jet’s high frequency radio spectrum is very steep, constraining the maximum Lorentz factor of the radio emitting electrons to γe ≲ 5 × 10³. The X-ray radiation due to IC/CMB is favored for a jet at the viewing angle of about 15 degrees, which would make the jet undetectable in IR and gamma-rays bands. They estimated the jet total power (assuming electron-positron composition) to be about 3 × 1046 erg s−1 with the jet radiative efficiency of only about 0.07%. This means that most of the jet energy is available for heating the intergalactic medium.
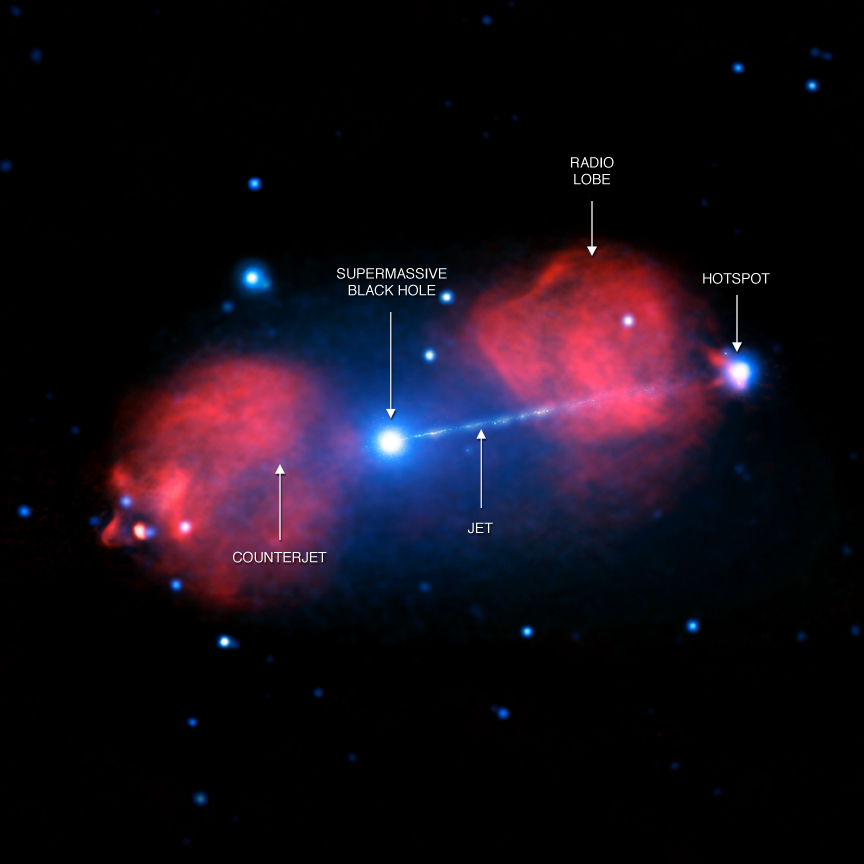
Figure 8: Composite radio (red) and X-ray (blue) view of nearby radio galaxy Pictor A. The labels indicate the central SMBH as well as a prominent narrow X-ray jet and radio lobes. At the end of the jet is a bright hotspot, visible in both X-rays and radio. Credit: X-ray: NASA/CXC/Univ of Hertfordshire/M.Hardcastle et al., Radio: CSIRO/ATNF/ATCA
The variations detected in one of the knots of Pictor A jet (Fig. 8, Marshall et al. 2010; Hardcastle et al. 2016) provided interesting constraints on the size of the X-ray emission region and ruled out the IC/CMB radiation process for this jet. The jet ends with prominent hotspots and a termination shock resolved by Chandra. Analysis of these regions by Thimmappa et al. (2020, 2022) gave interesting constraints on the particle acceleration. The hard X-ray spectra at the upstream edge of the X-ray brightness peak indicate a flat energy distribution of ultra-relativistic electrons at the front of a mildly relativistic shock. Furthermore, there is a gradient of the X-ray spectral index and the spectra become steeper away from the front of the shock, indicating efficient radiative cooling. This results in an offset between the radio and X-ray hotspots linked to the propagation length of the X-ray emitting electrons (about one parsec for magnetic fields of 0.1–1 mG to at most 100 pc for very low fields). Thus, the acceleration at the jet termination shocks is fast and efficient.
The discovery of the bright X-ray jet associated with a relatively low redshift quasar, RGB J1512+020A at z=0.22, was reported by Migliori et al. (2022). The multi-band data show different morphology, intensity, and spectra of each jet feature, indicating complex physical processes accompanying the broad-band radiation. The X-ray emission from the inner knots was modeled by synchrotron radiation, while the brightest jet feature and the jet termination regions could be explained by IC/CMB if the jet was highly relativistic, Γbulk ∼ 17, and at small viewing angle, < 3°. Conversely, the X-ray synchrotron radiation would require multiple populations of ultra-relativistic electrons and an ongoing efficient acceleration process. It will be intriguing to follow up this X-ray bright jet in the future, as the quasar is relatively X-ray faint and does not contaminate observations of the jet.
Migliori et al. (2020) studied morphological and spectral properties of several well-resolved hotspots of low-power radio galaxies where the X-ray radiation mechanism is still not known. The complex structural and spectral properties indicate multiple sites of particle acceleration in compact and diffuse regions, with a mixed population of thermal and non-thermal radiating electrons. X-ray radiation process in these hot spots is either (1) due to synchrotron radiation in compact regions with efficient ongoing particle acceleration and the diffusion scales smaller than 100 pc, or (2) it is due to inverse Compton scattering in some more extended regions with the photon field of the synchrotron emitting electrons or of the CMB. Hotspots and termination shocks provide a direct measure of the jet energy deposited into the ISM. Multi-band analysis of the data at the same angular resolution can provide important insights to both particle acceleration and the energetics of the processes associated with jet feedback.
During the past few years the number of high redshift X-ray jets observed with Chandra has increased (e.g., Schwartz et al., 2020; Worrall et al., 2020; Snios et al., 2021). As noted in the previous section, at high redshift the photon energy density of the CMB is likely to exceed the magnetic field energy density and the inverse Compton process becomes the dominant X-ray radiation process in large scale jets. These high-z jets are faint, and, in typical short observations, Chandra could only detect a few counts. McKeough et al. (2016) studied X-ray emission from a number of radio knots and hotspots at z > 2. They applied a new MCMC multi-scale deconvolution method with the significance calculations for faint structures and found that there is a potential change in the X-ray–to–radio luminosity ratio for the jets at z > 3, suggesting either that the X-ray emission is a result of IC/CMB or that the higher redshift jets are physically different from low redshift ones.
Looking even further afield, the very recent Chandra detections of jets at the highest redshift (at z ≳ 6; Connor et al. 2021; Ighina et al. 2022) provide a powerful method for testing models of black hole growth. The luminous radio-loud quasars powering these jets require black holes with masses of ∼109 M☉ to be formed and generate relativistic jets by this redshift. With less than a billion years since the Big Bang to form and mature, these observations thus put constraints on the earliest black hole growth. These observations also indicate that the black holes are actively impacting the distant environment during the epoch of reionization!
Chandra's more than two decades of observations have initiated studies of large scale resolved X-ray jets. The available data is still sparse, but they tell us that the physical processes governing jet radiation and acceleration of ultra-relativistic particles are common and present at large distances from the jet’s origin near the supermassive black hole. X-rays provide important constraints on the theoretical understanding of the nature of these jets, their energy deposition, and their contribution to feedback that is key to the formation of the structures in the Universe.
References
Breiding, P., Meyer, E. T., Georganopoulos, M., et al. 2023, MNRAS, 518, 3222.
Celotti, A., Ghisellini, G., & Chiaberge, M. 2001, MNRAS, 321, L1.
Chartas, G., Worrall, D. M., Birkinshaw, M., et al. 2000, ApJ, 542, 655.
Connor, T., Bañados, E., Stern, D., et al. 2021, ApJ, 911, 120.
Daly, R. A. 2016, MNRAS, 458, L24.
Dermer, C. D. 1995, ApJL, 446, L63.
Elvis, M., & Fabbiano, G. 1984, ApJ, 280, 91.
Fabian, A. C., Walker, S. A., Celotti, A., et al. 2014, MNRAS, 442, L81.
Fanaroff, B. L., & Riley, J. M. 1974, MNRAS, 167, 31P.
Godfrey, L. E. H., Lovell, J. E. J., Burke-Spolaor, S., et al. 2012, ApJL, 758, L27.
Hardcastle, M. J., Lenc, E., Birkinshaw, M., et al. 2016, MNRAS, 455, 3526.
Harris, D. E., Lee, N. P., Schwartz, D. A., et al. 2017, ApJ, 846, 119.
Ighina, L., Moretti, A., Tavecchio, F., et al. 2022, A&A, 659, A93.
Jester, S., Harris, D. E., Marshall, H. L., et al. 2006, ApJ, 648, 900.
Jolley, E. J. D., & Kuncic, Z. 2008, MNRAS, 386, 989.
Kappes, A., Burd, P. R., Kadler, M., et al. 2022, A&A, 663, A44.
Marshall, H. L., Gelbord, J. M., Schwartz, D. A., et al. 2011, ApJS, 193, 15.
Marshall, H. L., Schwartz, D. A., Lovell, J. E. J., et al. 2005, ApJS, 156, 13.
Marshall, H. L., Hardcastle, M. J., Birkinshaw, M., et al. 2010, ApJL, 714, L213.
Marshall, H. L., Gelbord, J. M., Worrall, D. M., et al. 2018, ApJ, 856, 66.
McKeough, K., Siemiginowska, A., Cheung, C. C., et al. 2016, ApJ, 833, 123.
Meyer, E. T., Breiding, P., Georganopoulos, M., et al. 2017, ApJL, 835, L35.
Migliori, G., Orienti, M., Coccato, L., et al. 2020, MNRAS, 495, 1593.
Migliori, G., Siemiginowska, A., Cheung, C. C., et al. 2022, MNRAS, 512, 4639.
Reddy, K., Georganopoulos, M., & Meyer, E. T. 2021, ApJS, 253, 37.
Reddy, K., Georganopoulos, M., Meyer, E. T., et al. 2023, ApJS, 265, 8.
Sambruna, R. M., Maraschi, L., Tavecchio, F., et al. 2002, ApJ, 571, 206.
Sambruna, R. M., Gambill, J. K., Maraschi, L., et al. 2004, ApJ, 608, 698.
Schwartz, D. A., Marshall, H. L., Lovell, J. E. J., et al. 2000, ApJL, 540, 69.
Schwartz, D. A. 2002, ApJL, 569, L23.
Schwartz, D. A., Siemiginowska, A., Snios, B., et al. 2020, ApJ, 904, 57.
Siemiginowska, A., Stawarz, Ł., Cheung, C. C., et al. 2007, ApJ, 657, 145.
Simionescu, A., Stawarz, Ł., Ichinohe, Y., et al. 2016, ApJL, 816, L15.
Snios, B., Schwartz, D. A., Siemiginowska, A., et al. 2021, ApJ, 914, 130.
Stawarz, Ł., & Ostrowski, M. 2002, ApJ, 578, 763.
Stawarz, Ł., Sikora, M., Ostrowski, M., et al. 2004, ApJ, 608, 95.
Tavecchio, F., Maraschi, L., Sambruna, R. M., et al. 2000, ApJL, 544, L23.
Thimmappa, R., Stawarz, Ł., Marchenko, V., et al. 2020, ApJ, 903, 109.
Thimmappa, R., Stawarz, Ł., Neilsen, J., et al. 2022, ApJ, 941, 204.
Tingay, S. J., Murphy, D. W., Lovell, J. E. J., et al. 1998, ApJ, 497, 594.
Tingay, S. J., Jauncey, D. L., Reynolds, J. E., et al. 2000, Advances in Space Research, 26, 677.
Wood, K. S., Meekins, J. F., Yentis, D. J., et al. 1984, ApJS, 56, 507.
Worrall, D. M., Birkinshaw, M., Marshall, H. L., et al. 2020, MNRAS, 497, 988.
Yaqoob, T., George, I. M., Turner, T. J., et al. 1998, ApJL, 505, L87.
- For electrons, the Lorentz factor is defined as γ = E/(mc2). We also define the bulk Lorentz factor, Γ=(1 − v2/c2)−1/2 where v is the velocity of the jet relative to the cosmic microwave background frame.
- https://hea-www.harvard.edu/XJET/
- https://astro.umbc.edu/Atlas-X/
- Following the classification scheme of Fanaroff & Riley (1974), an FRII source is one where there are hotspots at the ends of its lobes.