Last Updated: 2018-Feb-07

Chandra | Cal | HRC

Degap Update for HRC-S2

$CALDB/data/chandra/hrc/gaplookup/hrcsD1999-07-22gaplookupN0004.fits

Vinay Kashyap


Summary

The HRC-S degap update of 2012 (Juda 2012) that was designed to improve the imaging performance near the aimpoint of the HRC-S had a small residual offset in the locations of photons near the aimpoint (see Kashyap 2012).

Measurements of proper-motion corrected positions for AR Lac and HZ 43 show that the sources are offset by ~0.5 arcsec along the dispersion direction in the HRC-S, significantly higher than the ~0.1-0.2 arcsec offsets seen in the HRC-I (see Figure 1). This corresponds to an excess pixel shift of ~2-4 pix in the HRC-S. Similarly, measurements of spectral line wavelengths in dispersed +ve and -ve orders obtained with LETGS+HRC-S show a shift of 0.023-0.04 Ang (see Figure 2), approximately 1/3 of the FWHM. A shift of 2-4 pix in the location of the zeroth order is capable of inducing such an offset. These measurements suggest that a shift was induced in the 2012 degap.

We have added a shift of +2.5 pixels (approximately 0.018 Ang) to all degap corrections between CRSV=95 to CRSV=102 (see Fig 3). The updated degapping solution ameliorates the wavelength shift as seen from tests run on Capella LETGS+HRC-S observations (Fig 4).

Consequences

1. Source positions
a. Applying this degap will shift the positions of sources observed near the HRC-S aimpoint by approximately 0.3 arcsec. This is of the same order of magnitude as uncertainties in aspect reconstruction, but manifests as a systematic shift in the source locations.
b. The same consideration as 1.a also applies to zeroth order positions of LETGS+HRC-S observations.
2. Wavelengths
a. Shifting the zeroth order position negates the wavelength shift that was seen after applying the 2012 degap. It is recommended that all analyses that seek to combine or compare +ve and -ve dispersed orders, especially where line profiles are analyzed, reprocess their data using the new degap file.

Figure 1: Source offsets attributable to degap bias near aimpoint observations. A shift of approximately -0.5 arcsec, with a possible systematic uncertainty of ~0.1 arcsec, is consistently seen in HRC-S, corresponding to approximately 3.8 (~0.8) pixels.

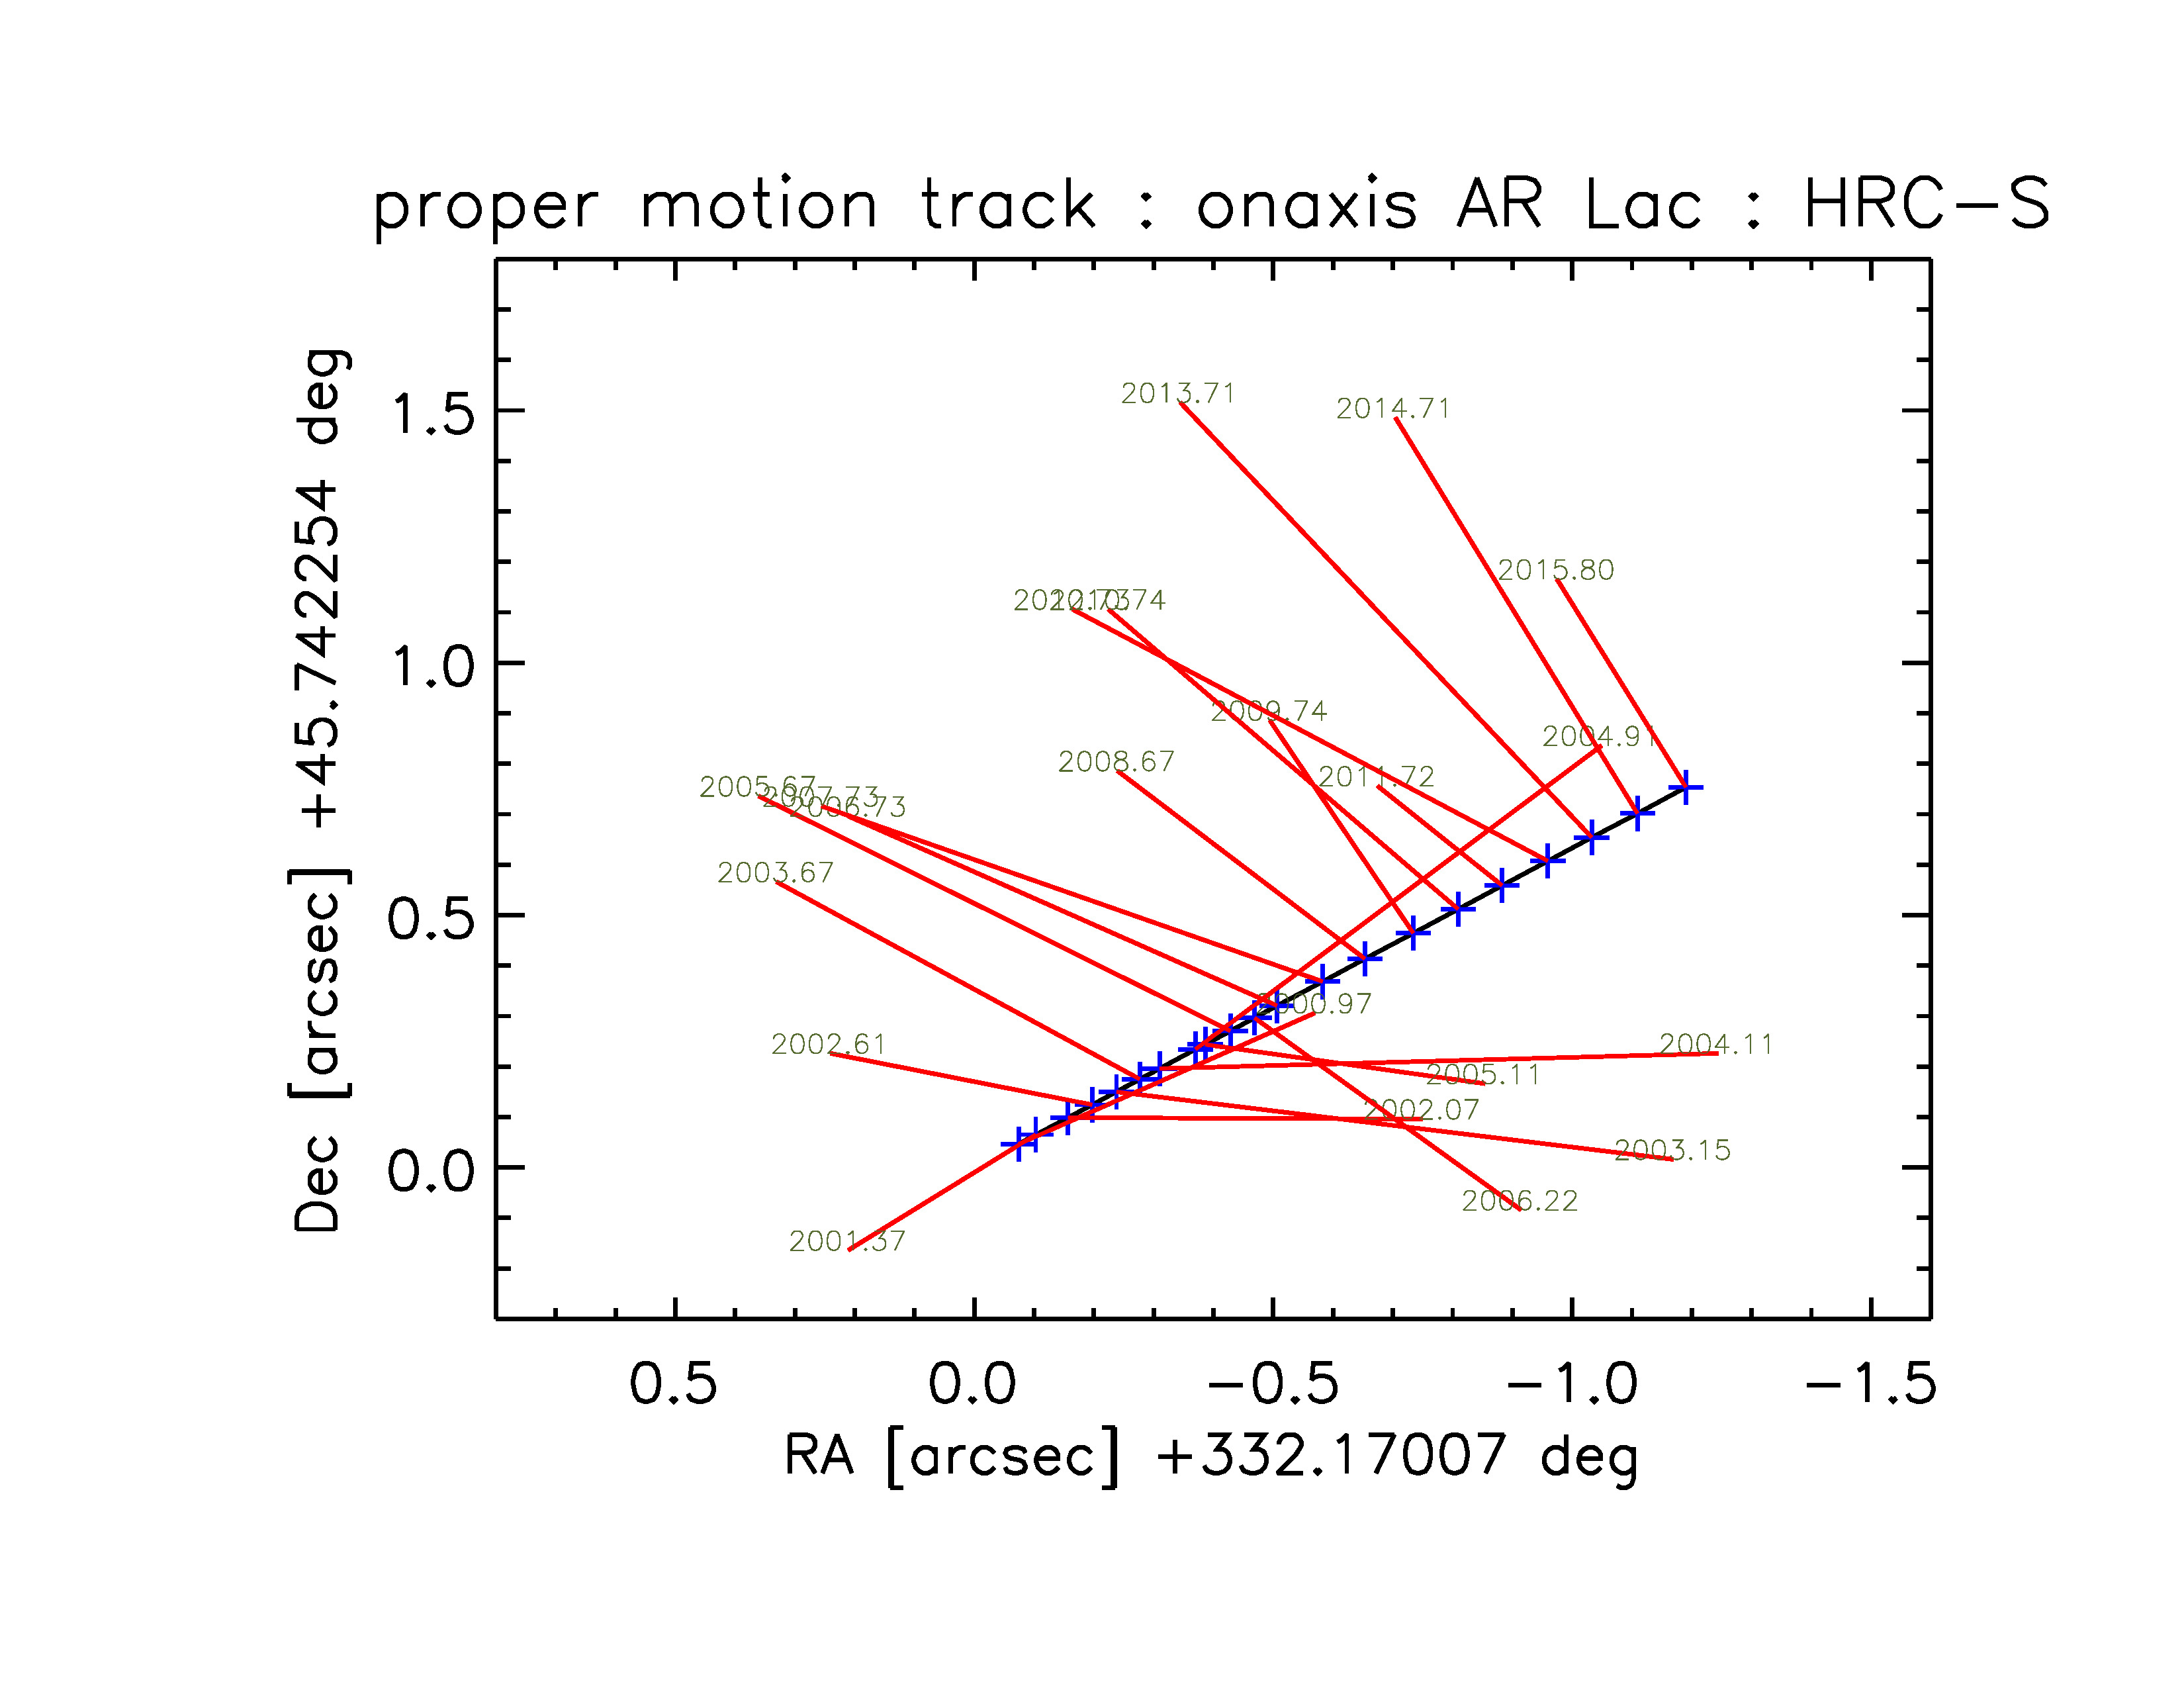
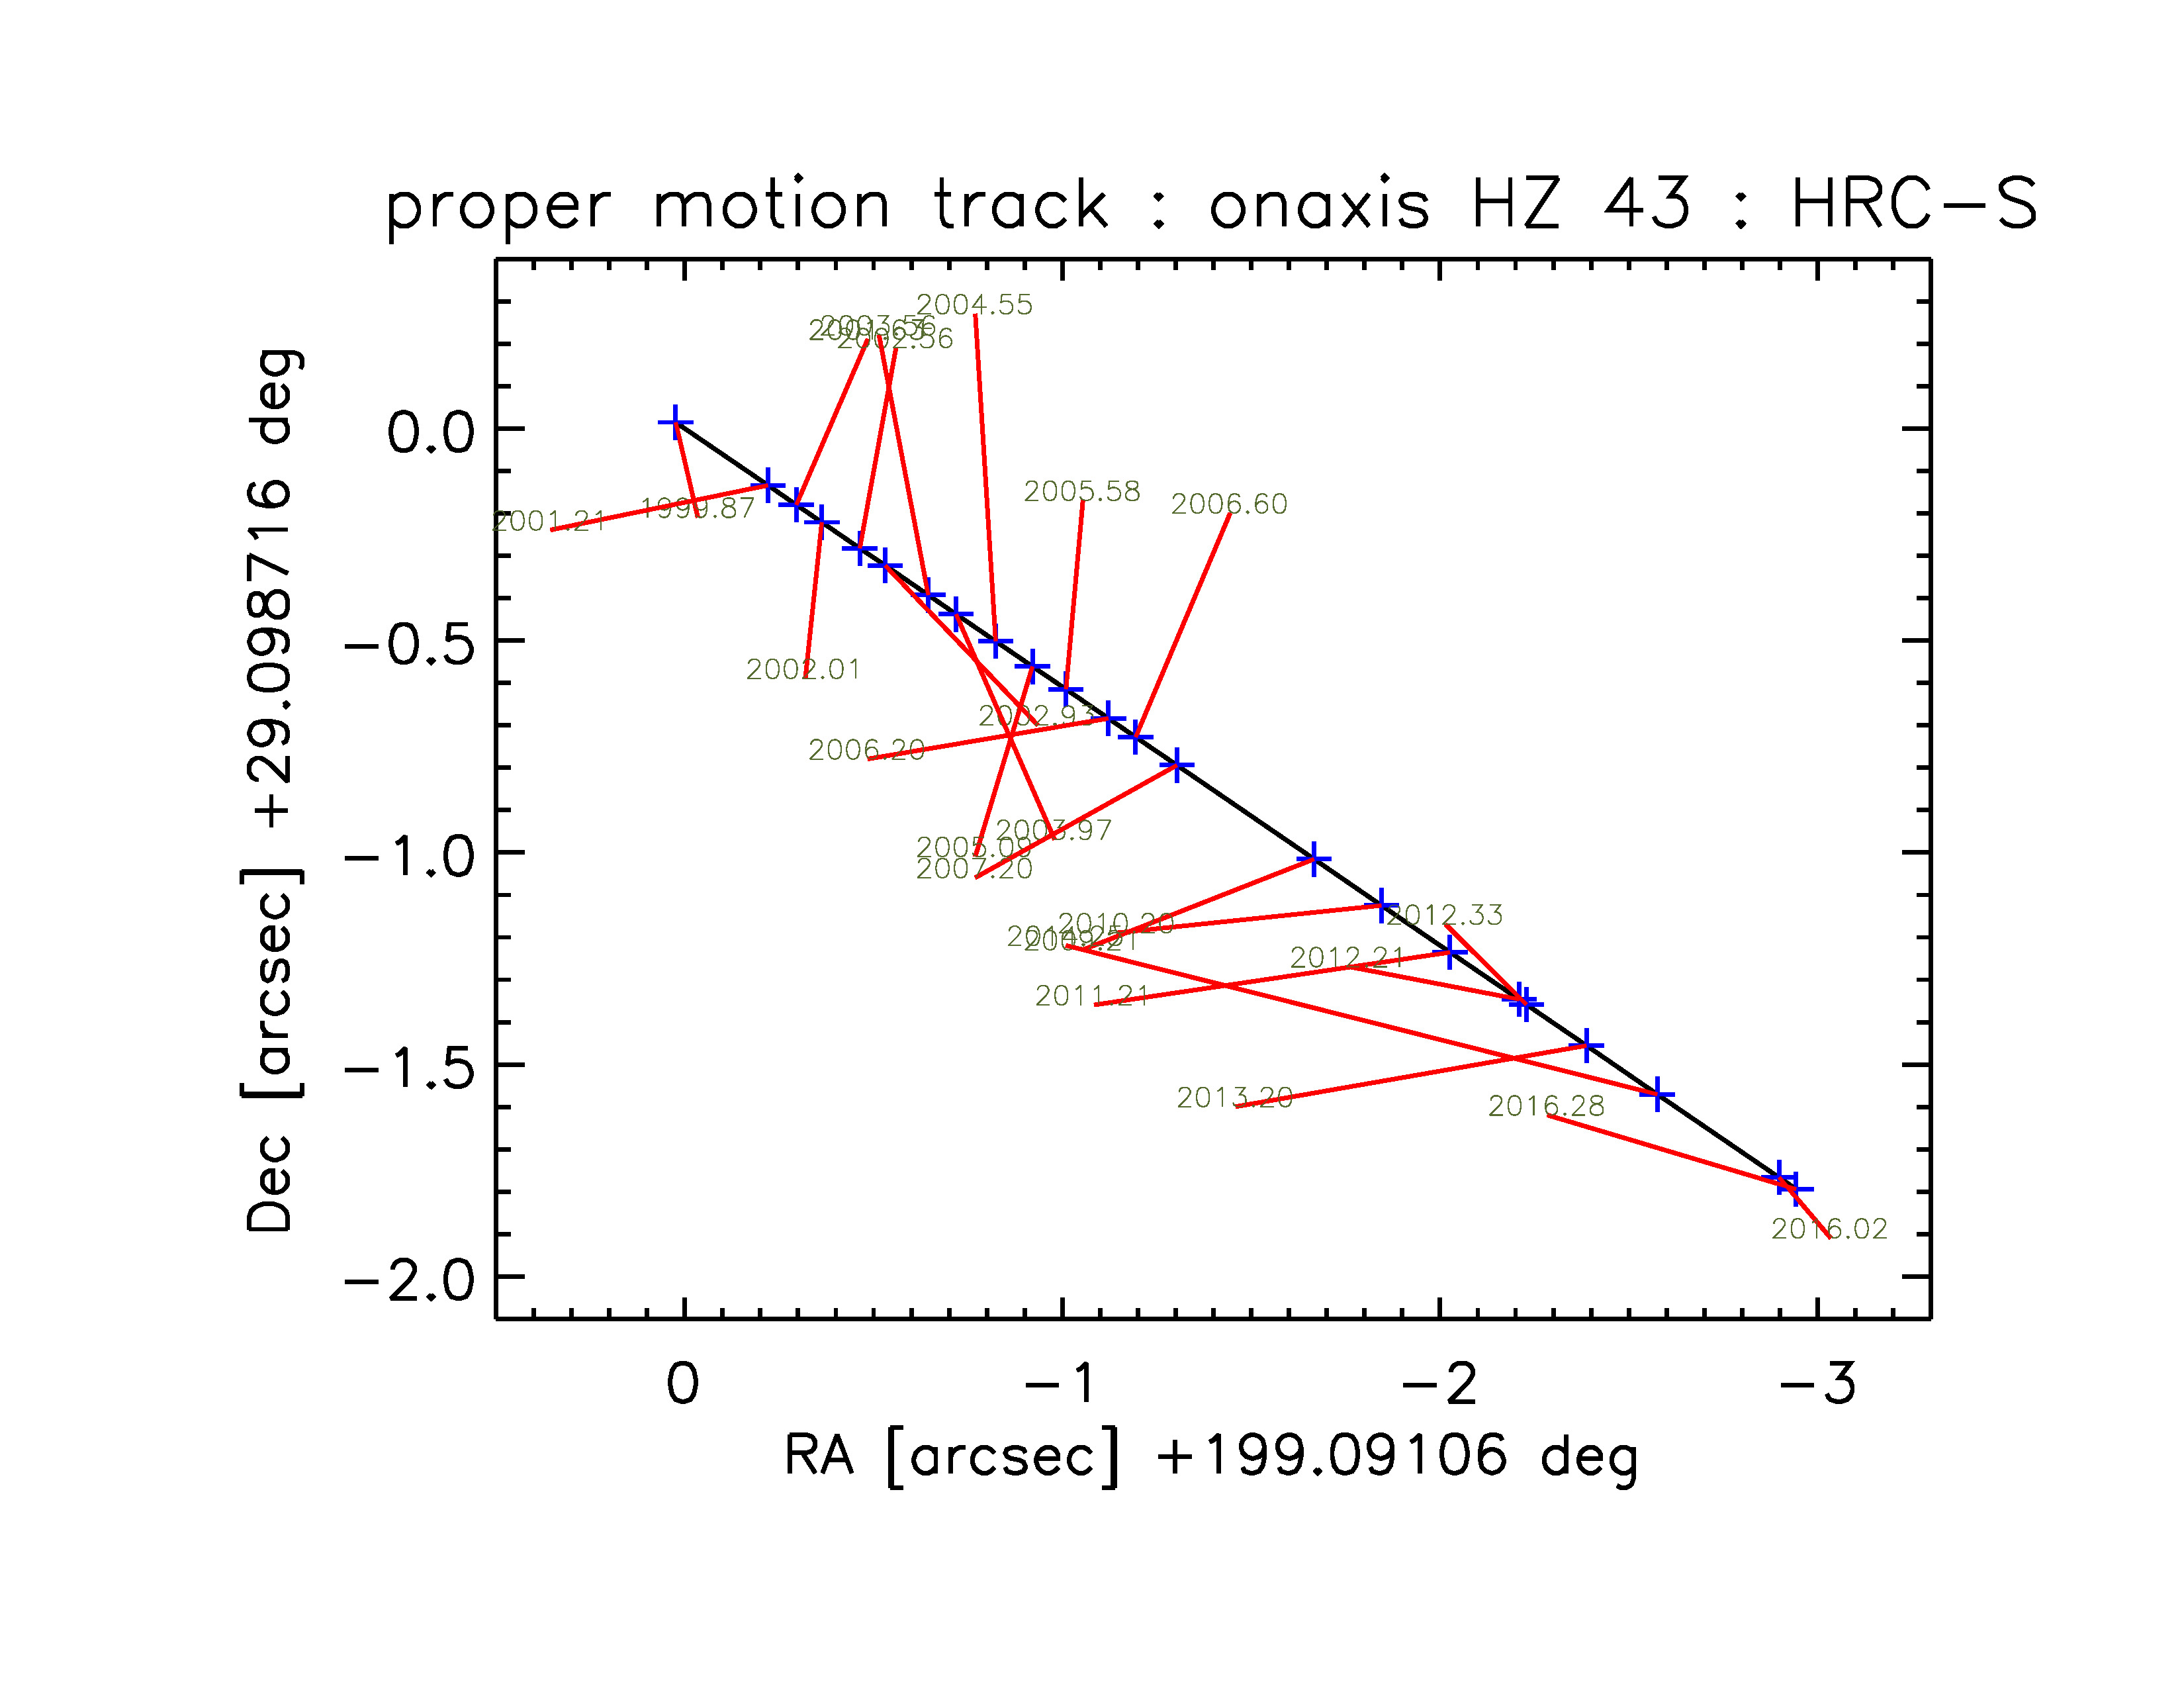
A. Track of AR Lac observed with HRC-S. The expected locations, corrected for proper motion, are shown as blue `+'s on a straight line. The actual locations are at the other ends of the red line segments that connect to the expected locations, and are marked with the epoch of the observation.

Track of AR Lac observed with HRC-S

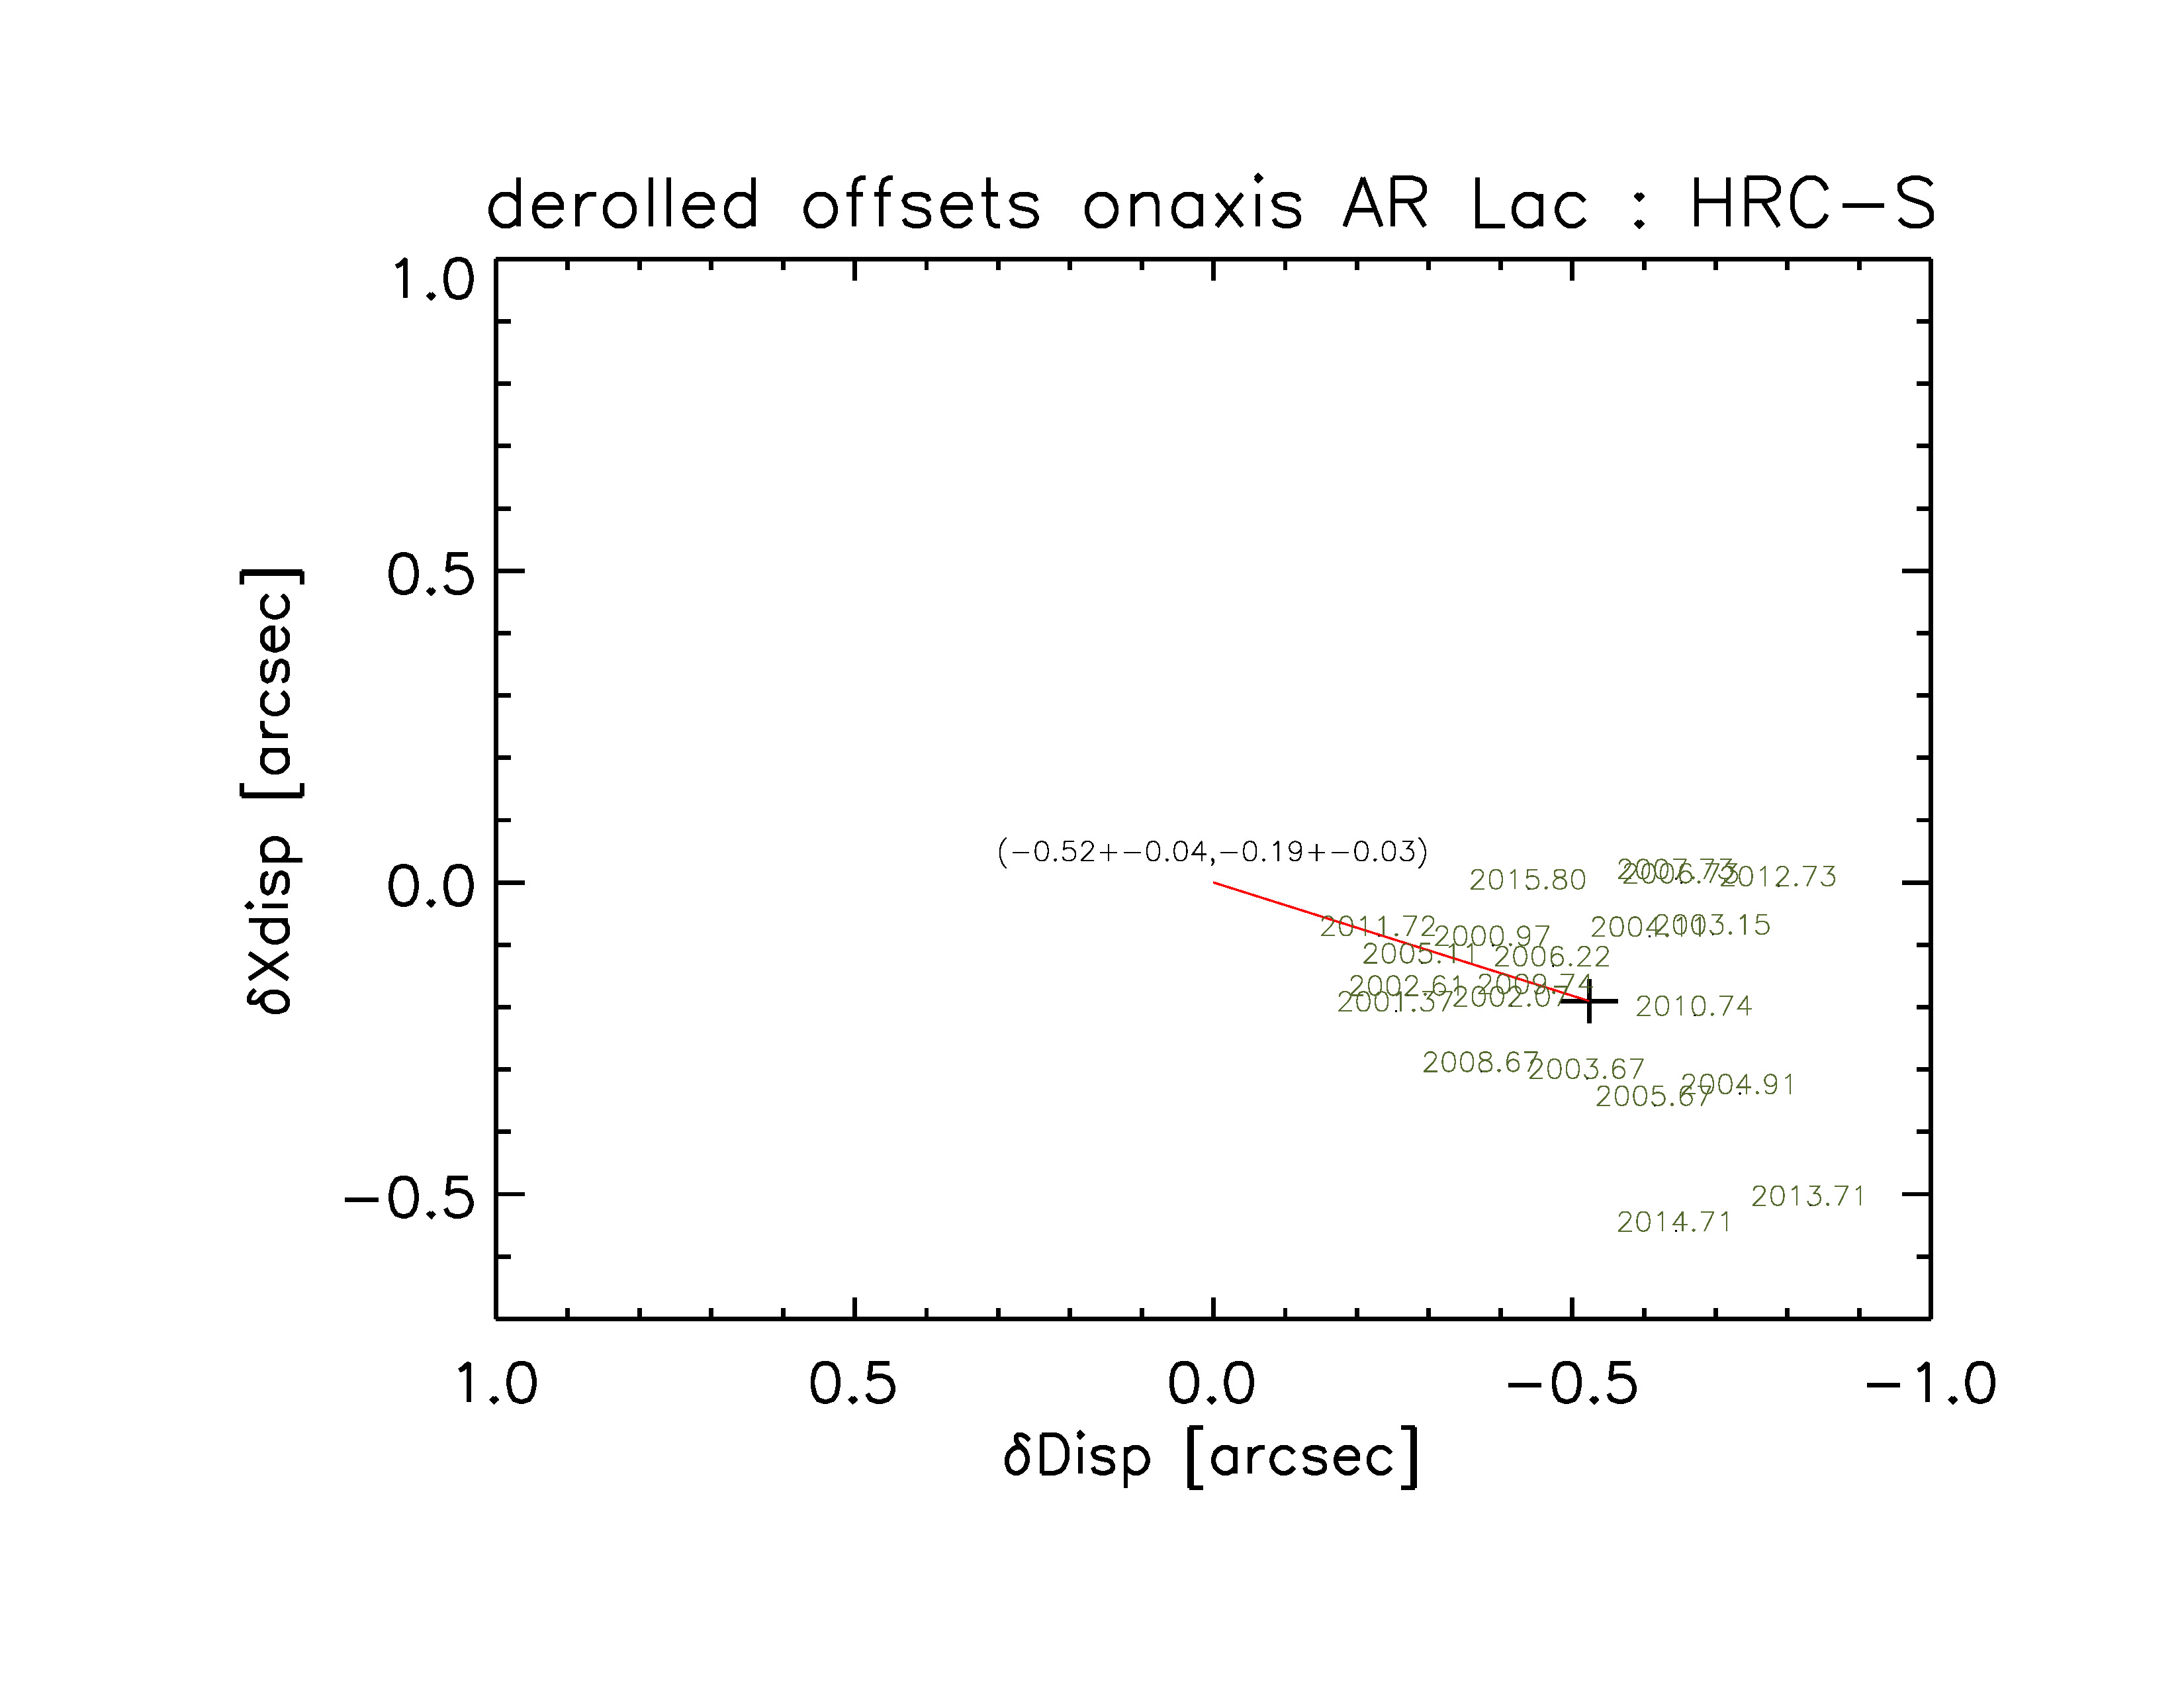
B. HRC-S/AR Lac position residuals. The difference between the expected and observed source locations is shown in derolled coordinates, with the X-axis corresponding to the dispersion axis and the Y-axis corresponding to the cross-dispersion axis. The `+' sign shows the average location based on all the observations (marked by their epochs), with a red line segment connecting it to the nominal location of (0,0). The offset is measured as -0.52±0.04 along the dispersion directon, and -0.18±0.03 in the cross-dispersion direction.

HRC-S/AR Lac position residuals

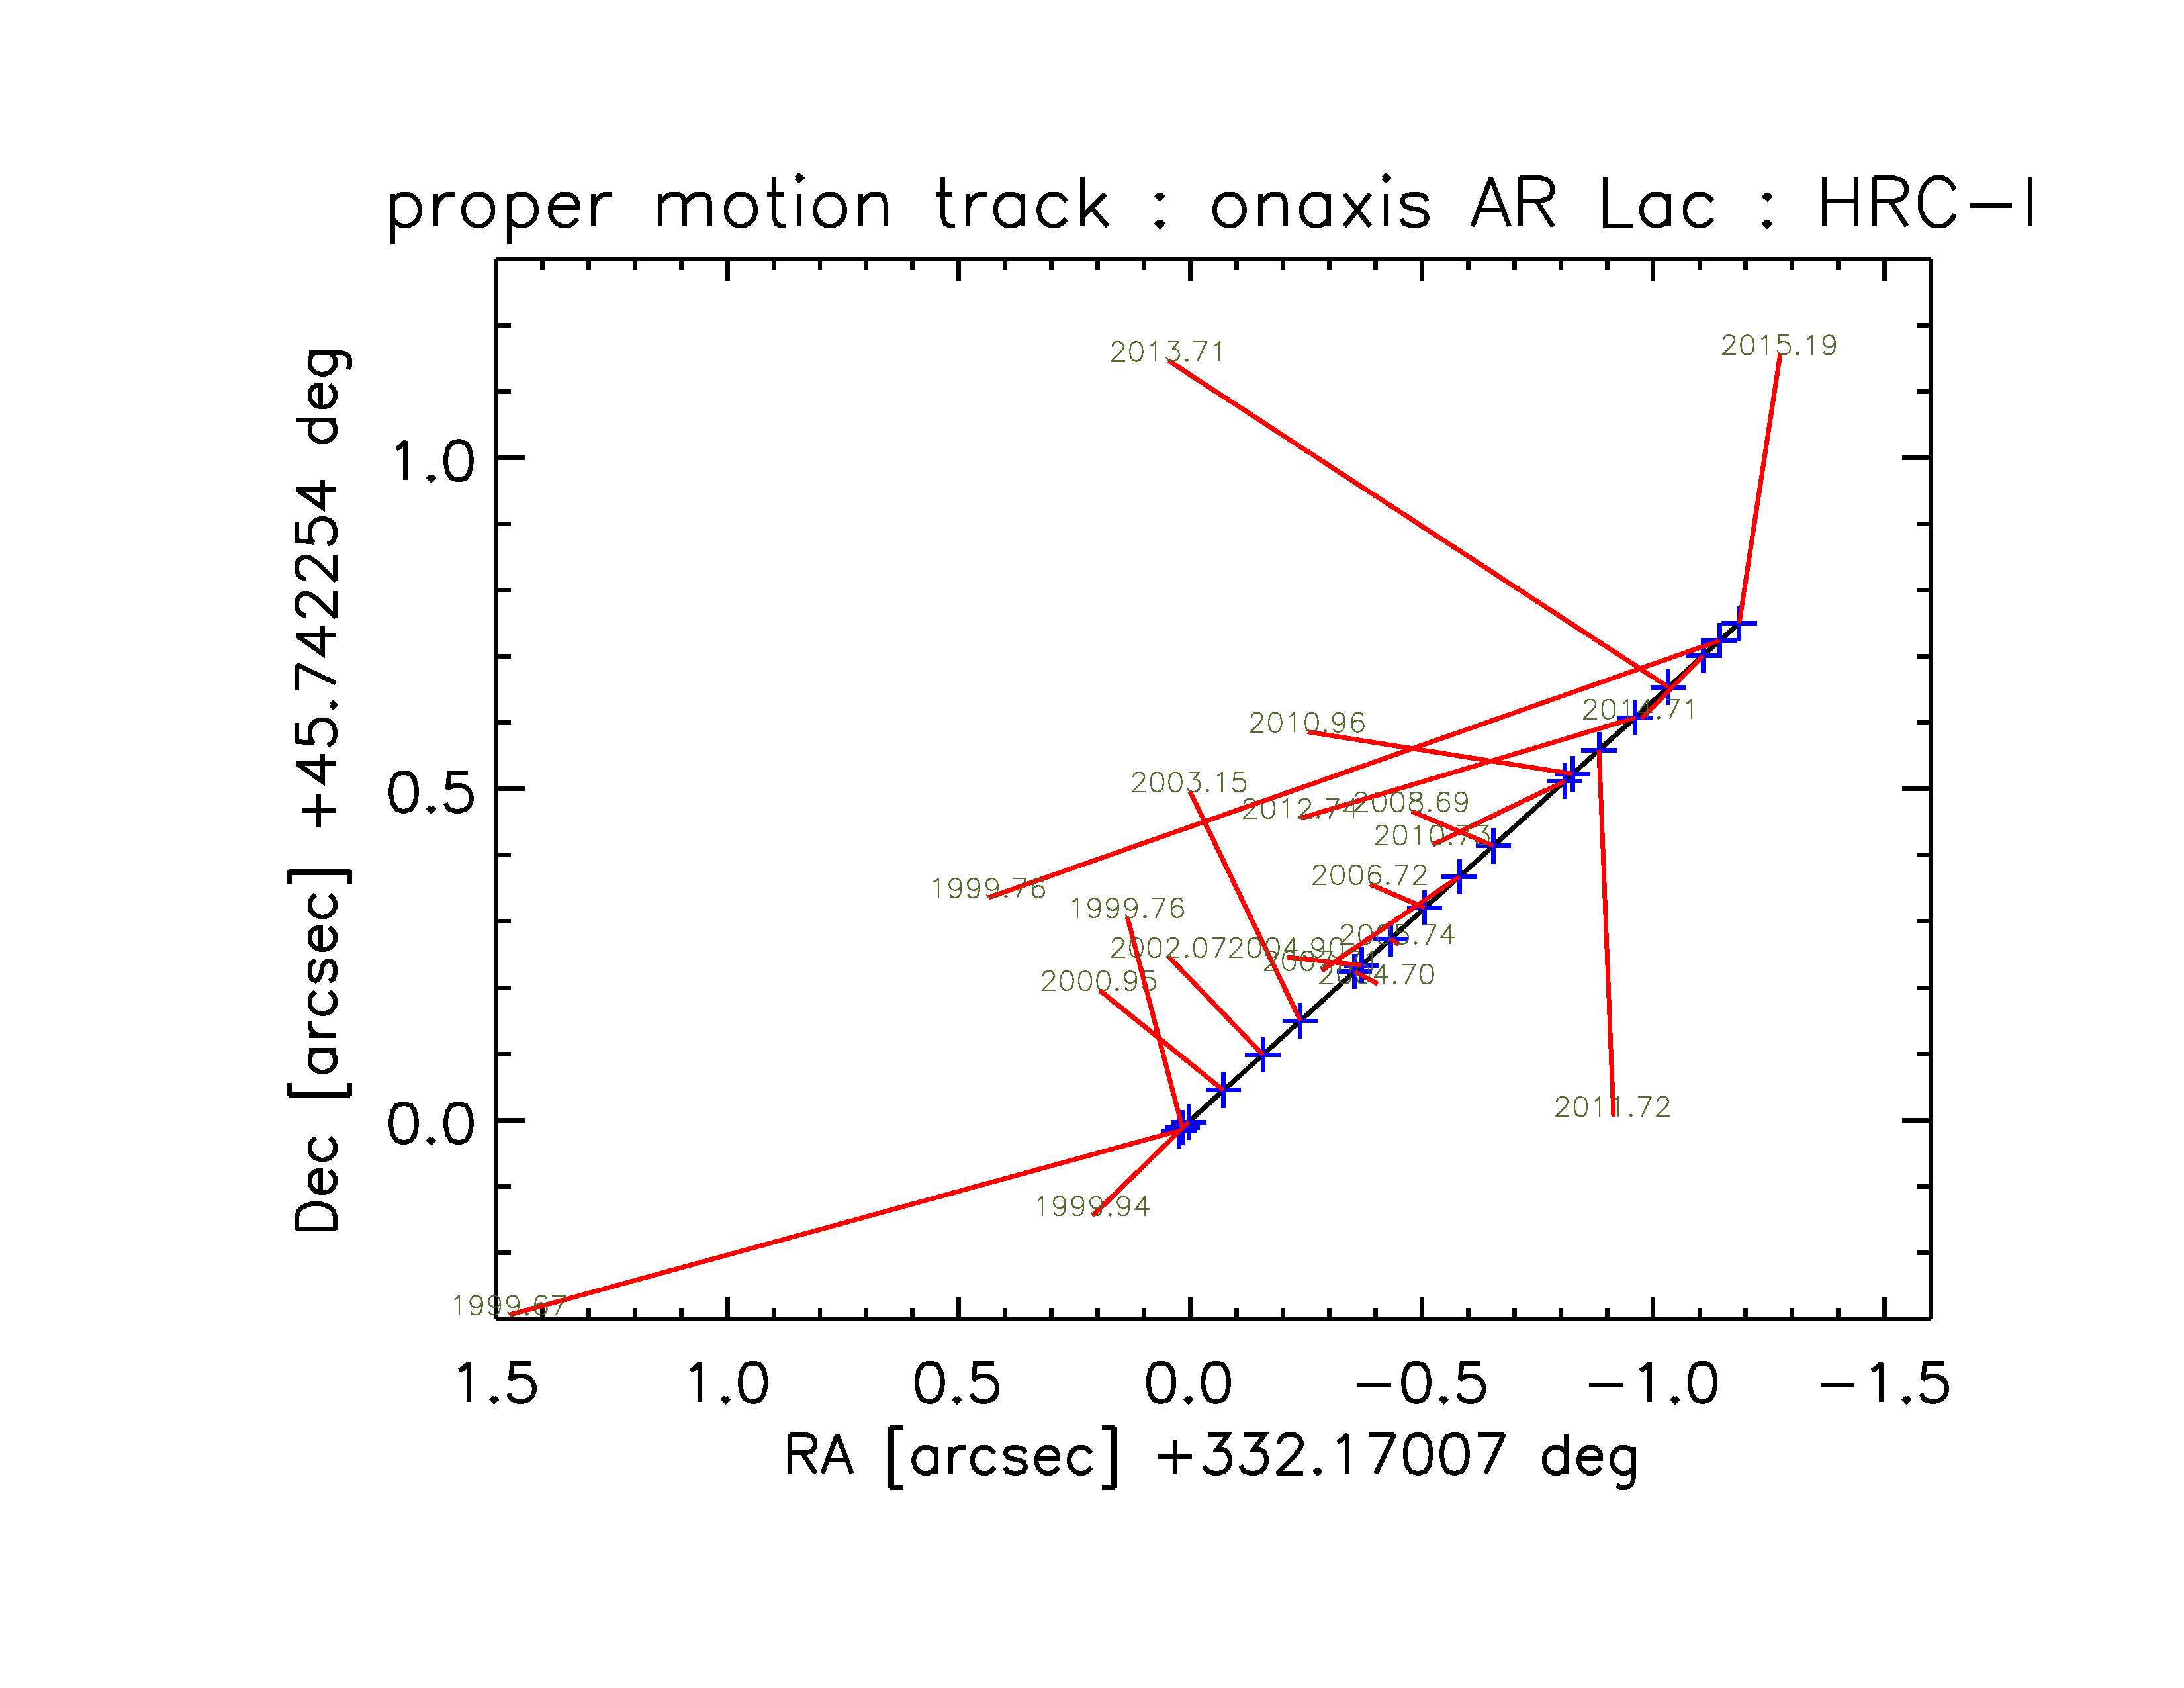
C. As in 1.A, showing the track of AR Lac observed with HRC-I

Track of AR Lac observed with HRC-I

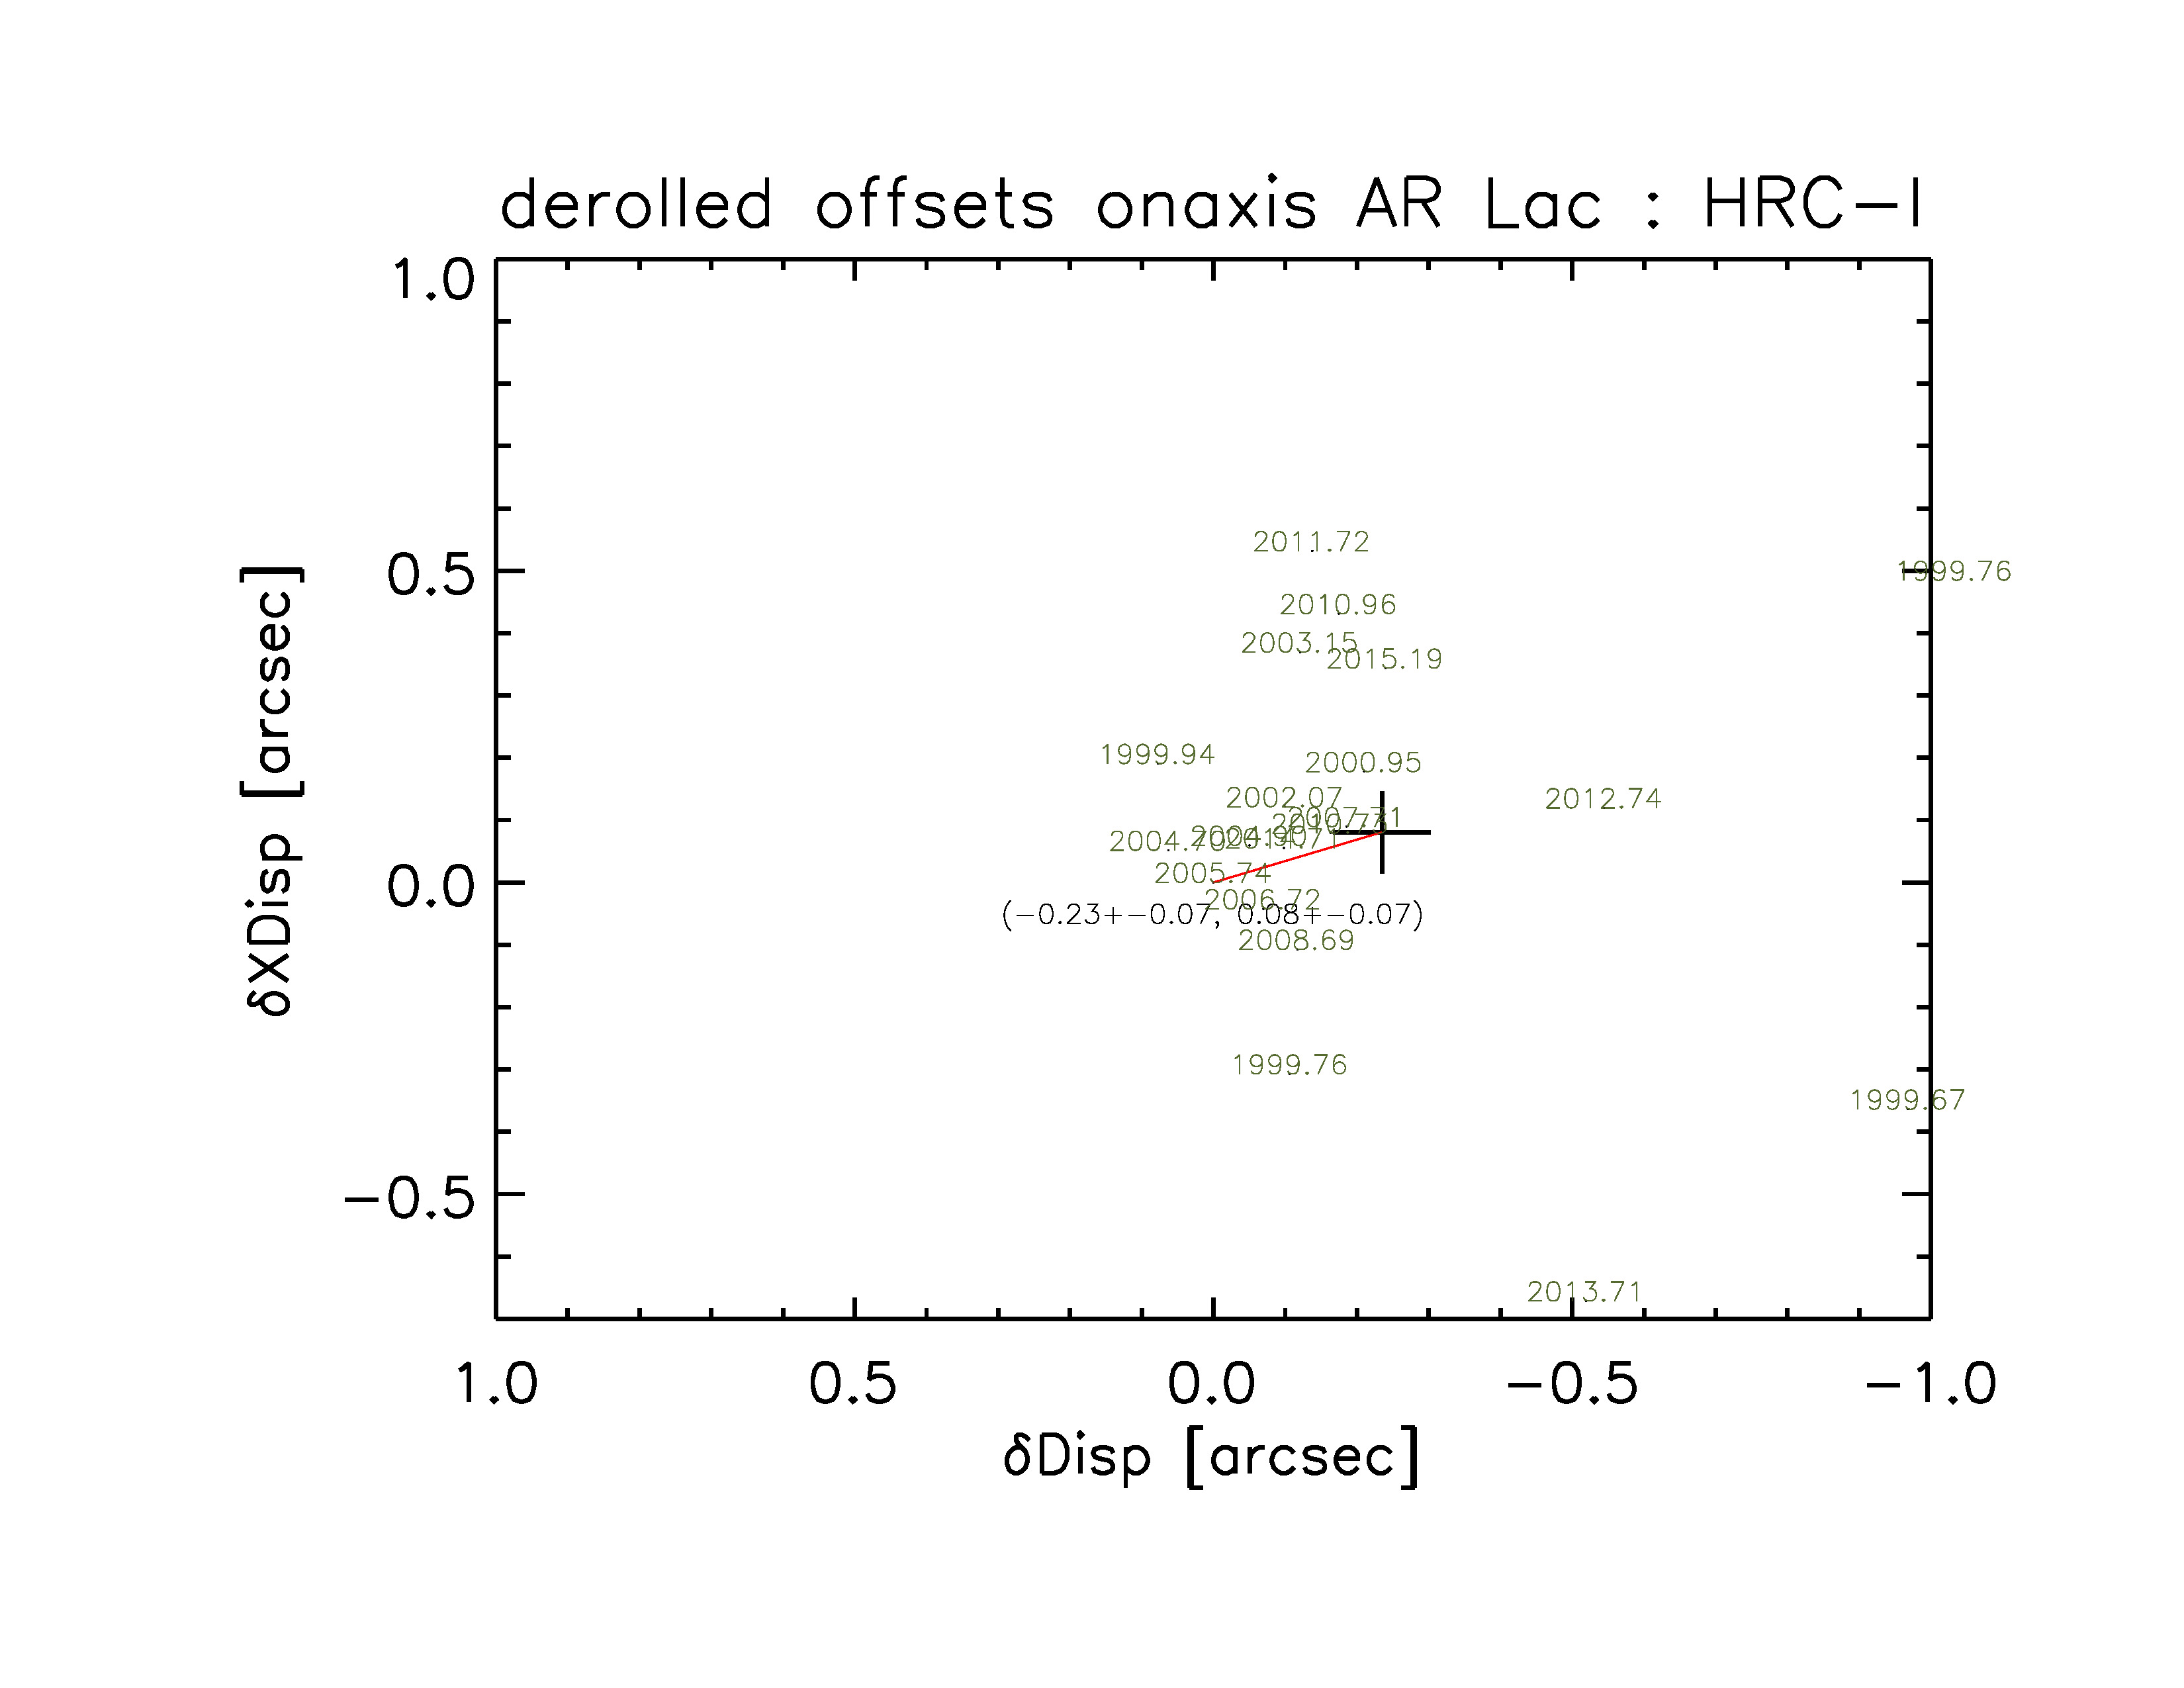
D. As in 1.B, for HRC-I/AR Lac position residuals. The offset is measured to be -0.23±0.07 (disp) and 0.08±0.07 (xdisp).

HRC-I/AR Lac position residuals

E. As in 1.A, showing the track of HZ 43 observed with HRC-S

Track of HZ 43 observed with HRC-S

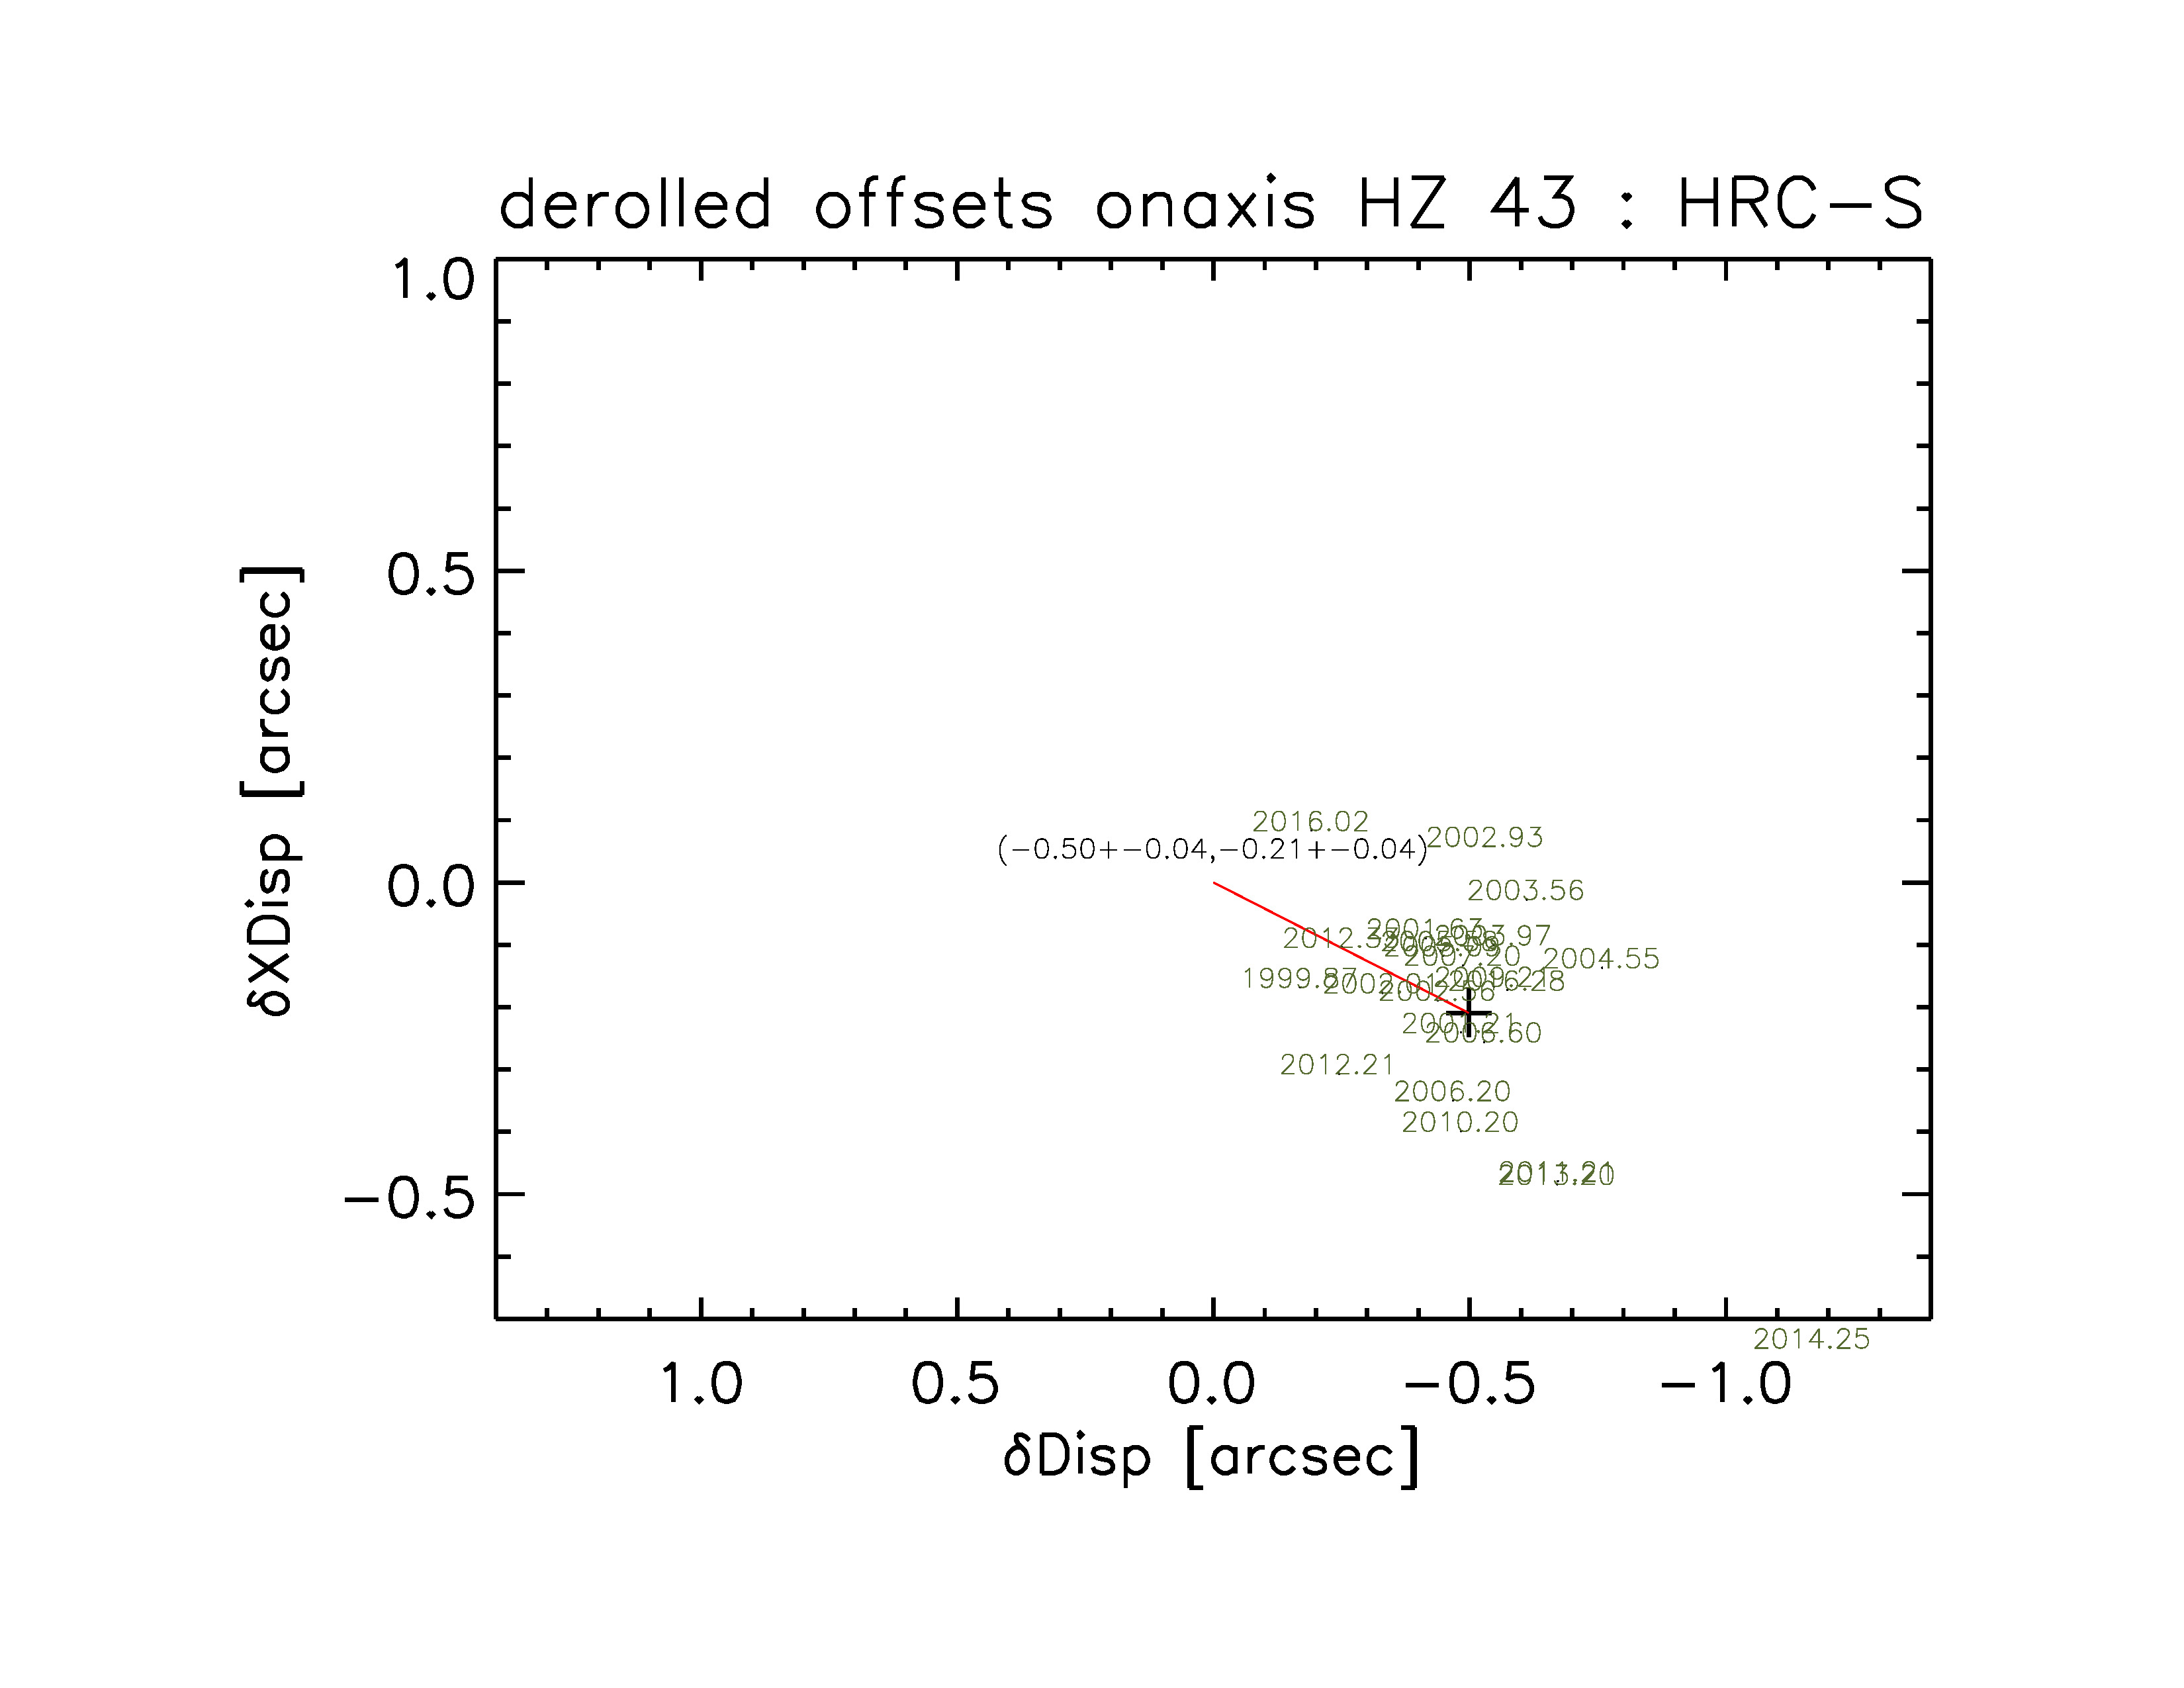
F. As in 1.B, for HRC-S/HZ 43 position residuals. The offset is measured to be -0.5±0.04 (disp) and -0.21±0.04 (xdisp).

HRC-S/HZ 43 position residuals

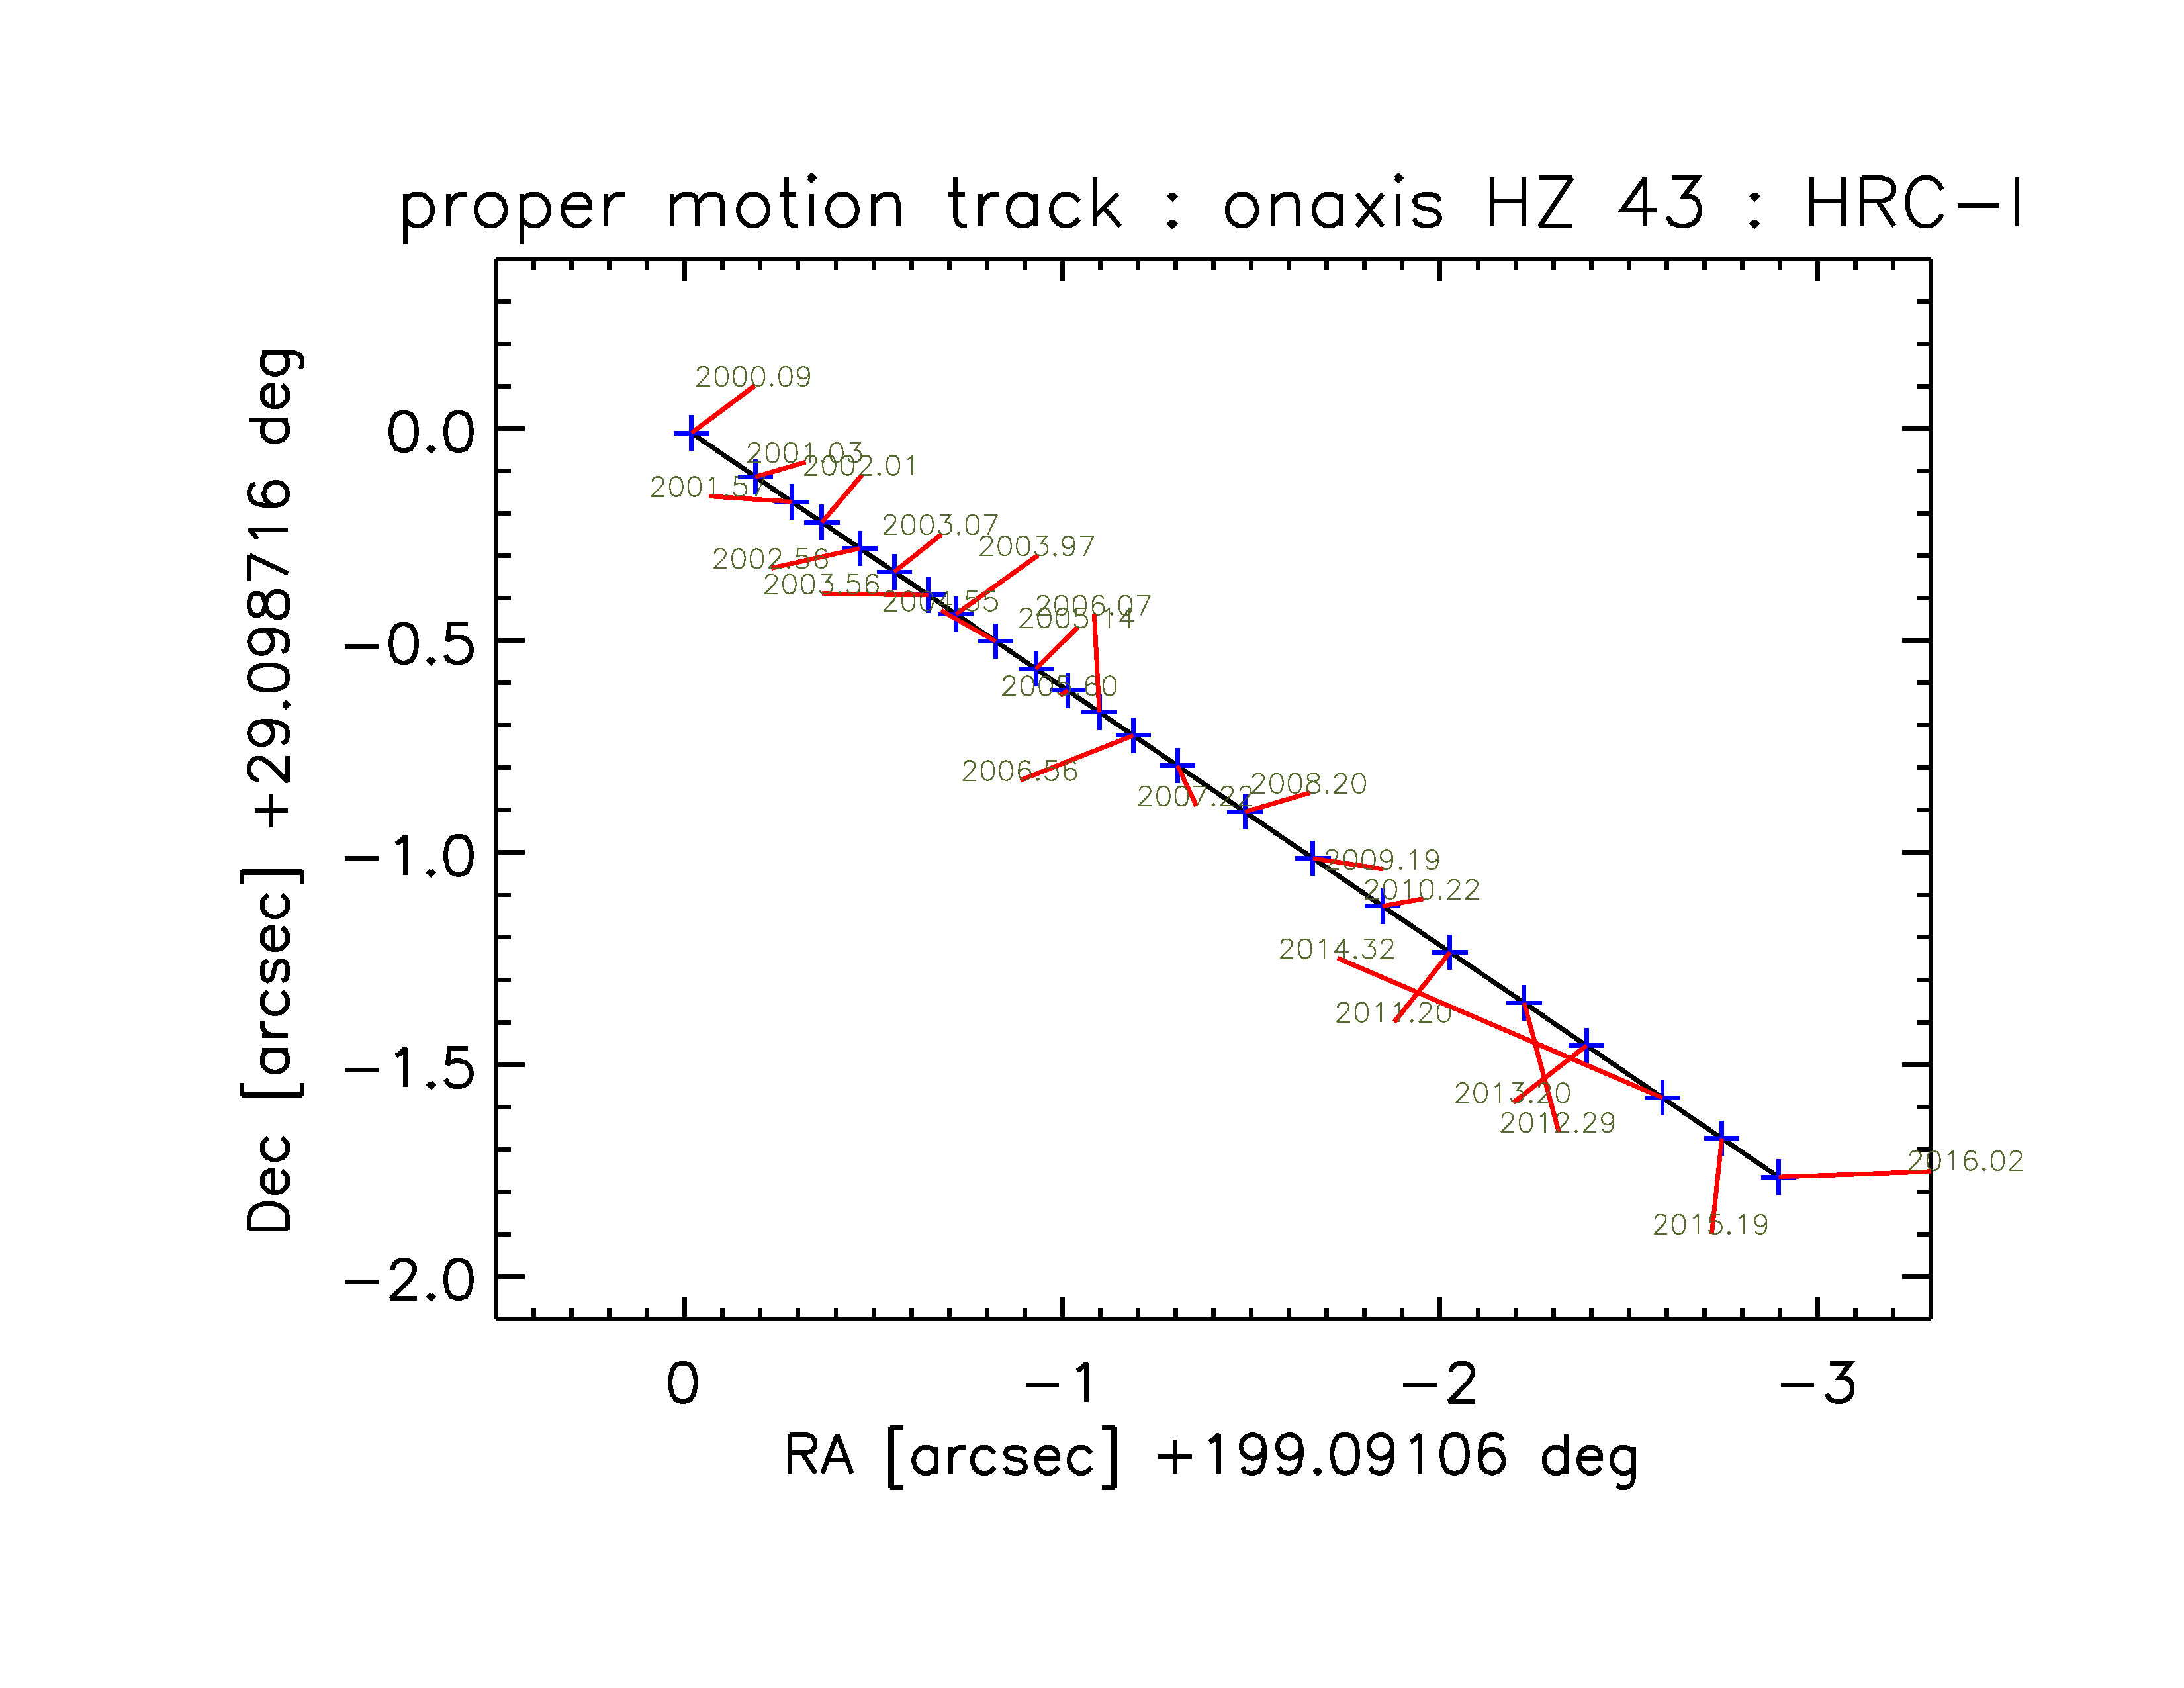
G. As in 1.A, showing the track of HZ 43 observed with HRC-I

Track of HZ 43 observed with HRC-I

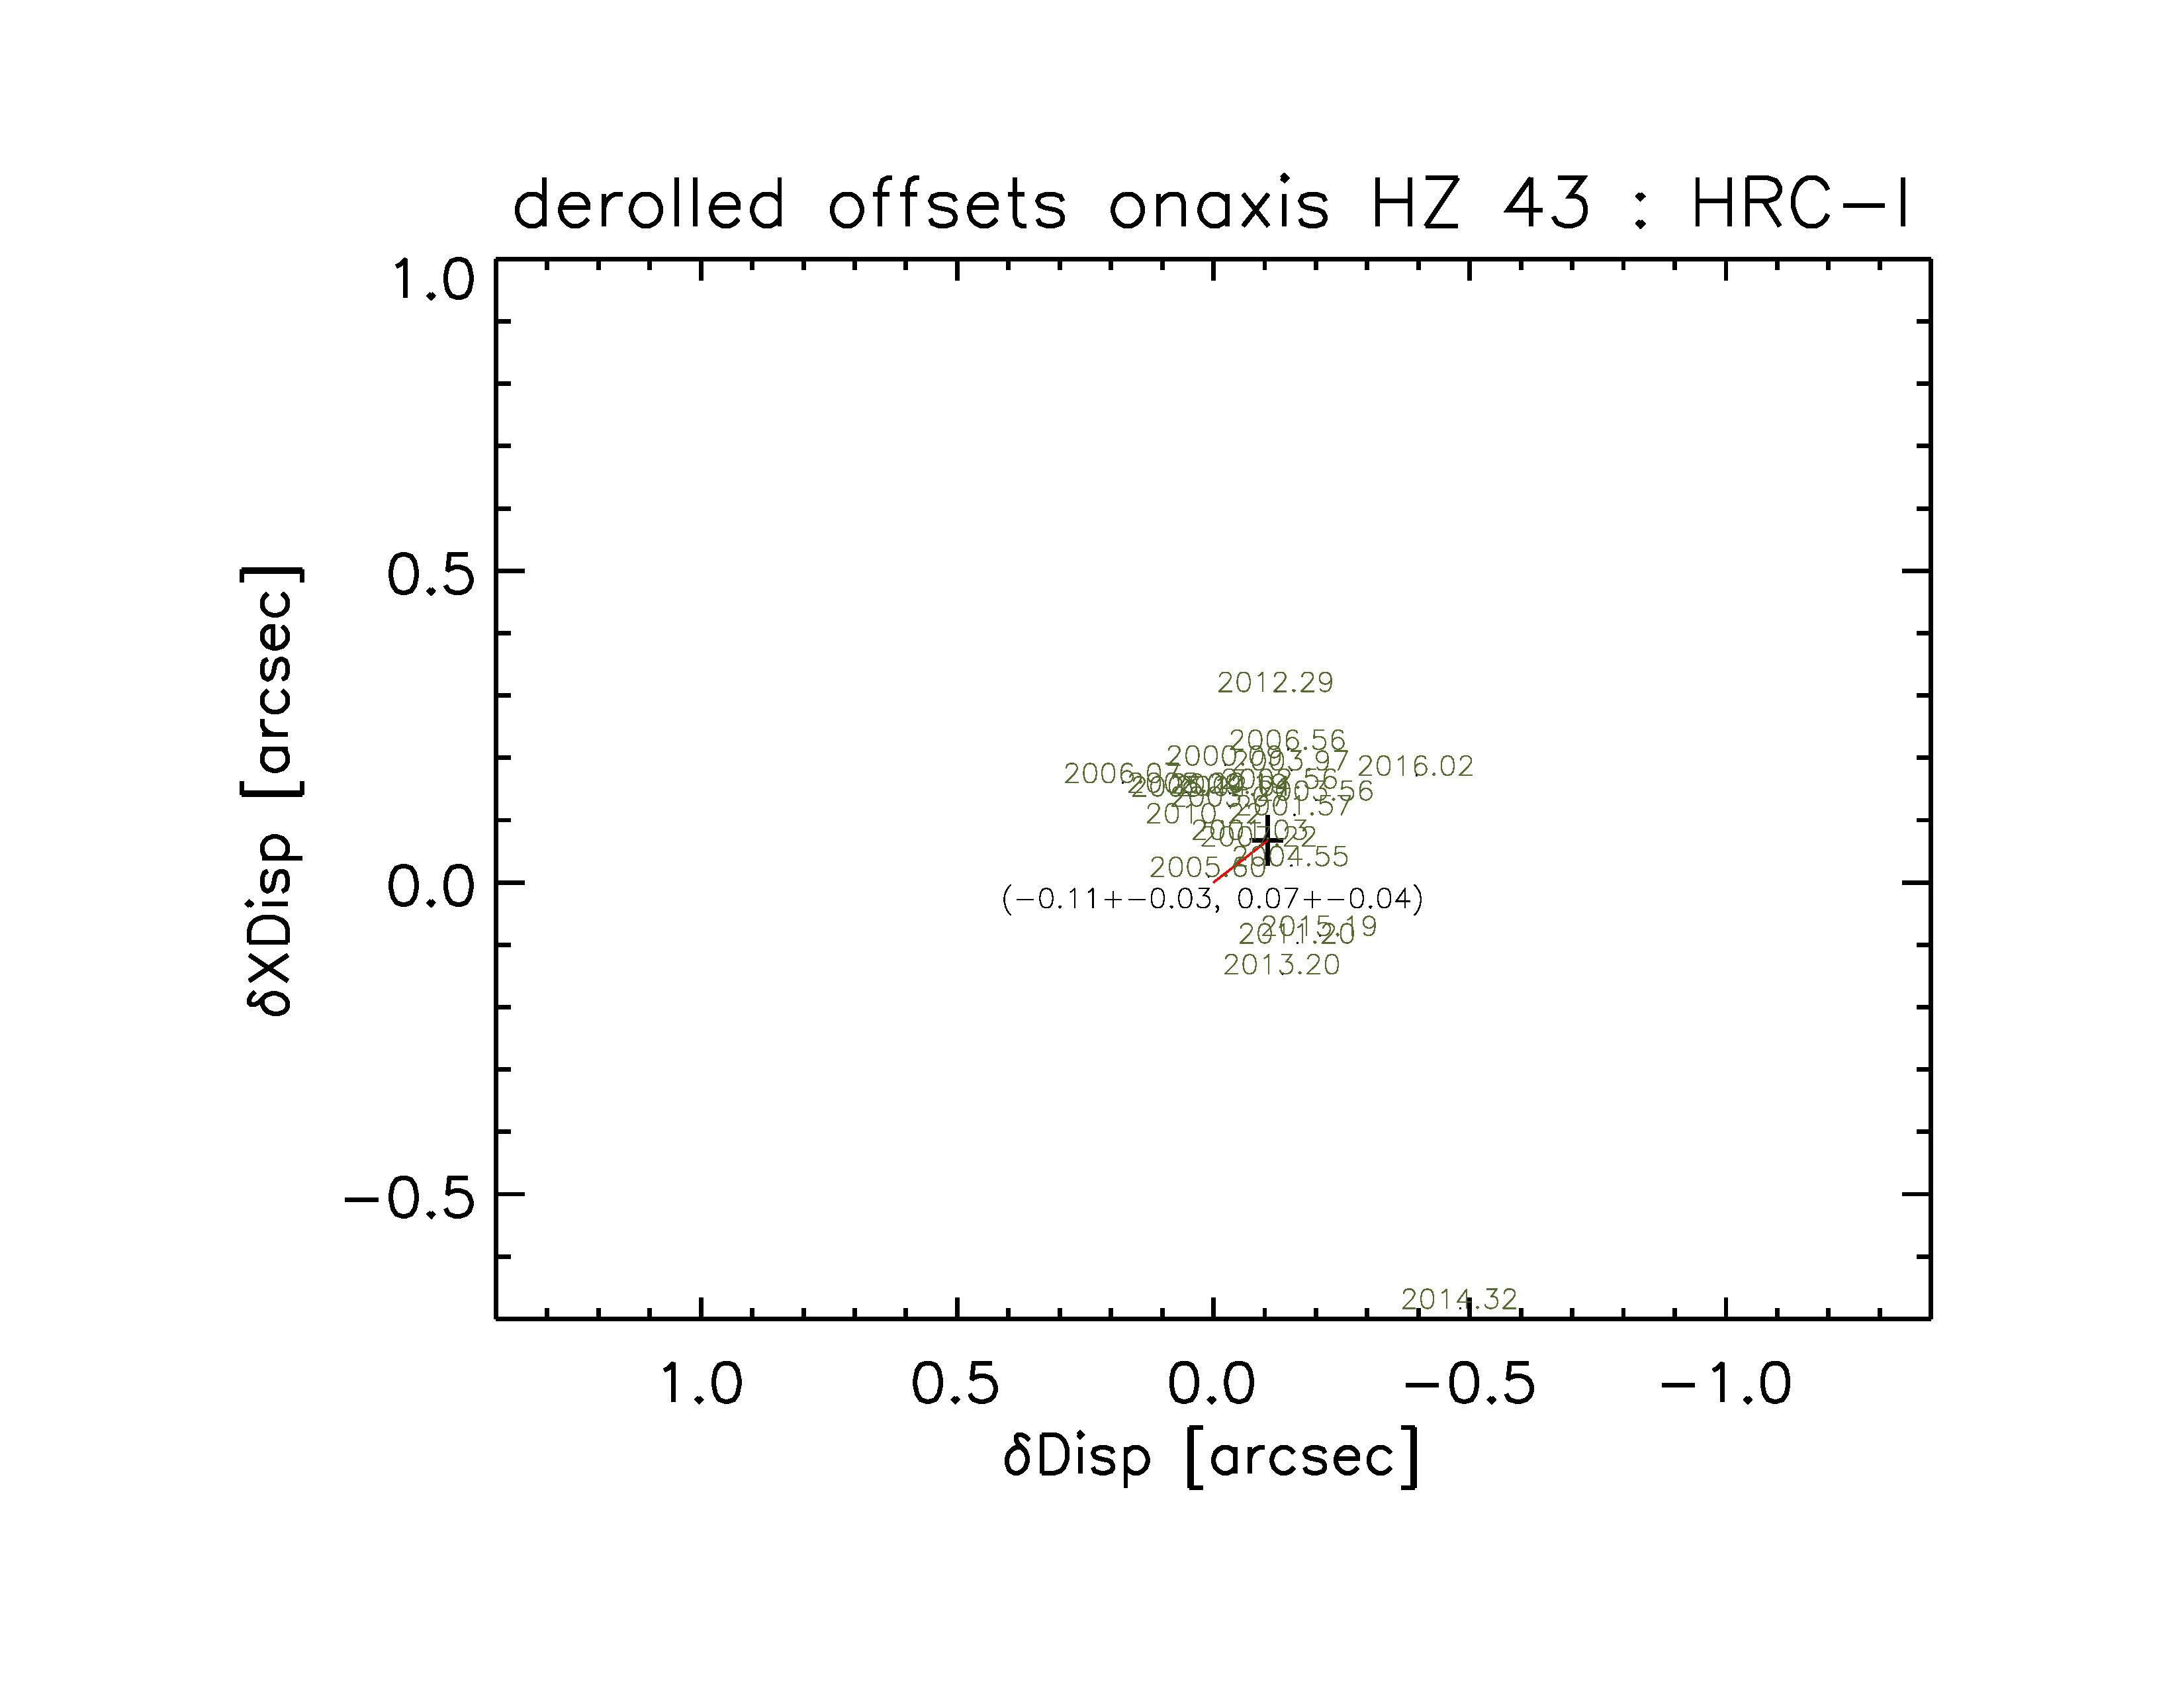
H. As in 1.B, for HRC-I/HZ 43 position residuals. The offset is measured to be -0.11±0.03 (disp) and -0.07±0.04 (xdisp).

HRC-I/HZ 43 position residuals


Figure 2: Measured shifts between lines seen in the -ve and +ve orders for a variety of strong lines in numerous observations of coronal sources. The lines are first detected using a Haar-wavelet based method, and the line shifts are measurde through a grid search of minimum chi-square over the width of the -ve order line. Only lines detected at >2-sigma and displaying a positive line shift are shown here, as diamonds with red vertical lines signifying ±1-sigma error bars. The average line shift is shown as the horizontal green line, and ±1-sigma width of the distribution of line shifts is shown as the horizontal dashed green lines. The measured wavelength shift is 0.031±0.008 Angstrom, which corresponds to an expected zeroth-order shift of ~2-3.5 pix.
Figure showing observed line shifts for a variety of strong lines in numerous obsevations


Figure 3: Pixel location corrections for different CRSV, for 2012 degap (top) and corrected with +2.5 pixel offset (bottom). The different colors of the curves represent different AMP_SF values (blue=1, red=2, green=3). In the bottom panel, the dashed curve represents the original AMP_SF=1 curve.
Figure showing pixel location corrections for <tt>AMP_SF</tt>=1,2,3 for <tt>CRSV</tt>=94:103 comparing the 2012 degap (top panel) and the corrected version (bottom panel)


Figure 4: Validation of degap by comparing the effect of different pixel shifts on the line shifts, for various Capella ObsIDs. The top panels focus on the 15 Ang Fe17 line, the middle panels on the 17 Ang Fe17 line, and the bottom panels on the 19 Ang O8 line. The left panels show the difference between the +ve order profile and the -ve order profile, placed on a wavelength scale corresponding to the -ve order. The histogram is for the 2012 version of the degap, and the smooth curves are for different pixel offsets added on to CRSV=95:102, with the colors corresponding to the pixel offsets in the same color as shown at the top and bottom of the panels. The cluster of curves in different shades of green at deltapix=2.4, 2.5, and 2.6 represent the plausible range of solutions based on computing offsets in zeroth order locations for AR Lac and HZ 43, and by looking at the average of line shifts in strong lines for a large number of coronal sources. The right panels show the +ve (red) and -ve (white) line profiles for a pixel offset of +2.5.
In all cases, the data were reprocessed with hrc_process_events using the appropriately corrected degap file, then filtered on good time intervals and status bits, and a zeroth order location was determined manually. pha2 spectra were then extracted by running tg_create_mask, tg_resolve_events, and tgextract in sequence.
 

ObsID Figures
18363 Figure showing effect of different pixel offset degaps on line profiles from ObsID 18363
18361 Figure showing effect of different pixel offset degaps on line profiles from ObsID 18361
18359 Figure showing effect of different pixel offset degaps on line profiles from ObsID 18359
14240 Figure showing effect of different pixel offset degaps on line profiles from ObsID 14240
13090 Figure showing effect of different pixel offset degaps on line profiles from ObsID 13090
11932 Figure showing effect of different pixel offset degaps on line profiles from ObsID 11932
10600 Figure showing effect of different pixel offset degaps on line profiles from ObsID 10600
6472 Figure showing effect of different pixel offset degaps on line profiles from ObsID 06472
5956 Figure showing effect of different pixel offset degaps on line profiles from ObsID 05956
3675 Figure showing effect of different pixel offset degaps on line profiles from ObsID 03675
3479 Figure showing effect of different pixel offset degaps on line profiles from ObsID 03479

Degap File

CALDB filename: $CALDB/data/chandra/hrc/gaplookup/hrcsD1999-07-22gaplookupN0004.fits
(local filename: hrcsdegap_shift25.fits)

changelog


Summary
Consequences
Fig 1: Source offsets
Fig 2: Observed line shifts
Fig 3: Degap solutions
Fig 4: Validation
Degap File
changelog
Vinay Kashyap (CfA/CXC)