This is an update to the empirical HRC PSF made using on-axis observations of the unresolved eclipsing active binary star AR Lac. The previous version of this memo is at empPSF_2017feb.html, and the PSFs presented here supersede the older products.
There are some known discrepancies between the raytrace model and the observed PSFs for Chandra. For example, observed HRC profiles are sharper than suggested by the model, despite the model not taking into account sources of systematic uncertainties like tailgating and degap; and in contrast, observed ACIS profiles are broader than suggested by the model, which is attributable to an incomplete model of the ACIS pixellation and to the difficulties of obtaining a "clean" unpiled point source. Furthermore, deconvolution of observed point sources using raytraces yield systematic residuals (see Juda & Karovska 2009, 2010; Kashyap 2010), indicating that the raytrace model does not contain all the features present in the data.
We have therefore undertaken to put together empirical models of the on-axis PSF (see Jerius 2002, Jerius et al. 2006, Kashyap & Jerius 2010, Kashyap et al. 2017) using HRC-I and HRC-S observations of AR Lac. AR Lac is an unresolved spectroscopic eclipsing RS Cvn type binary (K0IV+G5IV, mV=6.11, d=43 pc), which emits optically thin radiative emission primarily in the 1-10 MK temperature range. Its spectrum covers energies <5 keV (Huenemoerder et al. 2011), with most counts occurring in the 0.8-1.5 keV range. It has been observed regularly over the Chandra mission as part of a calibration program to monitor the HRC gain. It has been known to flare often, though the base emission is steady (Drake et al. 2014)
We expect the images provided below to be useful for carrying out 2D modeling or deconvolutions of HRC data, as well as for further calibration efforts to improve the SAOtrace raytrace model. Note that the effects of the HRC detector PSF has not been removed from these images. Direct quantitative comparisons to ACIS data are not recommended unless these images are first deconvolved with the HRC detector PSF and then blurred with a model of the ACIS detector PSF that includes pixelization, grade assignments, and EDSER effects.
The full list of ObsIDs and exposure times for the data used here is given in Tables of HRC-I and HRC-S Observations.
Each dataset was first downloaded from the archive, and the Level 1 events list was reprocessed using hrc_process_events, which applies the latest degap corrections to the data.
The data were then derolled around the aimpoint such that all datasets are oriented the same way in the detector plane.
A tailgating test (Juda 2012) was performed for all events. Tailgating is an HRC detector effect where if a photon is followed too soon and too close by another one, the following photon's location determination is not as precise, which causes a point source dominated by such events to be broader than it would be otherwise. We thus flag all events that occur <50 msec after, and within 20 HRC pixels of another; such events, which usually occur during flares, are then eliminated and excluded from further consideration.
The events are then filtered by status bit and good time intervals (GTIs) as computed during pipeline processing. The pipeline GTIs are some times affected by secondary science corruption (a housekeeping error which does not affect primary science data) which results in a loss of exposure, but otherwise has no effect on the product.
Events with high values of the scaled summed amplifier tap signals (SAMP) greater than 300 are also excluded in order to minimize the effect of the background.
It has been recently discovered that events with low SAMP have larger uncertainties on the fine detector positions of events, and contribute to a small (<15%) inflation of the size of the PSF (Bogdan et al., 2024). However, due to the steady gain drop seen in the HRC (see section 7.8 of the Chandra Proposers' Observatory Guide), more events are now found with low values of SAMP, and this may have a proportionally larger effect on the observed size of point sources. In the event that higher sharpness is required, we provide an additional version of the empirical PSF limited to SAMP>15.
Furthermore, there is indication that the PSF has changed subtly over the mission. For example, the PSF "artefact" appears to have developed over the 2004-2006 time frame (see Juda & Karovska 2009, 2010; Kashyap 2010). We thus provide versions of the empirical PSF covering different epochs. Specifically, we compute PSFs covering the years 2000-2005, 2006-2017, and 2017-2025.
Each dataset is downloaded and processed as described above. The event positions are derolled by rotating around the image center by the corresponding ROLL_NOM to obtain coordinates aligned with the spacecraft detector plane oriented axes (see Figure 4.25 of the Chandra Proposers' Guide). The location of AR Lac is then found empirically by iterative centroiding, and the data are then shifted so that the centroid is at the origin. This eliminates proper motion and other misalignments.
Observations that are within 0.5 arcmin of the aimpoint, and within 0.02 mm of the best focus (for the HRC-I; all HRC-S aimpoint observations are at either 0.10516 mm [prior to 2006] or at 0.007 mm) are stacked. Stacking in such a way can result in a statistical bias towards a sharper core than appropriate (see Appendix A of 2017 memo for a discussion); we ensure that each component of the stack has sufficient counts that the recentering bias is negligible.
| ObsID | Observation Date | Exposure [ks] | Offaxis [arcmin] | azimuth [deg] | SIM offset [mm] | Defocus [mm] |
|---|---|---|---|---|---|---|
| Jan 2000 - Dec 2005 | ||||||
| 1284 | 1999-08-31T21:15:28 | 0.8 | 0.355 | 20.4 | -0.00202 | -0.01853 |
| 62507 | 1999-10-04T23:08:34 | 1.6 | 0.349 | 24.2 | 0.00050 | -0.00143 |
| 1385 | 1999-10-05T00:21:05 | 18.6 | 0.286 | 24.2 | 0.00050 | -0.00143 |
| 1484 | 1999-12-09T09:41:42 | 1.2 | 0.339 | 20.4 | 0.00050 | 0.00143 |
| 996 | 2000-12-12T16:31:38 | 0.8 | 0.258 | 28.1 | 0.00050 | 0.00143 |
| 2608 | 2002-01-27T00:44:33 | 1.2 | 0.235 | 19.6 | 0.00050 | 0.00143 |
| 4294 | 2003-02-22T11:07:21 | 1.2 | 0.233 | 29.5 | 0.00050 | 0.00143 |
| 5060 | 2004-09-13T20:19:58 | 1.1 | 0.247 | 72.8 | -0.00202 | 0.00143 |
| 6133 | 2004-11-25T21:04:40 | 1.1 | 0.285 | 70.8 | 0.00050 | 0.00143 |
| 5979 | 2005-09-27T08:06:24 | 2.7 | 0.243 | 74.2 | -0.00202 | 0.00143 |
| Jan 2006 - Dec 2016 | ||||||
| 6519 | 2006-09-20T19:20:57 | 3.1 | 0.265 | 76.6 | -0.00202 | 0.00143 |
| 8298 | 2007-09-17T13:08:38 | 3.1 | 0.308 | 92.6 | 0.00050 | 0.00143 |
| 9684 | 2008-07-11T09:55:09 | 3.2 | 0.339 | 74.4 | 50.00520 | 0.00143 |
| 9685 | 2008-07-11T10:54:05 | 3.1 | 0.314 | 106.3 | -50.00421 | 0.00143 |
| 9640 | 2008-09-07T09:35:46 | 3.2 | 0.308 | 97.6 | -0.00202 | 0.00143 |
| 10578 | 2009-09-24T16:07:52 | 3.1 | 0.355 | 88.6 | -0.00453 | 0.00143 |
| 11889 | 2010-09-25T05:43:56 | 3.2 | 0.306 | 98.0 | -0.00202 | 0.00143 |
| 13182 | 2010-12-16T18:45:33 | 18.0 | 0.252 | 21.3 | -0.00202 | 0.00143 |
| 13265 | 2011-09-18T20:48:16 | 2.2 | 0.251 | 99.8 | -0.00202 | 0.00143 |
| 14299 | 2012-09-27T02:28:47 | 3.1 | 0.393 | 98.0 | -0.00202 | 0.00143 |
| 15409 | 2013-09-16T15:20:29 | 3.1 | 0.244 | 17.3 | -0.00202 | 0.00143 |
| 16376 | 2014-09-16T02:03:03 | 3.1 | 0.503 | 113.3 | -0.00202 | 0.00143 |
| 17372 | 2015-03-08T17:11:00 | 5.1 | 0.451 | 102.6 | -0.00202 | 0.00143 |
| 17351 | 2015-09-26T14:11:24 | 5.1 | 0.266 | 17.7 | -0.00202 | 0.00143 |
| 18408 | 2016-03-26T17:33:45 | 5.1 | 0.404 | 90.6 | -0.00202 | 0.00143 |
| 18387 | 2016-09-20T14:49:44 | 5.1 | 0.346 | 114.9 | -0.00202 | 0.00143 |
| Jan 2017 - Jul 2025 | ||||||
| 19836 | 2017-04-28T15:31:56 | 5.1 | 0.142 | 36.6 | -0.00202 | 0.00143 |
| 19815 | 2017-09-17T01:40:41 | 5.1 | 0.097 | 5.7 | -0.00202 | 0.00143 |
| 20684 | 2018-04-09T20:21:42 | 5.1 | 0.148 | 28.2 | -0.00202 | 0.00143 |
| 20663 | 2018-09-17T15:50:05 | 5.1 | 0.159 | 354.4 | -0.00202 | 0.00143 |
| 21783 | 2018-12-26T17:59:50 | 5.1 | 0.114 | 67.9 | -0.00202 | 0.00143 |
| 21762 | 2019-04-08T11:21:42 | 5.1 | 0.099 | 50.3 | -0.00202 | 0.00143 |
| 22854 | 2019-10-18T22:08:56 | 4.9 | 0.173 | 65.2 | -0.00202 | 0.00143 |
| 22772 | 2020-03-23T01:07:50 | 5.0 | 0.132 | 48.2 | -0.00202 | 0.00143 |
| 62650 | 2020-09-29T01:50:47 | 7.1 | 0.180 | 16.6 | -0.00202 | 0.00143 |
| 22751 | 2020-11-02T13:31:28 | 5.1 | 0.096 | 25.8 | -0.00202 | 0.00143 |
| 24525 | 2021-04-04T12:13:29 | 5.1 | 0.097 | 52.9 | -0.00202 | 0.00143 |
| 24546 | 2021-09-09T00:24:52 | 5.0 | 0.115 | 47.6 | 0.00050 | 0.00143 |
| 27247 | 2023-05-31T12:10:07 | 9.7 | 0.169 | 18.4 | -0.00202 | 0.00143 |
| 25593 | 2023-06-05T09:08:29 | 5.0 | 0.159 | 16.5 | -0.00202 | 0.00143 |
| 25571 | 2023-12-03T22:48:11 | 4.9 | 0.144 | 3.0 | -0.00202 | 0.00143 |
| 28384 | 2024-06-03T08:26:01 | 4.9 | 0.114 | 43.6 | -0.00202 | 0.00143 |
| 28406 | 2024-12-17T05:27:55 | 3.8 | 0.137 | 27.2 | -0.00202 | 0.00143 |
| 29562 | 2025-06-27T01:40:44 | 4.8 | 0.099 | 43.5 | -0.00202 | 0.00143 |
| ObsID | Observation Date | Exposure [ks] | Offaxis [arcmin] | azimuth [deg] | SIM offset [mm] | Defocus [mm] |
|---|---|---|---|---|---|---|
| Jan 2000 - Dec 2005 | ||||||
| 998 | 2000-12-20T14:52:41 | 0.8 | 0.271 | 7.0 | 0.00003 | 0.10516 |
| 997 | 2001-05-14T00:05:25 | 1.2 | 0.259 | 355.3 | 0.00003 | 0.10516 |
| 2629 | 2002-01-26T15:54:51 | 1.1 | 0.264 | 15.0 | 0.00003 | 0.10516 |
| 2650 | 2002-08-09T13:20:12 | 0.9 | 0.308 | 7.2 | 0.00003 | 0.10516 |
| 4336 | 2003-02-22T02:17:39 | 1.1 | 0.295 | 348.7 | 0.00003 | 0.10516 |
| 4315 | 2003-09-01T11:46:53 | 0.8 | 0.277 | 351.0 | 0.00003 | 0.10516 |
| 5081 | 2004-02-09T12:59:22 | 0.9 | 0.202 | 39.0 | 0.00003 | 0.10516 |
| 5102 | 2004-11-28T05:42:35 | 1.1 | 0.239 | 49.0 | 0.00003 | 0.10516 |
| 6021 | 2005-02-10T10:38:01 | 3.1 | 0.234 | 37.3 | 0.00003 | 0.10516 |
| 6000 | 2005-09-01T20:58:49 | 3.1 | 0.206 | 45.9 | 0.00003 | 0.10516 |
| Jan 2006 - Dec 2016 | ||||||
| 6477 | 2006-03-20T05:05:39 | 3.1 | 0.284 | 65.6 | 0.00003 | 0.00700 |
| 6498 | 2006-09-21T18:56:18 | 3.1 | 0.282 | 60.9 | 0.00003 | 0.00700 |
| 8320 | 2007-09-21T17:06:23 | 3.1 | 0.311 | 82.1 | 0.00003 | 0.00700 |
| 9683 | 2008-07-11T07:47:29 | 3.2 | 0.231 | 79.9 | 7.98550 | 0.00700 |
| 9682 | 2008-07-11T08:56:12 | 3.2 | 0.235 | 83.2 | -8.00304 | 0.00700 |
| 9661 | 2008-09-02T02:37:56 | 3.2 | 0.216 | 72.4 | 0.00003 | 0.00700 |
| 10601 | 2009-09-25T21:51:14 | 3.2 | 0.199 | 77.8 | 0.00003 | 0.00700 |
| 11910 | 2010-09-25T15:05:53 | 3.1 | 0.242 | 94.4 | 0.00003 | 0.00700 |
| 13068 | 2011-09-19T06:06:52 | 3.1 | 0.187 | 107.5 | -0.00249 | 0.00700 |
| 14278 | 2012-09-24T09:42:17 | 3.1 | 0.308 | 90.1 | 0.00003 | 0.00700 |
| 15430 | 2013-09-17T22:39:35 | 3.2 | 0.283 | 355.8 | 0.00003 | 0.00700 |
| 16397 | 2014-09-16T11:35:38 | 3.1 | 0.383 | 121.2 | 0.00003 | 0.00700 |
| 17330 | 2015-10-20T02:10:01 | 3.2 | 0.268 | 70.0 | 0.00003 | 0.00700 |
| 18366 | 2016-09-22T14:00:33 | 3.1 | 0.434 | 115.7 | 0.00003 | 0.00700 |
| Jan 2017 - Jul 2025 | ||||||
| 19794 | 2017-09-15T04:52:12 | 3.1 | 0.156 | 338.6 | 0.00003 | 0.00700 |
| 20685 | 2018-09-10T03:56:57 | 3.0 | 0.122 | 332.5 | 0.00003 | 0.00700 |
| 21741 | 2019-09-04T00:44:23 | 3.1 | 0.129 | 350.7 | -0.00249 | 0.00700 |
| 22793 | 2020-03-04T02:32:44 | 4.1 | 0.070 | 6.8 | 0.00003 | 0.00700 |
| 22794 | 2020-03-04T04:02:16 | 4.1 | 0.078 | 8.3 | 2.43388 | 0.00700 |
| 22795 | 2020-03-04T05:17:26 | 4.2 | 0.087 | 14.9 | 4.86774 | 0.00700 |
| 22796 | 2020-03-04T06:32:36 | 4.2 | 0.103 | 22.5 | 7.30161 | 0.00700 |
| 22797 | 2020-03-04T18:14:22 | 4.1 | 0.073 | 352.5 | -2.45395 | 0.00700 |
| 22798 | 2020-03-04T19:43:54 | 4.2 | 0.087 | 23.4 | -4.88528 | 0.00700 |
| 22799 | 2020-03-04T20:59:04 | 4.2 | 0.110 | 36.4 | -7.31914 | 0.00700 |
| 62649 | 2020-10-25T12:50:45 | 4.7 | 0.168 | 344.4 | -0.00249 | 0.00700 |
| 25592 | 2021-09-24T22:06:00 | 5.1 | 0.115 | 334.9 | 0.00003 | 0.00700 |
| 28405 | 2024-06-28T12:58:17 | 5.0 | 0.117 | 355.1 | 0.00003 | 0.00700 |
| 29583 | 2025-07-17T01:07:40 | 4.9 | 0.108 | 347.3 | 0.00003 | 0.00700 |
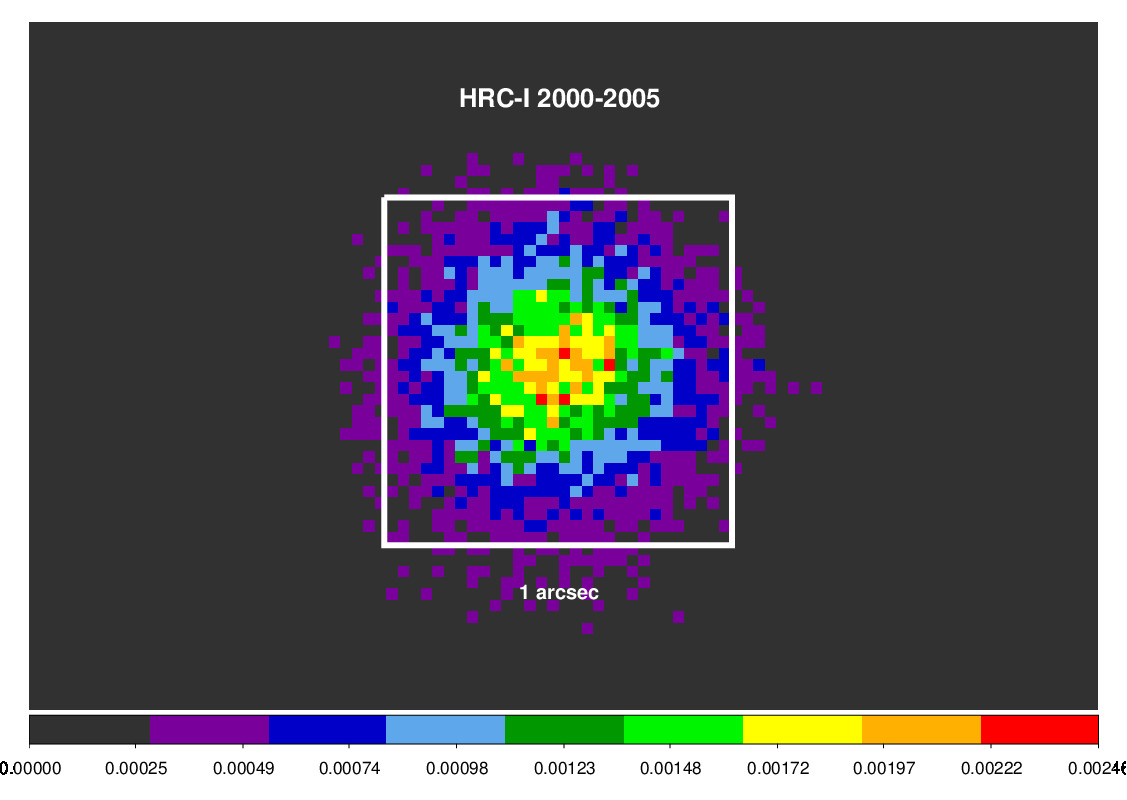
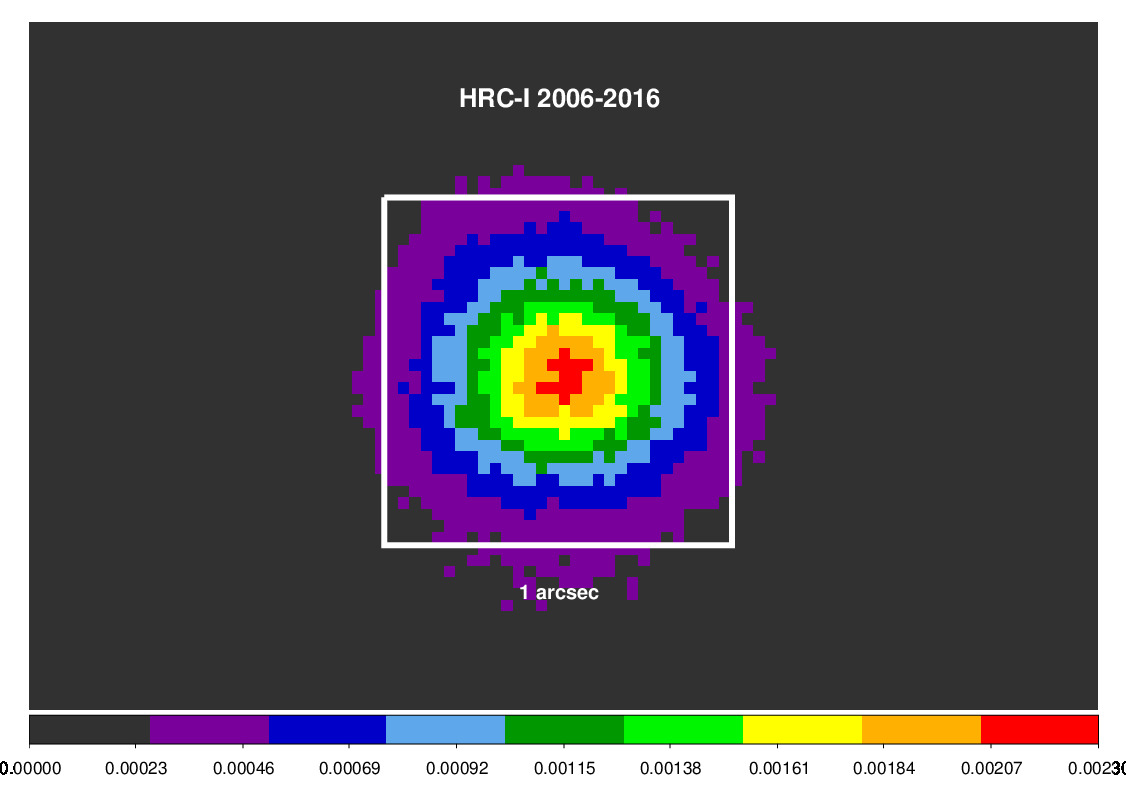
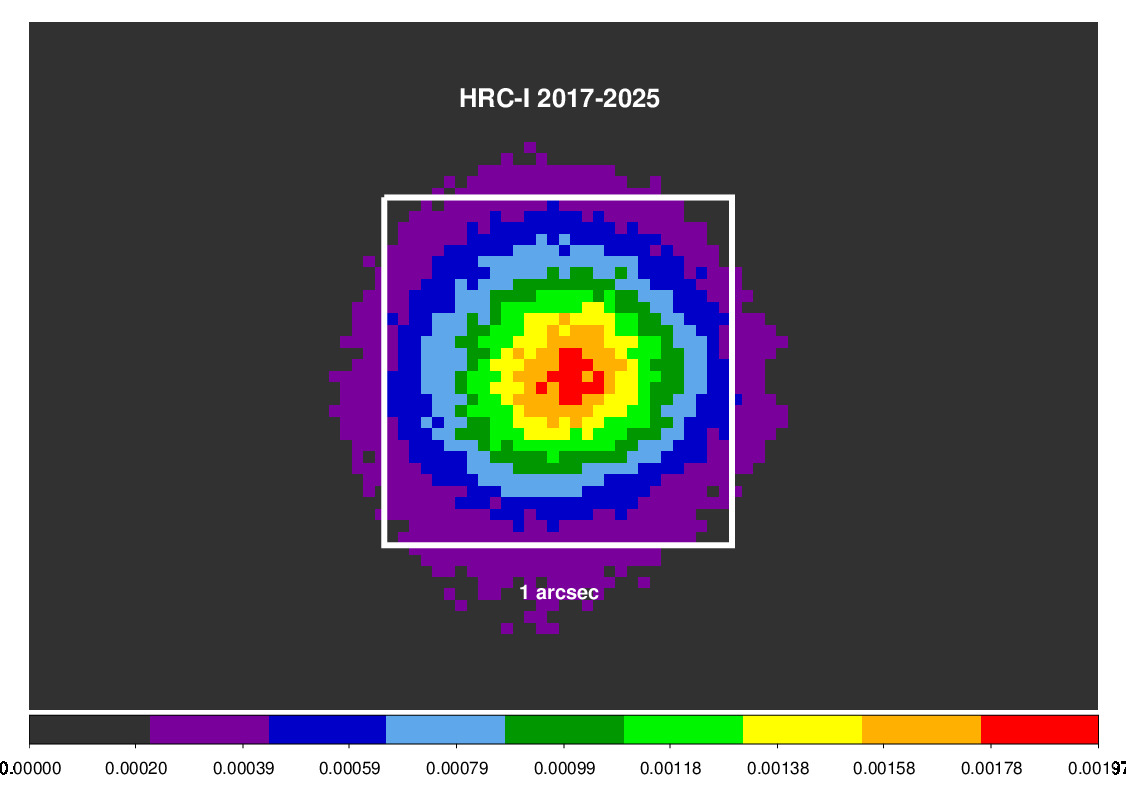
In the tables below (HRC-I for SAMP<300, HRC-I for 15<SAMP<300, HRC-S for SAMP<300, and HRC-S for 15<SAMP<300), we present the FITS images of the stacked PSFs separately for HRC-I and HRC-S, binned at 1/4 HRC pixels (approximately 0.03296 arcsec) for combined AR Lac over different epochs. The images shown include a box of size 1 arcsec centered on the PSF and a linear intensity scale with an aips0 colormap. In addition, we compute the (circular) radii (in units of HRC pixels) that enclose 39%, 50%, 85%, and 95% of the enclosed counts fractions for the various datasets in the Table of ECFs. Error bars on the radii are placed by computing the binomial variance on the cdf and projecting them onto distance.
| Filtered on status bits and GTI, excluding tailgated events and SAMP greater than 300; selected to be within 0.5 arcmin of the aimpoint and within 0.02 mm of the best focus for observations during the specified epoch; recentered, derolled, stacked, binned at 1/4 HRC pixel, background subtracted, and normalized to sum to 1. | ||
| Epoch | File | Image |
|---|---|---|
| Jan 2000 - Dec 2005 | empPSF_iARLac_v2025_2000-2005.fits | |
| Jan 2006 - Dec 2016 | empPSF_iARLac_v2025_2006-2016.fits | |
| Jan 2017 - Jul 2025 | empPSF_iARLac_v2025_2017-2025.fits | |
| Filtered on status bits and GTI, excluding tailgated events and SAMP less than 16 and greater than 300; selected to be within 0.5 arcmin of the aimpoint and within 0.02 mm of the best focus for observations during the specified epoch; recentered, derolled, stacked, binned at 1/4 HRC pixel, background subtracted, and normalized to sum to 1. | ||
| Epoch | File | Image |
|---|---|---|
| Jan 2000 - Dec 2005 | empPSF_iARLac_v2025_2000-2005_s15.fits | 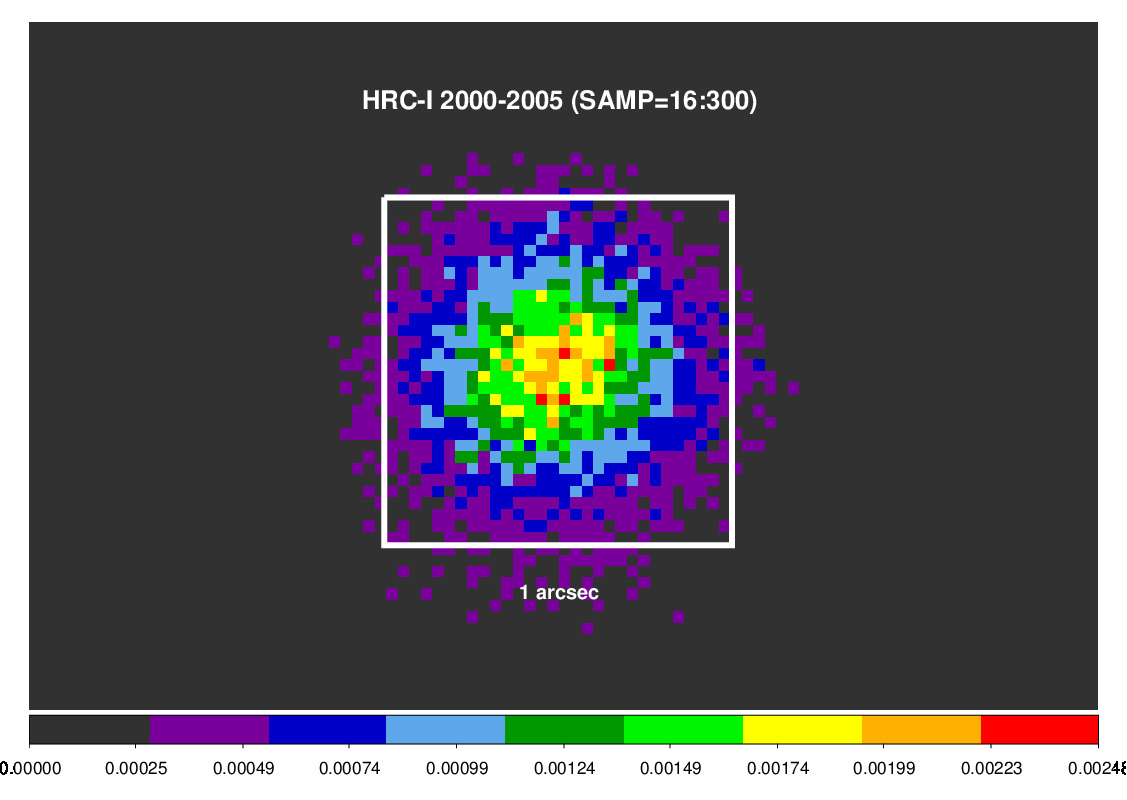 |
| Jan 2006 - Dec 2016 | empPSF_iARLac_v2025_2006-2016_s15.fits | 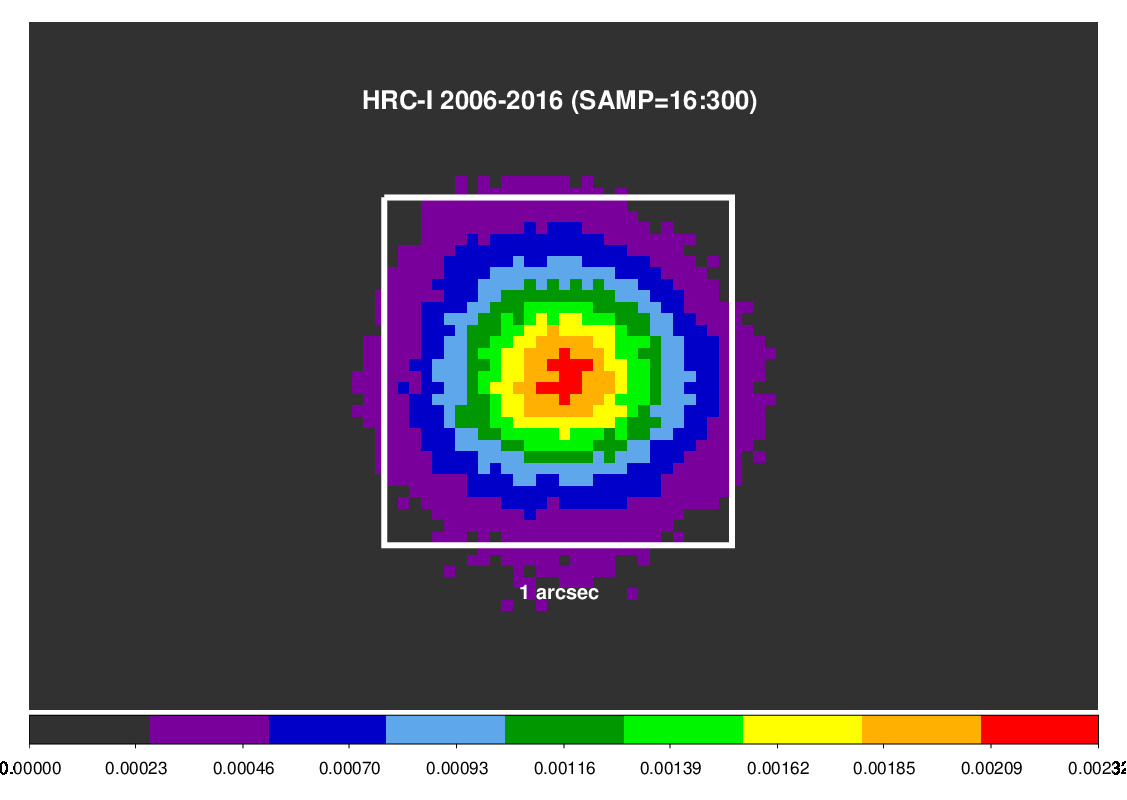 |
| Jan 2017 - Jul 2025 | empPSF_iARLac_v2025_2017-2025_s15.fits | 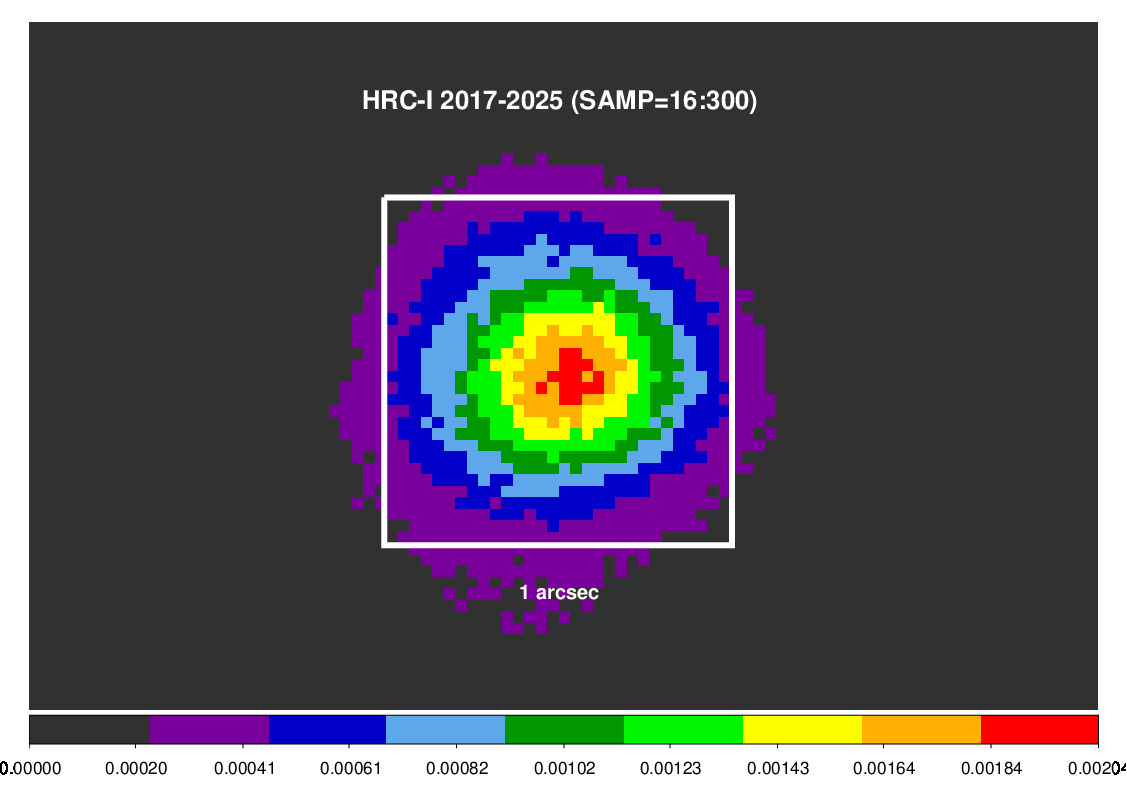 |
| Filtered on status bits and GTI, excluding tailgated events and SAMP greater than 300; selected to be within 0.5 arcmin of the aimpoint for observations during the specified epoch; recentered, derolled, stacked, binned at 1/4 HRC pixel, background subtracted, and normalized to sum to 1. | ||
| Epoch | File | Image |
|---|---|---|
| Jan 2000 - Dec 2005 | empPSF_sARLac_v2025_2000-2005.fits | 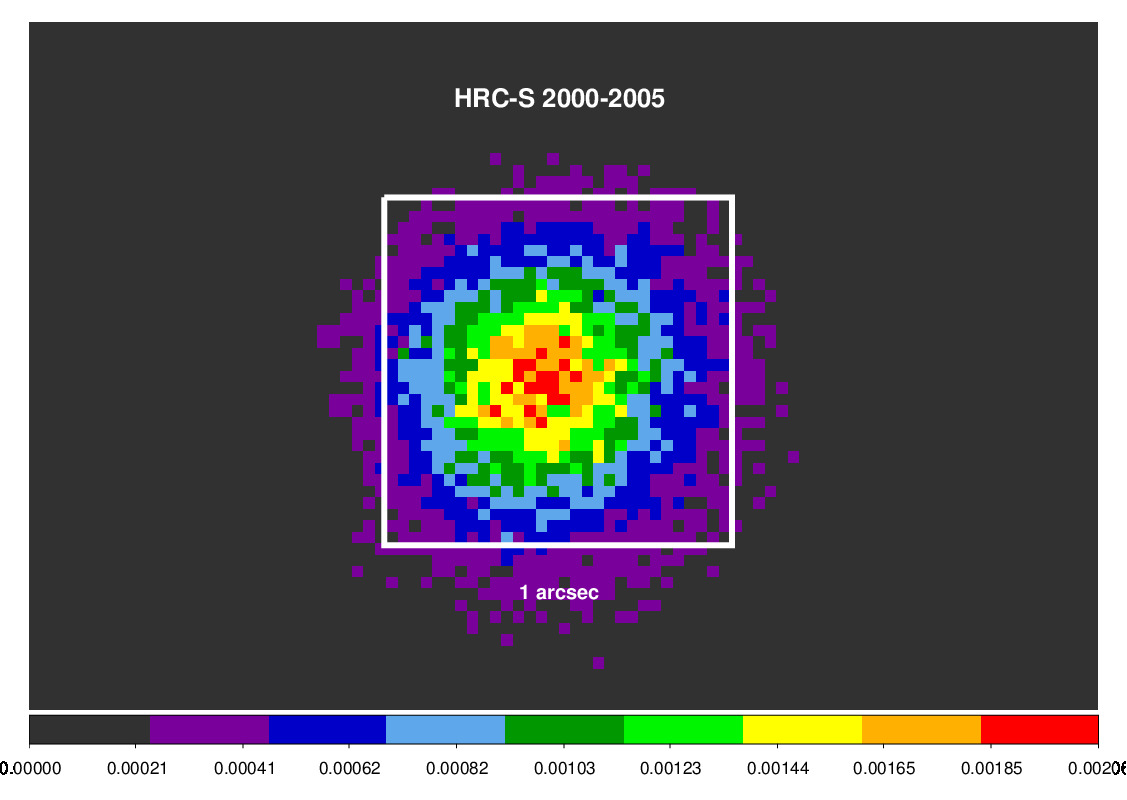 |
| Jan 2006 - Dec 2016 | empPSF_sARLac_v2025_2006-2016.fits |  |
| Jan 2017 - Jul 2025 | empPSF_sARLac_v2025_2017-2025.fits | 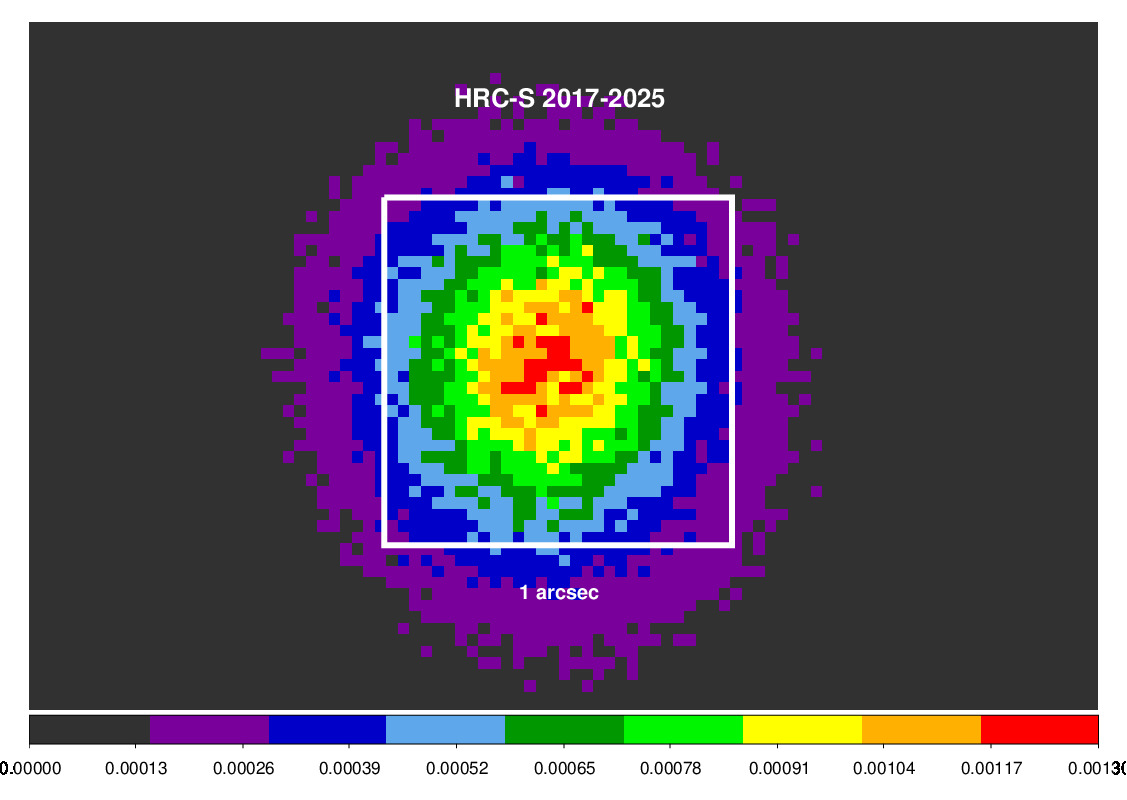 |
| Filtered on status bits and GTI, excluding tailgated events and SAMP less than 16 and greater than 300; selected to be within 0.5 arcmin of the aimpoint for observations during the specified epoch; recentered, derolled, stacked, binned at 1/4 HRC pixel, background subtracted, and normalized to sum to 1. | ||
| Epoch | File | Image |
|---|---|---|
| Jan 2000 - Dec 2005 | empPSF_sARLac_v2025_2000-2005_s15.fits | 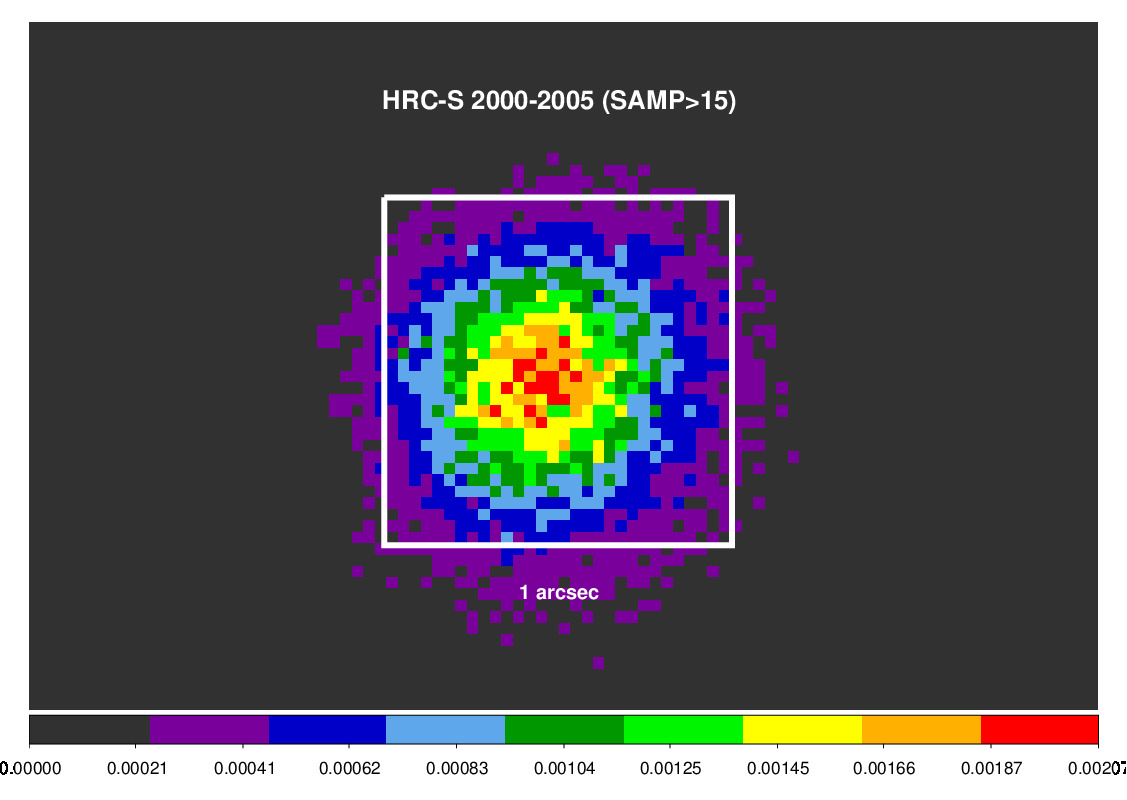 |
| Jan 2006 - Dec 2016 | empPSF_sARLac_v2025_2006-2016_s15.fits | 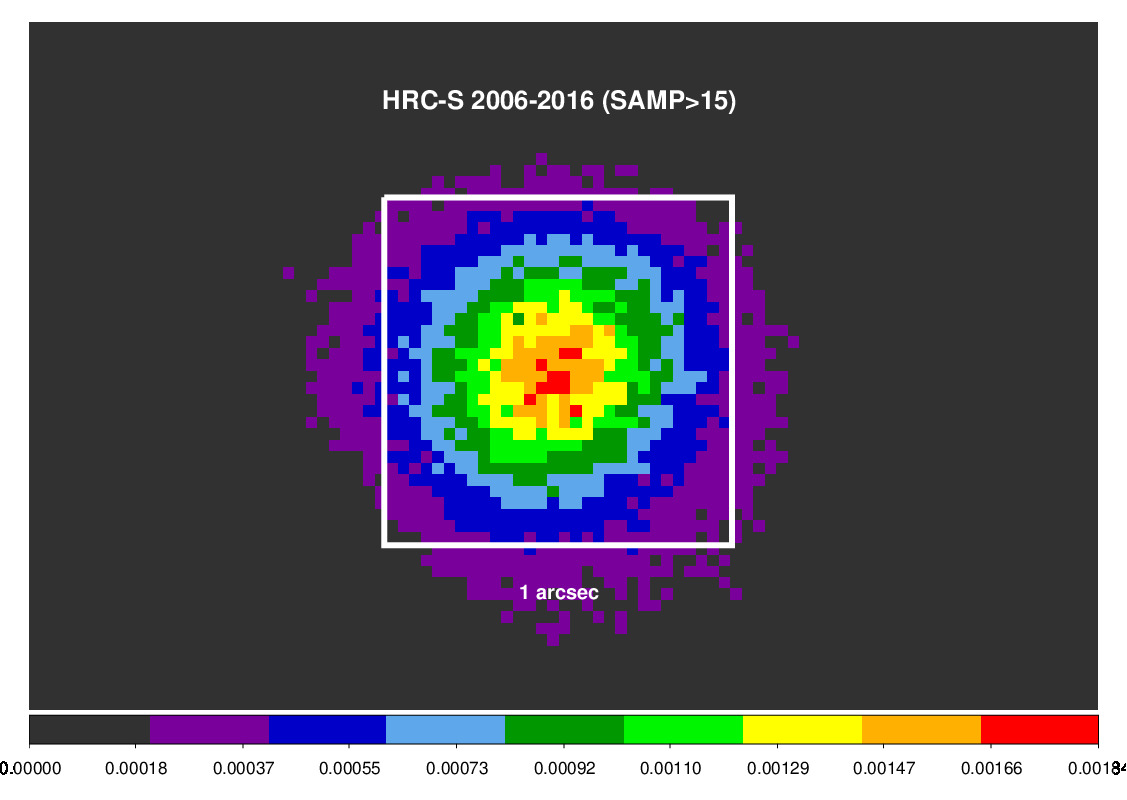 |
| Jan 2017 - Jul 2025 | empPSF_sARLac_v2025_2017-2025_s15.fits | 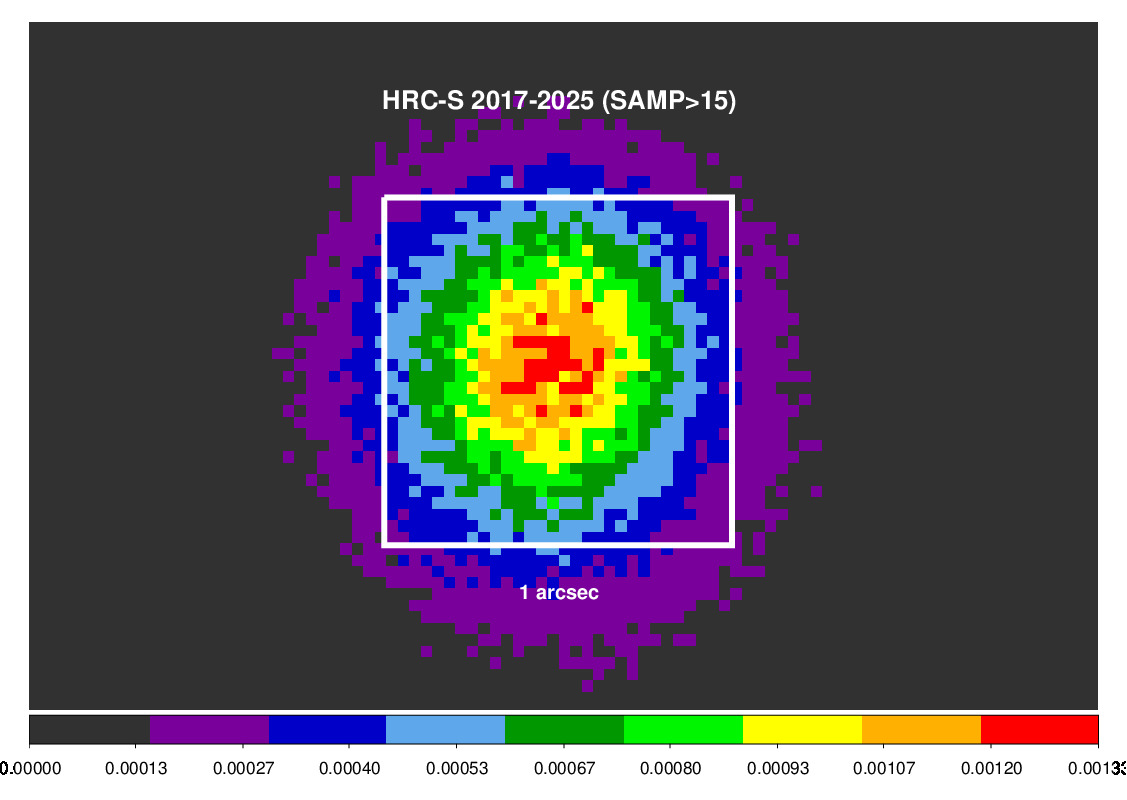 |
| Dataset | Counts | ECF [HRC pix] | ||||
|---|---|---|---|---|---|---|
| Total & [estimated background] | 0.39 | 0.50 | 0.85 | 0.95 | ||
| HRC-I | ||||||
| Jan 2000 - Dec 2005 SAMP<300 | 33621 [417.4] | 2.498 ± 0.012 | 2.992 ± 0.014 | 6.038 ± 0.030 | 11.52 ± 0.26 | |
| Jan 2000 - Dec 2005 SAMP=16:300 | 33338 [403.5] | 2.492 ± 0.012 | 2.984 ± 0.016 | 6.025 ± 0.031 | 11.48 ± 0.25 | |
| Jan 2006 - Dec 2016 SAMP<300 | 294435 [4193.6] | 2.453 ± 0.0046 | 2.960 ± 0.0053 | 6.190 ± 0.013 | 12.29 ± 0.13 | |
| Jan 2006 - Dec 2016 SAMP=16:300 | 290661 [3962.6] | 2.445 ± 0.0042 | 2.951 ± 0.0052 | 6.168 ± 0.012 | 12.26 ± 0.12 | |
| Jan 2017 - Jul 2025 SAMP<300 | 358537 [8818.7] | 2.625 ± 0.0043 | 3.155 ± 0.0047 | 6.499 ± 0.011 | 12.39 ± 0.086 | |
| Jan 2017 - Jul 2025 SAMP=16:300 | 334071 [8029.9] | 2.584 ± 0.0041 | 3.105 ± 0.0042 | 6.393 ± 0.013 | 12.31 ± 0.094 | |
| HRC-S | ||||||
| Jan 2000 - Dec 2005 SAMP<300 | 59527 [2763.1] | 2.530 ± 0.010 | 3.039 ± 0.011 | 6.196 ± 0.031 | 11.922 ± 0.195 | |
| Jan 2000 - Dec 2005 SAMP=16:300 | 58993 [2715.7] | 2.520 ± 0.010 | 3.027 ± 0.013 | 6.148 ± 0.030 | 11.794 ± 0.202 | |
| Jan 2006 - Dec 2016 SAMP<300 | 173164 [7159.7] | 2.758 ± 0.006 | 3.311 ± 0.007 | 6.796 ± 0.017 | 12.564 ± 0.120 | |
| Jan 2006 - Dec 2016 SAMP=16:300 | 170799 [6930.6] | 2.746 ± 0.007 | 3.295 ± 0.007 | 6.741 ± 0.018 | 12.470 ± 0.127 | |
| Jan 2017 - Jul 2025 SAMP<300 | 265174 [11698.9] | 3.157 ± 0.006 | 3.773 ± 0.006 | 7.523 ± 0.016 | 15.117 ± 0.148 | |
| Jan 2017 - Jul 2025 SAMP=16:300 | 243766 [10921.5] | 3.094 ± 0.006 | 3.694 ± 0.006 | 7.300 ± 0.015 | 14.435 ± 0.136 | |
The PSFs listed above are stacked from individual observations of a known point source after the roll has been corrected for. Thus, the x and y axes are aligned with the detector U and V coordinates (see Fig 7.1 of the POG). Furthermore, the photons are binned at 1/4 HRC pixel.
Thus, when using with real data, care must be taken so that both the spatial scales and the orientations of the data and the PSF match exactly. The former can be achieved by constructing the data image binned at 1/4 pixel, or rebinning the PSF to suit the observed image. The latter may be achieved by derolling the data, or rolling the PSF to match the observations. In the case of HRC-S, the rotation angle is equal to ROLL_NOM, while for HRC-I the rotation angle is ROLL_NOM - 45 degrees.
Note that the process of generating the PSFs included identifying and filtering out tailgated events. This was done merely to use the best data from AR Lac, which flares frequently and often reaches high count rates (>5 ct/s) where tailgated photons become a significant fraction of the total. Most source brightnesses are well below this level and tailgating may be ignored. If there are any intervals with high count rates that occur due to flares or similar events, tailgated events can be excluded simply by excluding such intervals.