| Detector/Grating | Calibration Product | Average Uncertainty | Comments | Additional Information |
|---|---|---|---|---|
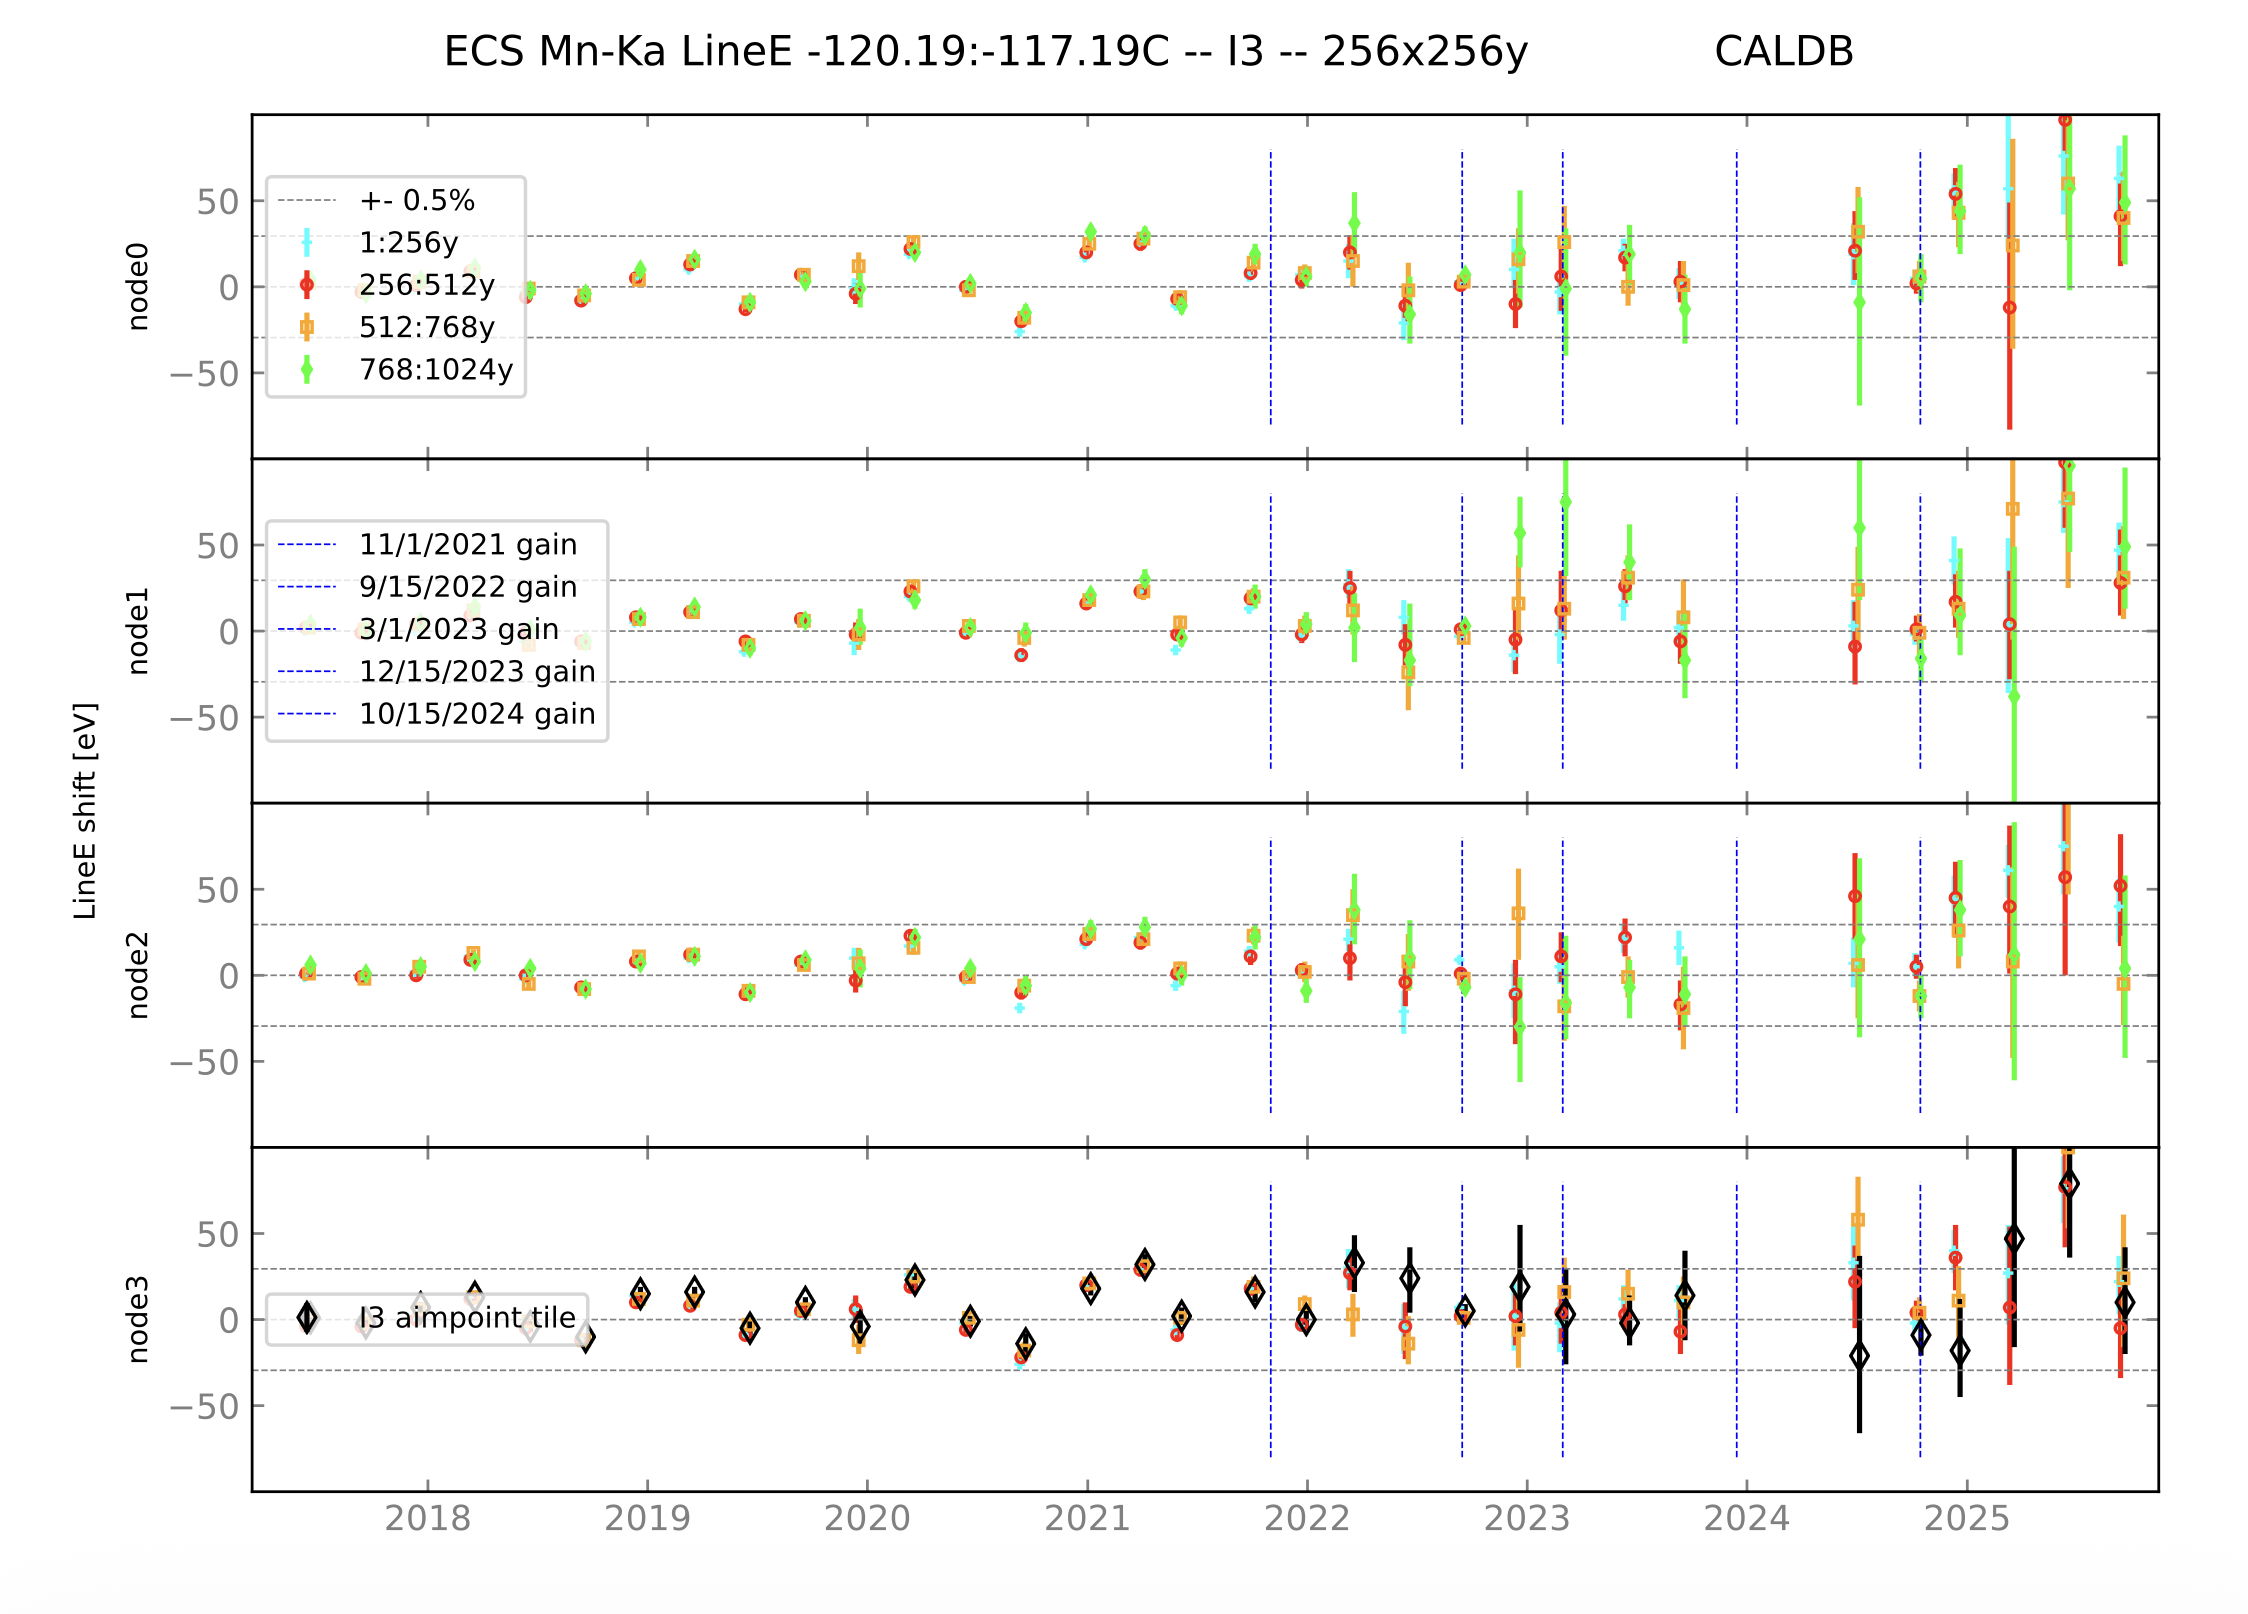
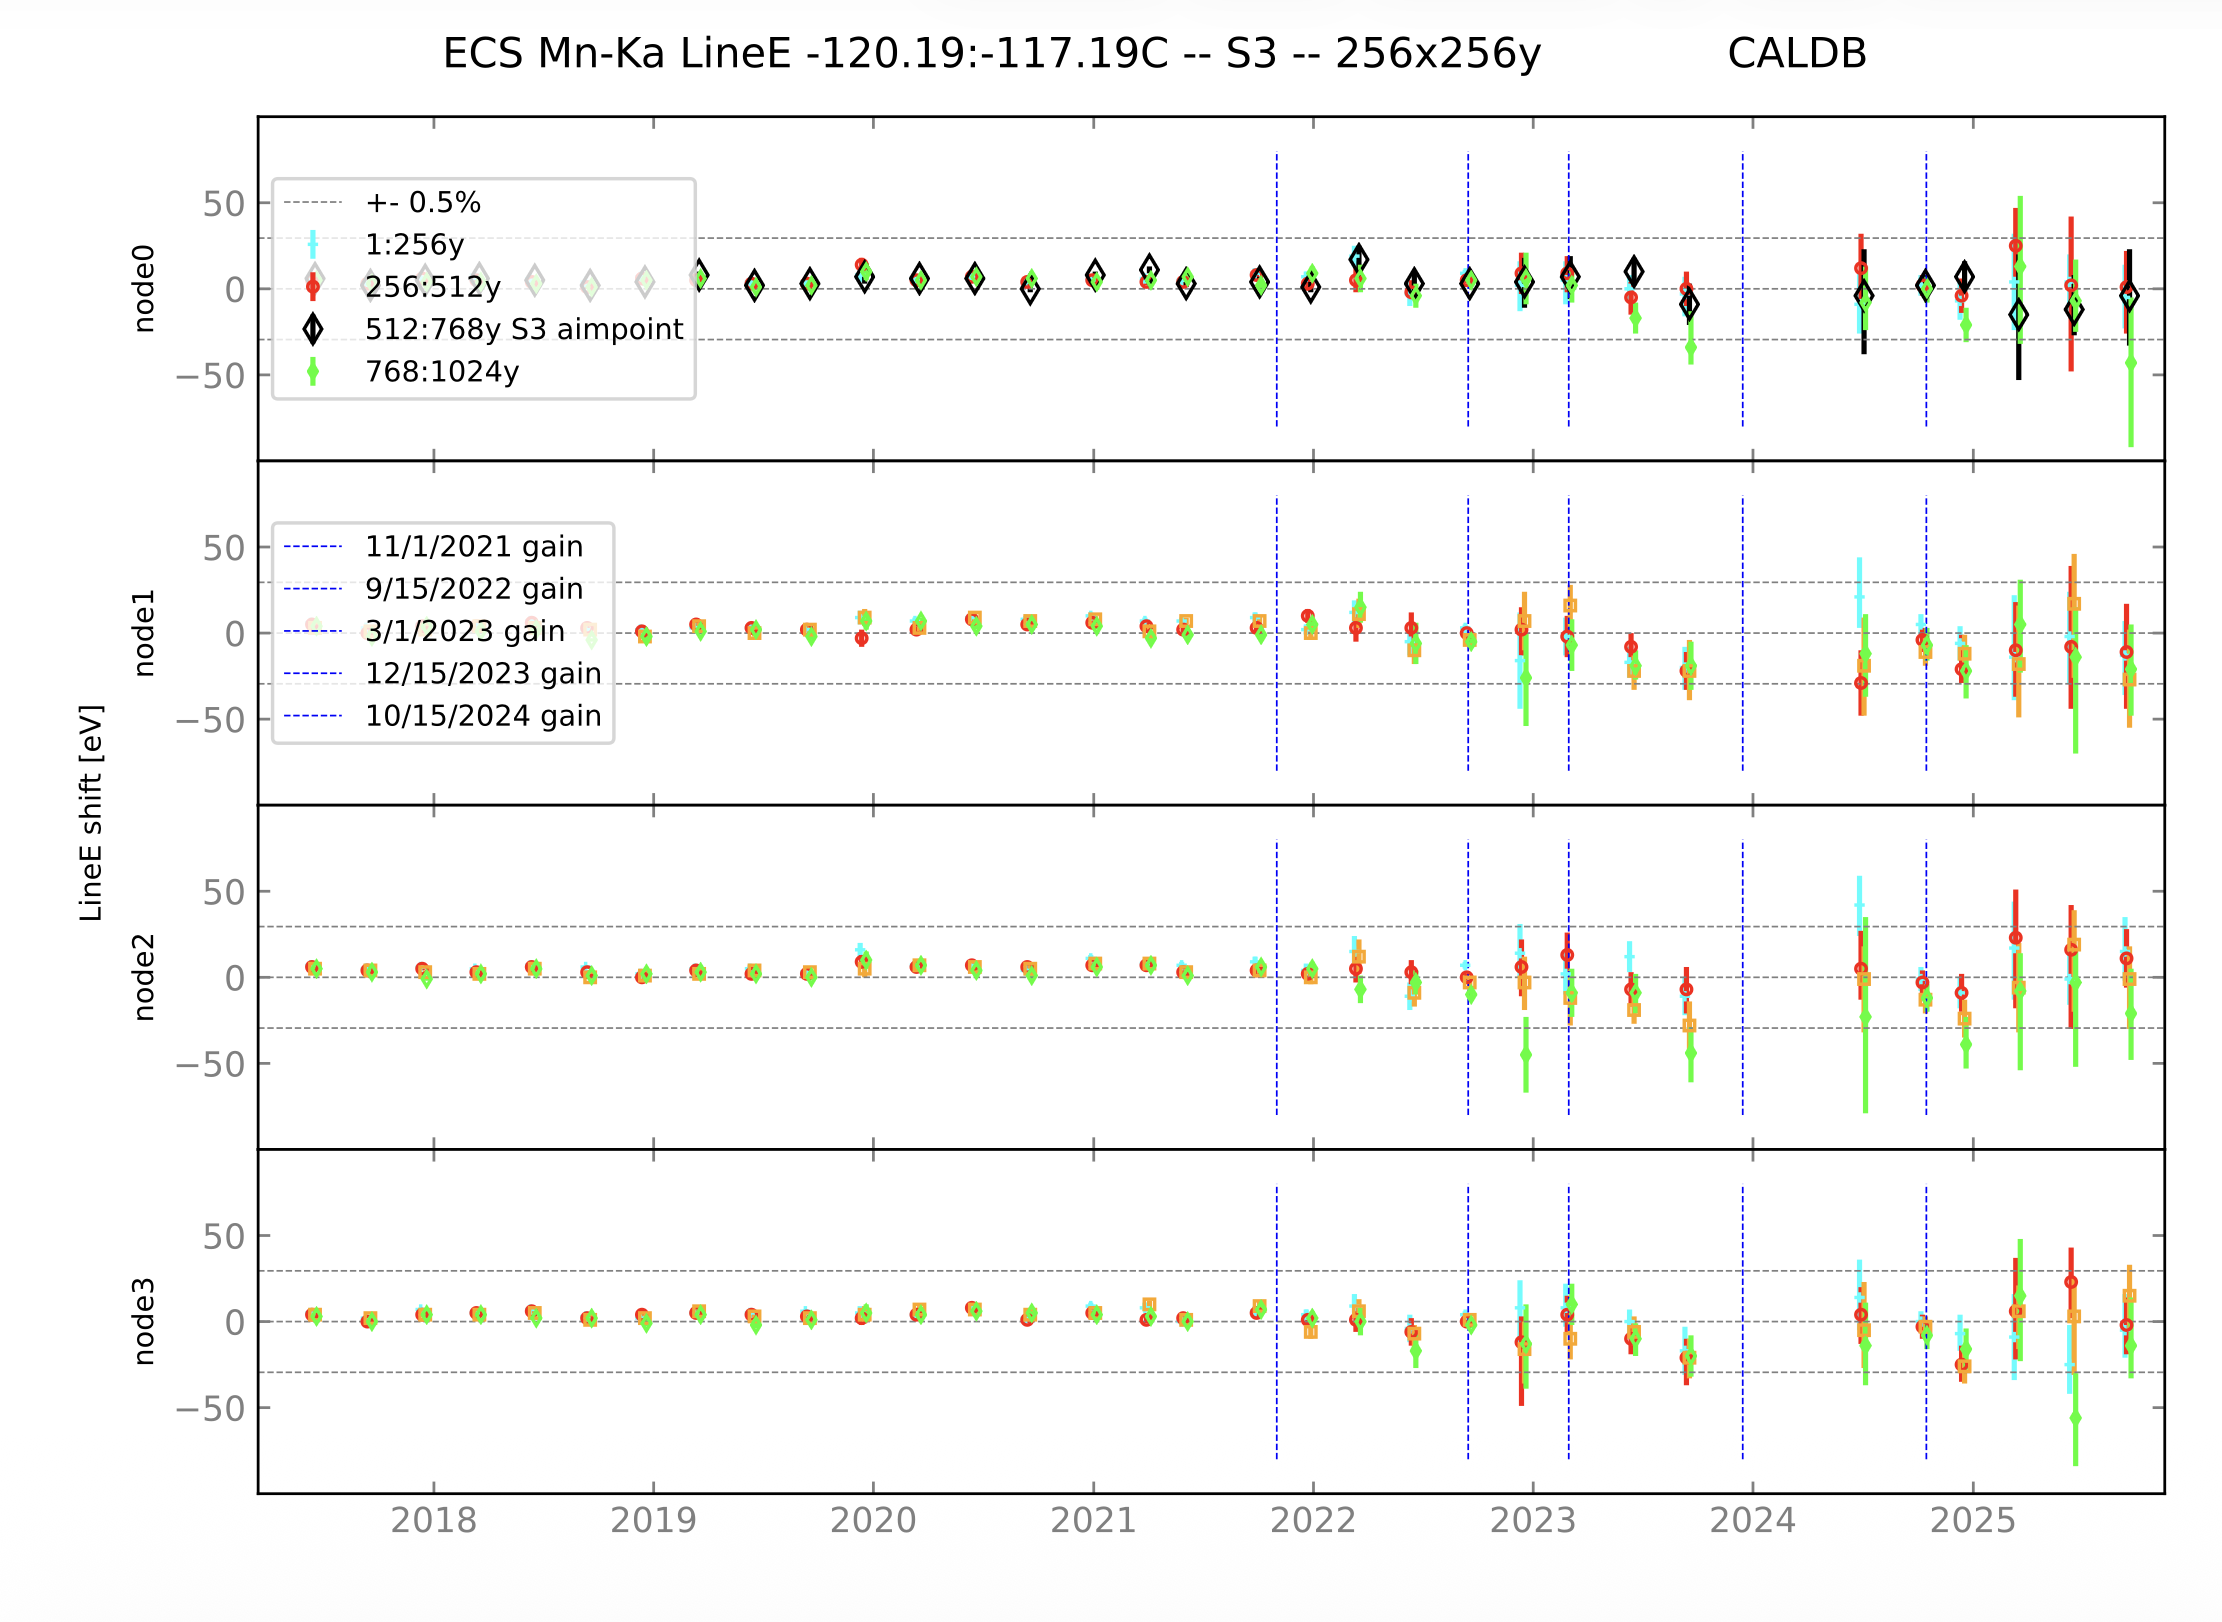
| ACIS | Dector Gain | 0.3% before 2022 0.5% after 2022 |
In general, the ACIS detector gain during a given observation depends on: 1) the date
of the observation, 2) the focal plane temperature during the observation, and 3) the
background rate. Early in the mission, the CCDs suffered radiation damage which produced
an increase in the charge transfer inefficiency (CTI). This was addressed by developing
a CTI correction algorithm for the ACIS CCDs. Continued radiation damage over the
course of the mission has produced a slow increase in CTI and a subsequent decrease in gain.
The CTI also increases with increasing focal plane temperature. In addition, background
events act as sacrificial charge, filling in the radiation-induced traps, and reducing
the CTI. The Chandra Calibration Team corrects for these effects by periodically releasing
a time-dependent gain correction file, which accounts for the CTI and the
ambient background rate during a given time period. Prior to 2022 a temperature-independent
CTI correction was applied to all ACIS data. Due to the increasing focal plane temperature
during observations, the Calibration Team released a set of temperature-dependent
CTI corrections in 2022.
The time-dependence of the ACIS gain has been monitored over the course of the mission with the ACIS external calibration source (ECS), which consists of three 55Fe sources that produce L-shell emission lines of Fe (0.71 keV) and Mn (0.64 keV) and K-shell emission lines of Al (1.49 keV), Ti (4.5 keV), and Mn (5.9 keV). ACIS is exposed to the ECS whenever it is in the stowed position (i.e., when Chandra passes through the radiation belts). Due to the build-up of contamination on the ACIS filters, the L-shell lines of Fe and Mn are no longer useful for calibration. Between launch and 2016, updated ACIS gain tables were released quarterly by co-adding three months of ECS data. The half-life of 55Fe is only 2.7 years, so it became necessary in 2016 to co-add six months of ECS data to achieve sufficient photon statistics to calibrate the ACIS gain. By 2022, it became necessary to supplement the ECS data with observations of astronomical targets. Since 2022, the ACIS calibration plan includes annual observations of the supernova remnant Cas A and the Perseus cluster of galaxies on the six imaging chips of ACIS (ACIS-I, S2 and S3). The remaining CCDs (ACIS-S0, S1, S4, and S5) are primarily used with the gratings when the photon energies are computed from the dispersion relation and not the detector gain. The 5.9 keV Mn emission line in the ECS and the 6.6 keV Fe line from the Perseus cluster of galaxies are now used to calibrate the high-energy gain. The Al and Ti lines in the ECS along with the 1.85 keV Si emission line in Cas A are now used to calibrate the mid-energy gain. Caveats:
|
Web Pages Papers/Memos
Presentations/Plots |
| ACIS | Spectral Resolution | 35 eV @ 1.5 keV 80 eV @ 6.0 keV |
The spectral resolution of the ACIS CCDs was initially calibrated with ground-based
data. The early radiation damage, and subsequent increase in CTI, produced a broadening
of the ECS lines, with the FWHM of the emission lines increasing with chipy (i.e., distance
from the read-out). This was partially accounted for by the CTI correction algorithm
developed early in the mission. The spectral resolution of the
CCDs is also sensitive to the focal plane temperature, with the FI CCDs being more
sensitive to temperature changes than the BI CCDs.
As the average focal plane temperature continued to increase during the mission,
it became necessary to develop a set of temperature-dependent rmfs. In 2024, a
set of temperature-dependent rmfs was released for the primary FI CCDs used for
imaging (ACIS-I and S2). The remaining CCDs are primarily used with the gratings
when the photon energies are computed from the dispersion relation and not the detector gain.
Work continues on developing a set of temperature-dependent
rmfs for the less temperature sensitive S3 CCD.
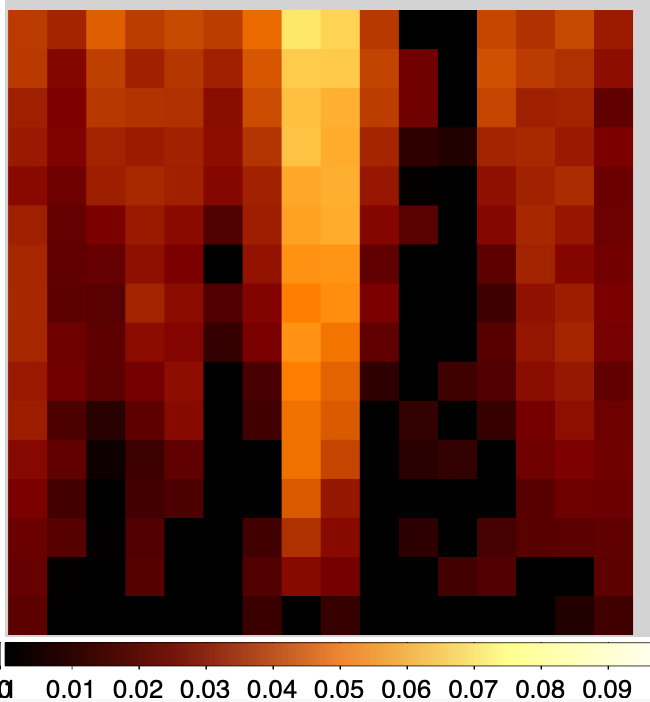
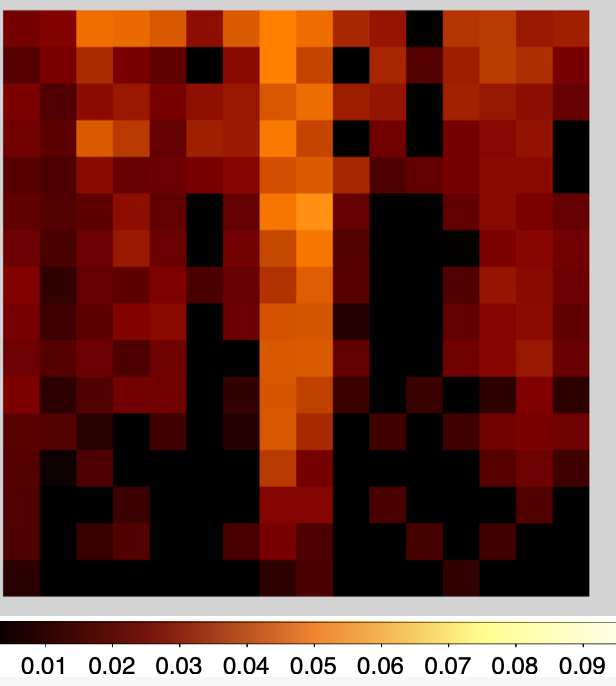
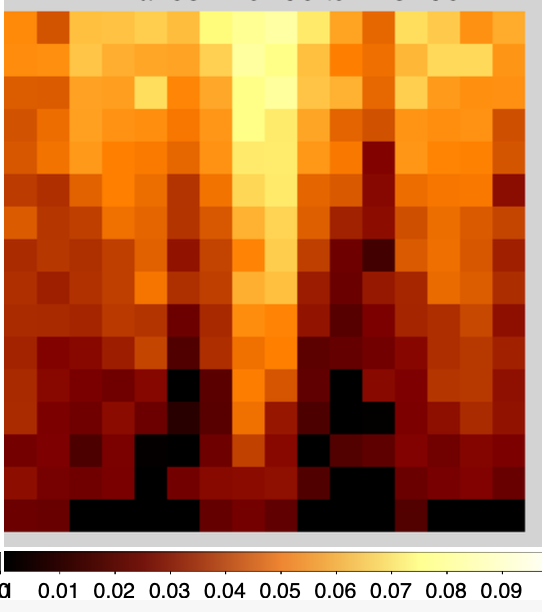
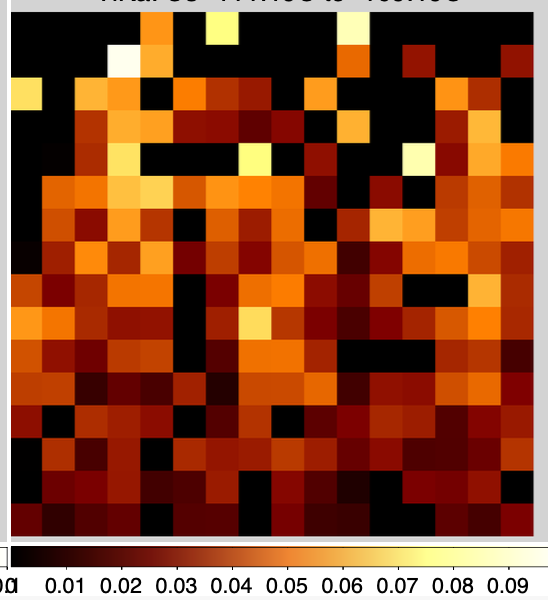
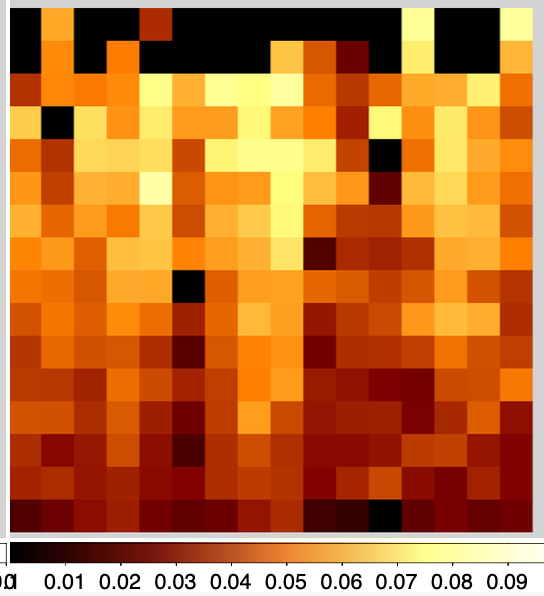
The quoted uncertainties given below for the spectral resolution of ACIS were determined by fitting a large sample of ECS data over a broad range of focal plane temperatures. Each of the three primary ECS lines (Al-Ka, Ti-Ka, and Mn-Ka) was fit in many regions on a CCD with a Gaussian profile and the appropriate CALDB rmf for the given location and focal plane temperature. The rms scatter in the best fit FWHM of the gaussian model across a CCD is then taken to be the uncertainty in the spectral resolution of the CCD at a given focal plane temperature. Caveats:
|
Web Pages Presentations/Plots |
| ACIS | Effective Area | 5% | The ACIS effective area is a convolution of the HRMA effective area,
the transmission of the optical blocking filters, and the ACIS QE.
Over the course of the mission, out-gassed molecular material has continued
to accumulate on the cold ACIS filters. This is the primary mechanism that
has lead to a changing ACIS effective area over time. The optical depth
of the contaminant on the ACIS filters has been monitored with periodic
imaging observations of the rich cluster of galaxies Abell 1795 and the supernova
remnant E0102-72, and grating observations of the blazar Mkn 421. To account for the build-up
of contamination on the ACIS filters, the Chandra Calibration Team has released
updates to the ACIS contamination model on approximately a yearly timescale.
The contaminant primarily absorbs soft X-Ray photons, i.e., below ~2 keV.
Above ~2 keV, the contaminate is mostly transparent and high energy effective area of
ACIS has remained very stable.
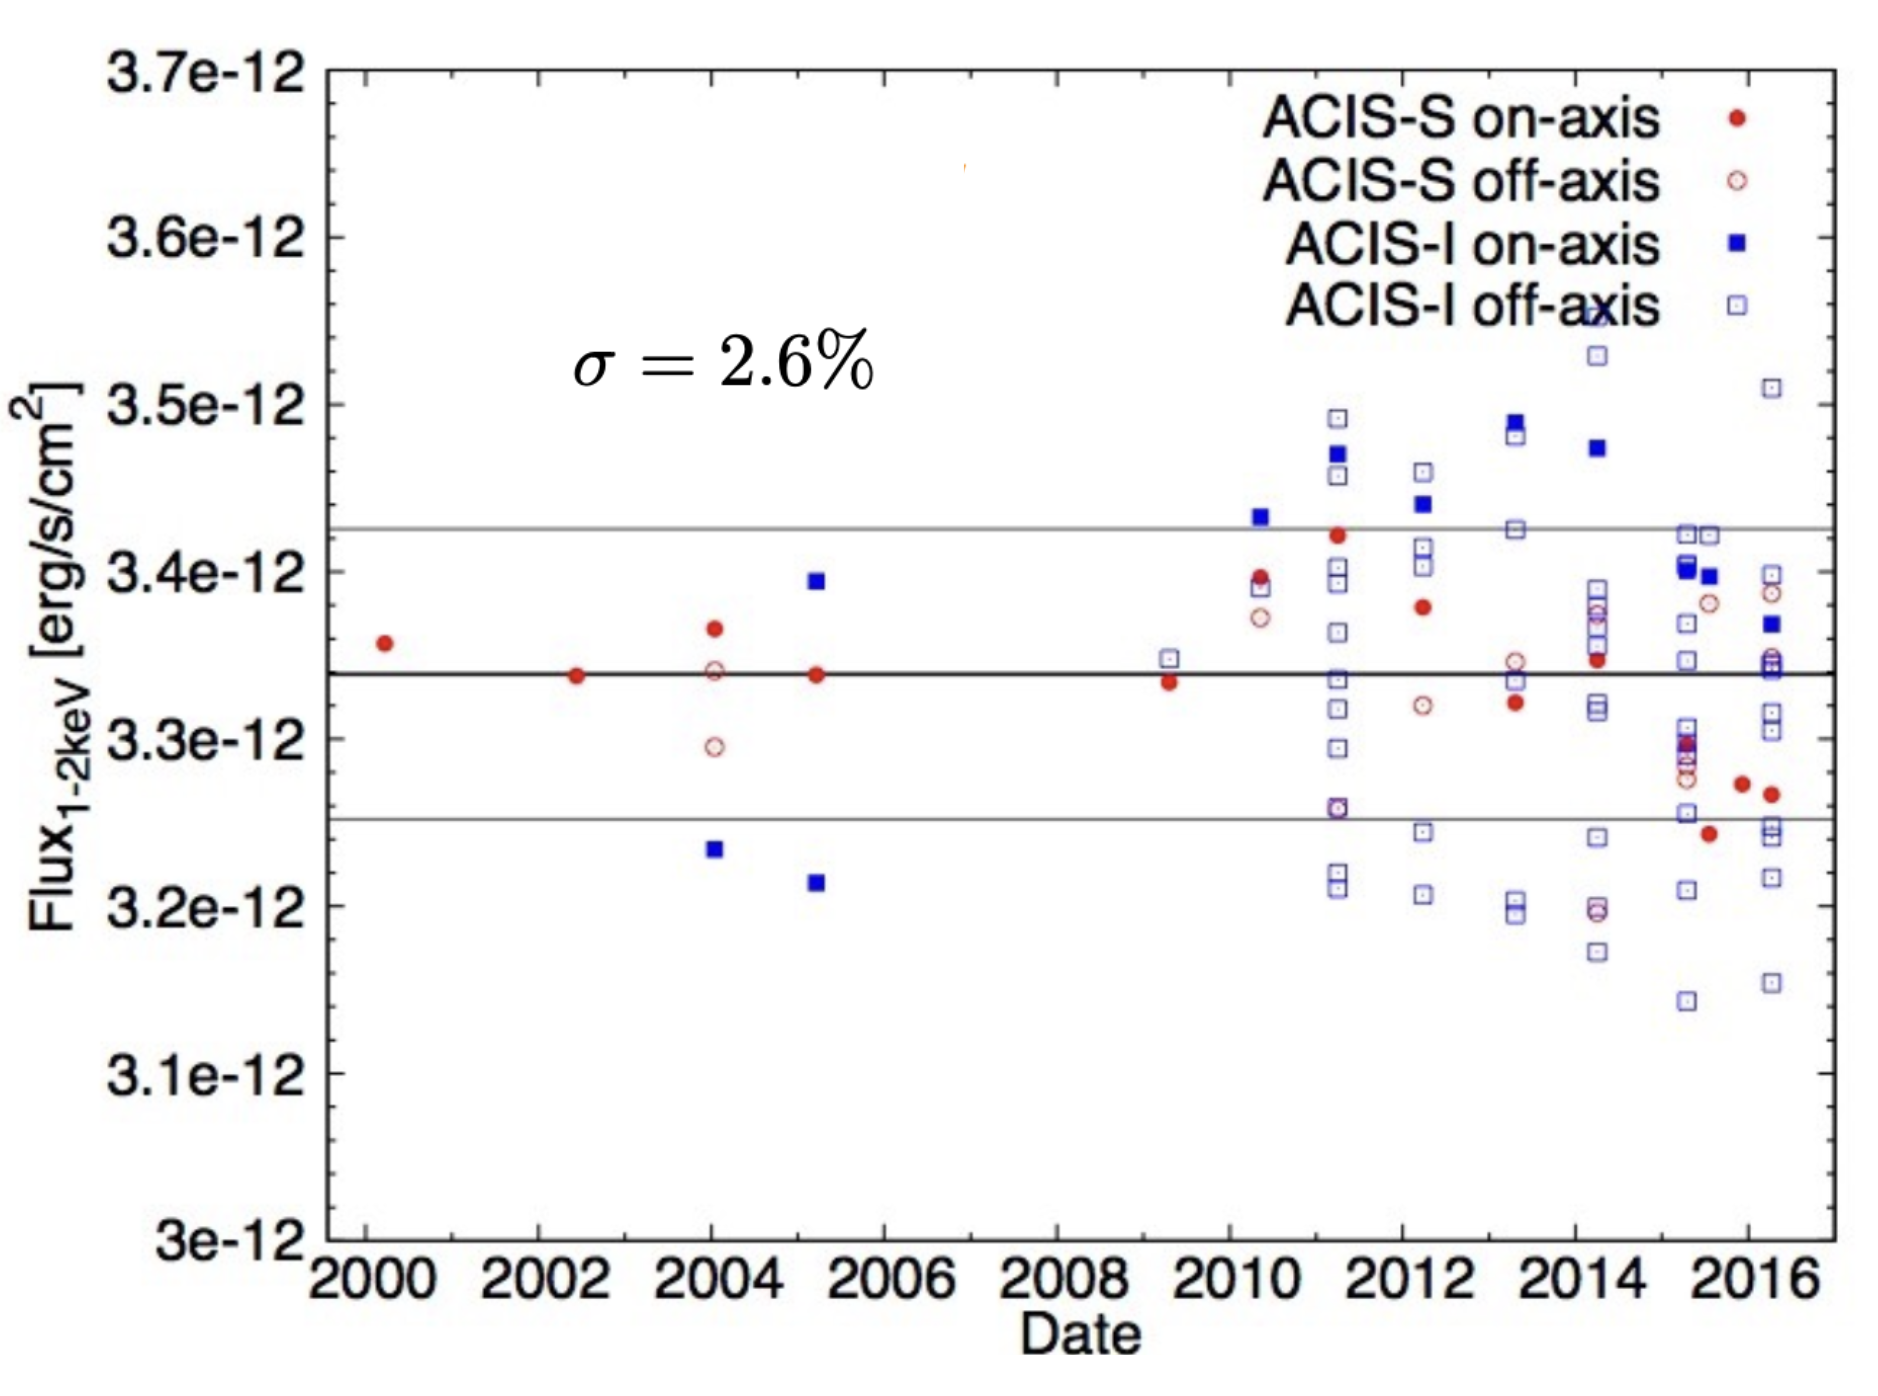
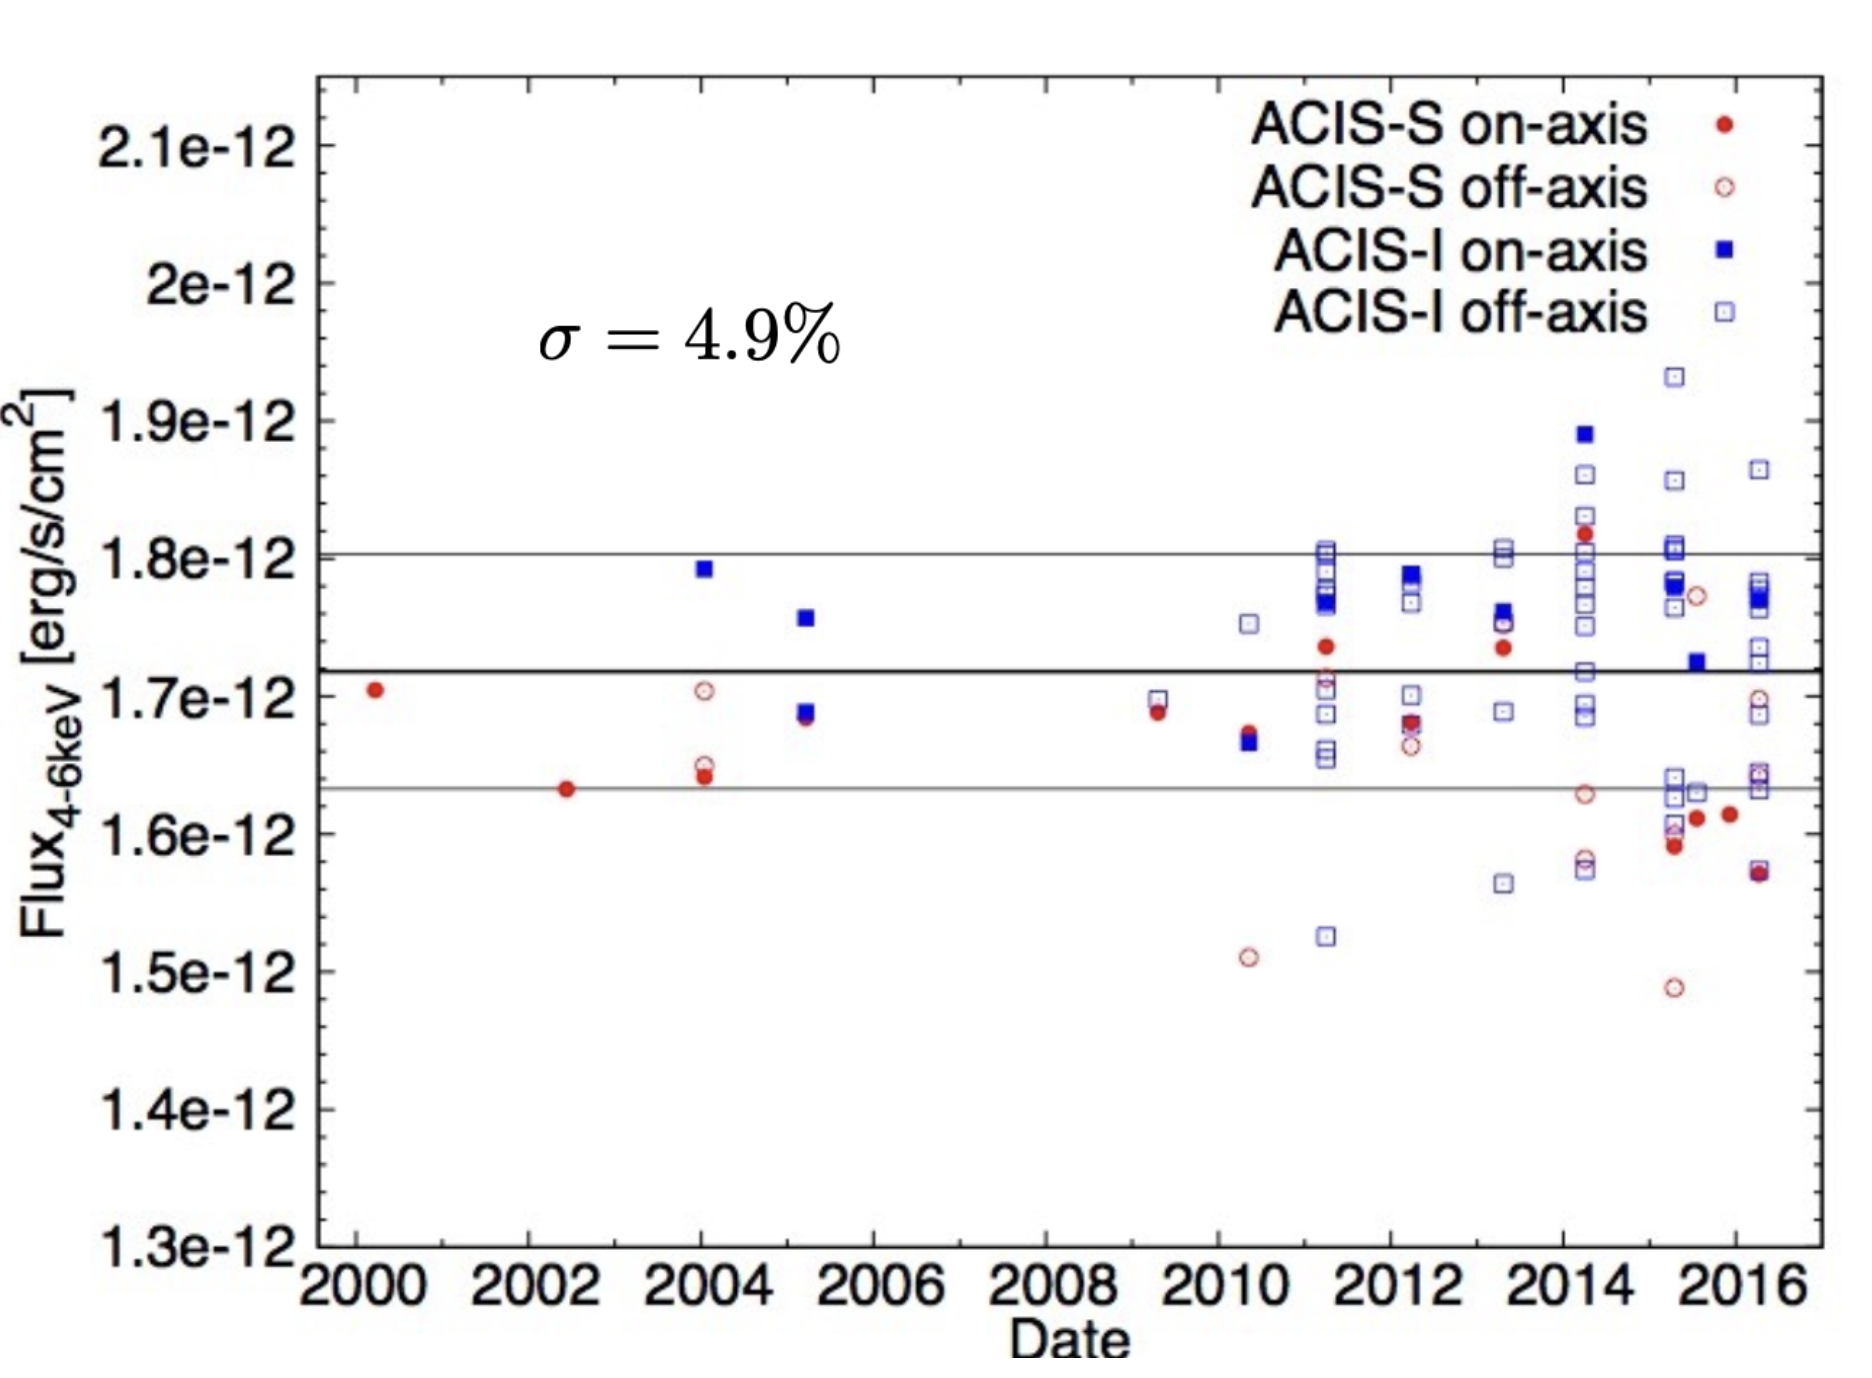
The uncertainty in the ACIS relative effective area is based on the rms scatter in broad band fluxes for a sample of steady calibration sources (e.g., supernova remnants and clusters of galaxies) that have been periodically observed with ACIS over the course of the mission. The uncertainty in the absolute ACIS effective area is a more difficult problem and can best be accessed through cross-calibration studies with other X-ray missions, such as those conducted by the International Astronomical Consortium for High Energy Astrophysics (IACHEC). Caveats:
|
Papers/Memos
Presentations/Plots |
| HRC | Effective Area | 3% | The HRC effective area is a convolution of the HRMA effective area, the
transmission of the UV Ion shield, and the HRC. As mentioned
above the HRMA effective area has been stable over the course of the mission.
Periodic observations of Vega have shown that the transmission of the
UV Ion shield has also been very stable. The QE of both HRC
detectors has been monitored throughout the mission with periodic
gratings and imaging observations of steady sources
(primarily the white dwarf HZ43 for low energy calibration and the supernova
remnant G21.5-09 for high energy calibration). The QE of both HRC detectors
has changed over the course of the mission due to a steady decline in the
gain of both HRC detectors. As the gain decreases, more events fall below the
Low Level Discriminator (LLD) and these events are not telemetered to the ground.
This QE loss due to the decreasing detector has a wavelength dependence, with
the longer wavelength photons affected the most.
The HRC-S QE has been slowly declining since launch, while the HRC-I QE
was stable until about 2015 and then began to decline. Due to the
decreasing detector gain and subsequent lower count rates,
the High Voltage of the detectors has been raised several times
to increase the observed count rates of the steady sources used for HRC QE calibration.
For the HRC-S, the High Voltage was increased in 2012, 2021, and 2024.
For the HRC-I, the high voltage was increased in 2021 and 2024. The latest
increase in High Voltage restored the HRC detectors to their sensitivities approximately
two years prior. Due to the steady decline in QE of the HRC detectors,
QE tables for both detectors have been released to the public via the CALDB
on roughly an annual timescale. In addition, new QE tables for the HRC
detectors are released anytime the High Voltage is raised.
The rms scatter in the computed fluxes of HRC-I and HRC-S observations of HZ43
and G21.5-09 taken over the course of the mission is approximately 3%. Caveats:
|
Web Pages Papers/Memos
Presentations/Plots |
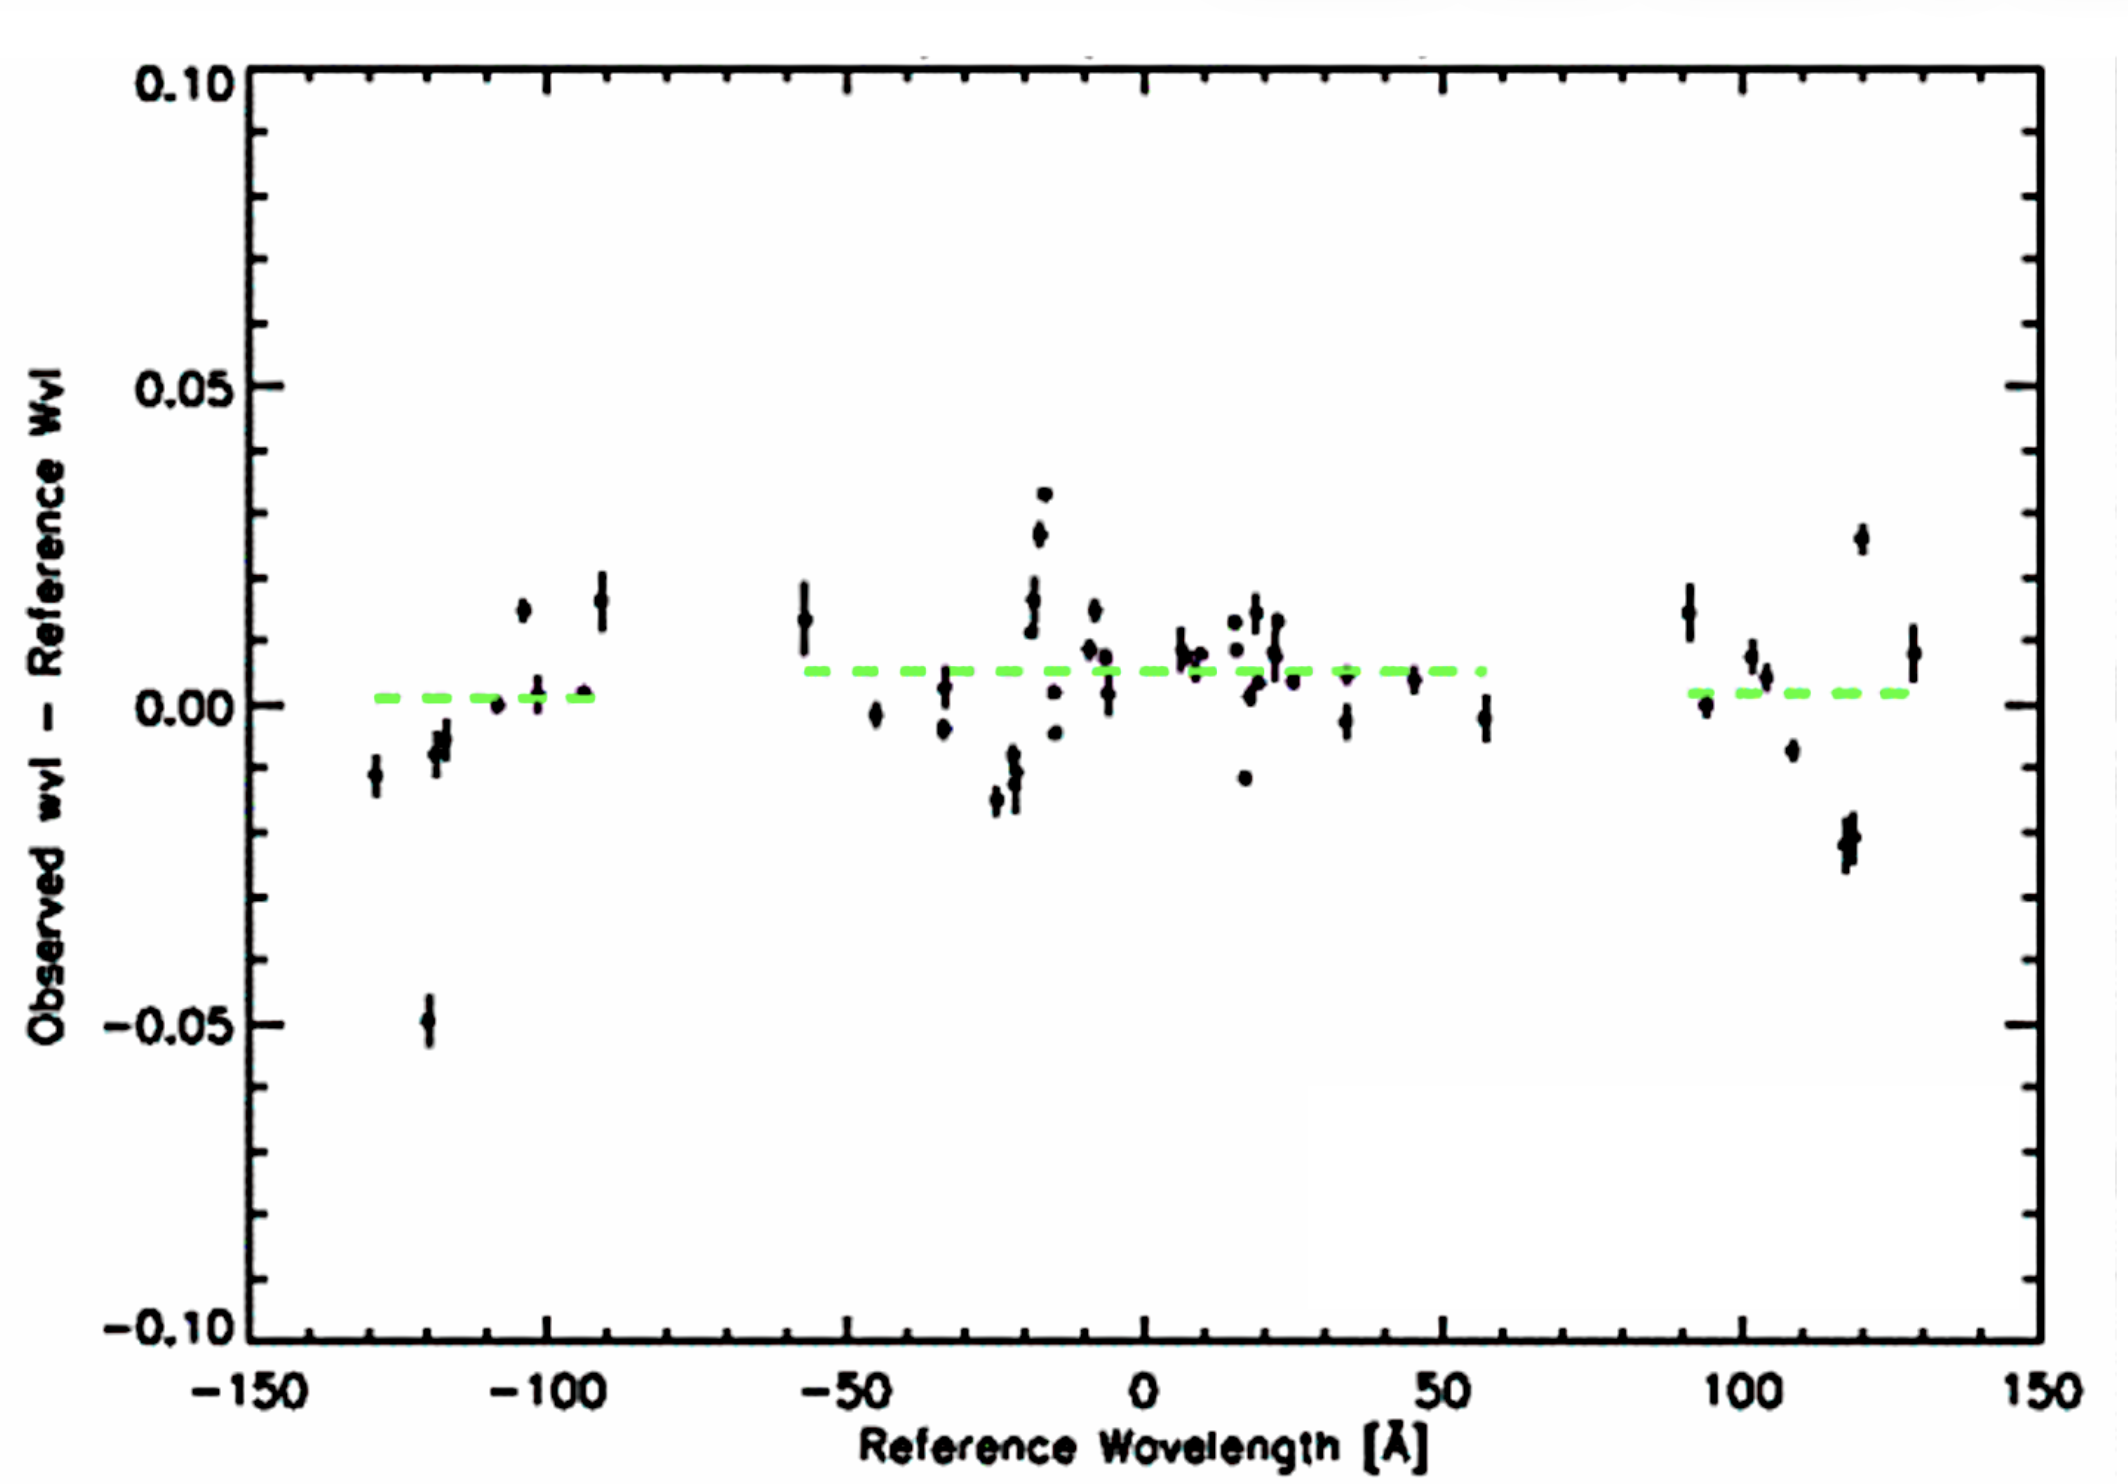
| LETG/HRC-S | Absolute Wavelength Scale | 0.013 Å | The LETG/HRC-S dispersion relation depends on how well the HRC-S
follows the Roland Torus, the gaps between the three HRC-S
plates, and the HRC-S de-gap map. The LETG/HRC-S dispersion
relation has been very stable, but has been fine tuned with
updates to the gaps between the three HRC-S plates, and updates
to the HRC-S de-gap map in 2012 and 2018. The coronal line
source Capella has been observed with the LETG/HRC-S at periodic
intervals over the course of the mission to monitor the dispersion relation.
The uncertainty in the absolute wavelength of dispersed LETG/HRC-S
spectra is computed from the rms scatter between the lab and observed
wavelengths for emission lines detected
in LETG/HRC-S observations of Capella. The quoted uncertainty
is derived from emission lines detected over the full
wavelength range of LETG/HRC-S spectra. Caveats:
|
Web Pages Papers/Memos
Presentations/Plots |
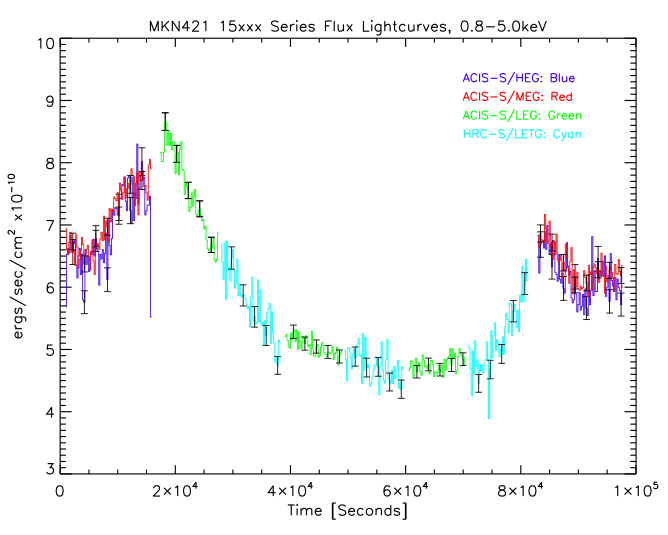
| LETG/HRC-S | Effective Area | 10% | The LETG/HRC-S effective area is a convolution of the HRMA effective area, the transmission efficiency of the LETG, the transmission of the UV ION shield of the HRC-S, and the QE of the HRC-S. Only the HRC-S QE has varied with time (see the HRC section above). All other components have been very stable over the course of the Chandra mission. While the transmission efficiency of the LETG has been stable, the transmission efficiency of the gratings was updated to improve internal cross-calibration in 2004 and 2011. To maintain a stable LETG/HRC-S effective area calibration, the CXC calibration team carries out yearly LETG/HRC-S observations of the white dwarf HZ 43, a stable soft X-ray point source. Since all hard X-ray point sources are variable, a set of interleaved observations were completed each year that cycle through all the grating/detector combinations while Chandra observes the same target over most of the mission. In most cases, the target was the blazar Mkn 421. These interleaved observations were discontinued recently due to the imposed limitations with HRC-S observations. The interleaved observations were used to cross-calibrate between the different grating/detector combinations. Over a broad wavelength range, the uncertainty in the relative effective areas of all grating/detector combinations is approximately 10%. |
Web Pages Papers/Memos Presentations/Plots |
| HETG/ACIS-S | Absolute Wavelength Scale | 0.011 Å MEG 0.006 Å HEG |
The HETG/ACIS-S dispersion relations (both the HEG and MEG) have been very stable over the course of the Chandra mission. As with the LETG, the HETG dispersion relations have been monitor with periodic observations of the emission-line source Capella. The uncertainty in the absolute wavelength of dispersed HETG/ACIS-S spectra is computed from the rms scatter between the lab and observed wavelengths for emission lines detected in HETG/ACIS-S observations of Capella. |
Web Pages Papers/Memos Presentations/Plots |
| HETG/ACIS-S | Effective Area | 10% | The HETG/ACIS-S effective area is a convolution of the HRMA effective area, the transmission efficiency of the HETG (both the MEG and HEG), the transmission of the optical blocking filter on ACIS-S and the QE of ACIS-S. The transmission efficiencies of the HEG and MEG have been very stable, but adjustments to the HEG and MEG transmission efficiencies were released in 2004, 2005, and 2011 to improve cross-calibration between the different detector/gratings combinations. Changes to the transmission of the ACIS optical blocking filters due to the build-up of molecular contamination have been accounted for through the approximately yearly updates to the ACIS contamination model. All grating/detector effective areas, including the HETG/ACIS-S, were monitored with a set of yearly interleaved observations of the blazar Mkn 421. These observations are discussed in the LETG section above. Over a broad wavelength range, the uncertainty in the relative effective areas of all grating/detector combinations is less than 10%. |
Web Pages Papers/Memos
Presentations/Plots |
| ACIS-I3 | ACIS-S3 | |
|
|---|
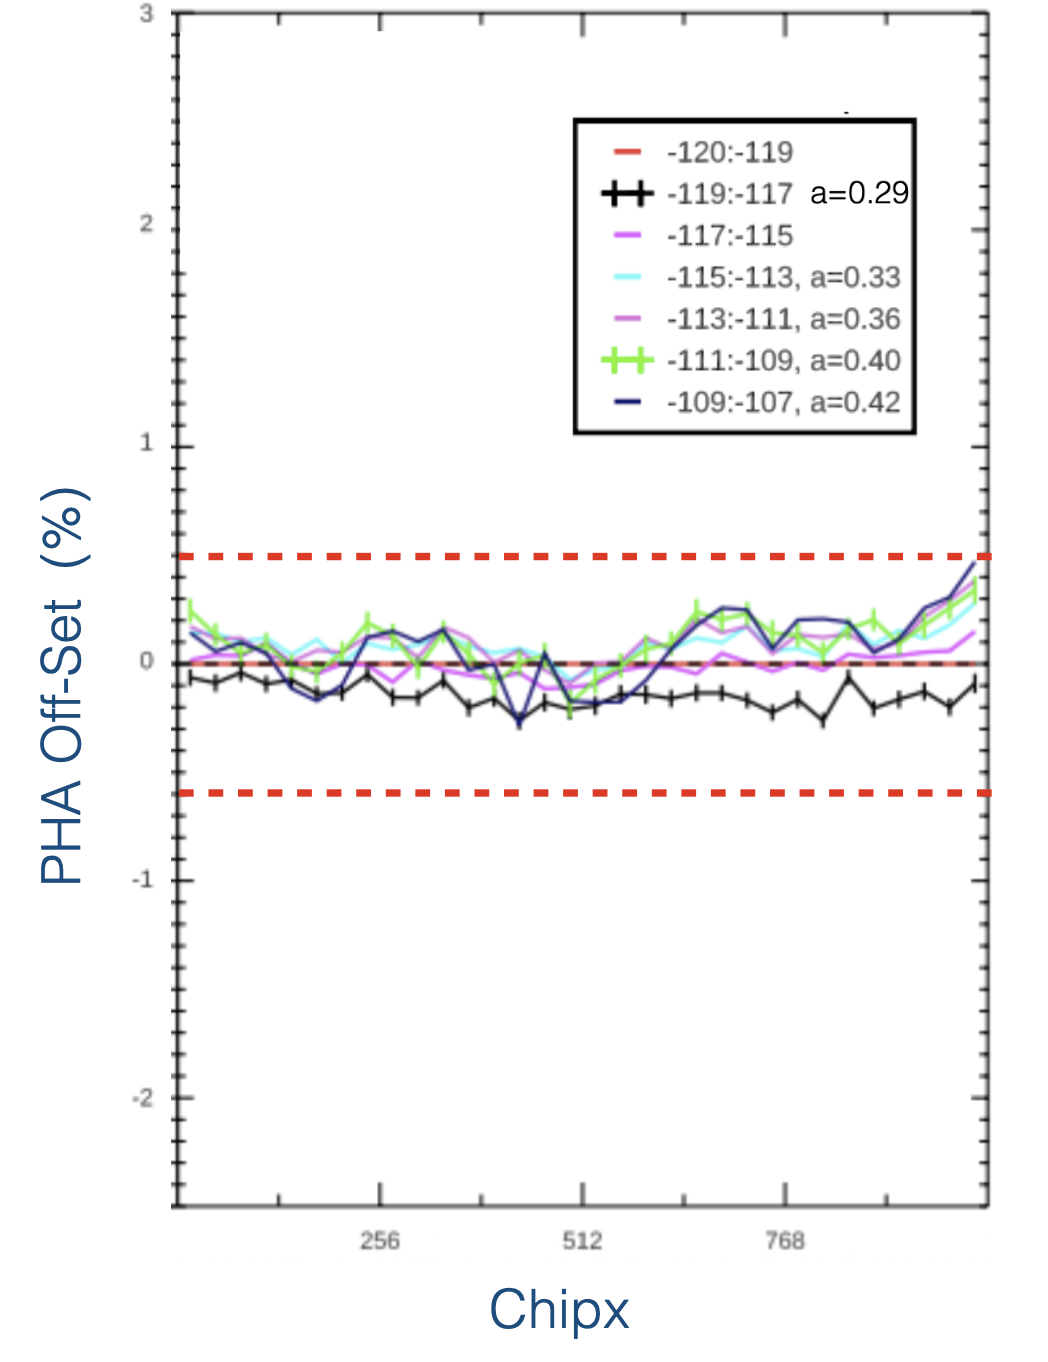
ACIS Gain vs. Focal Plane Temperature
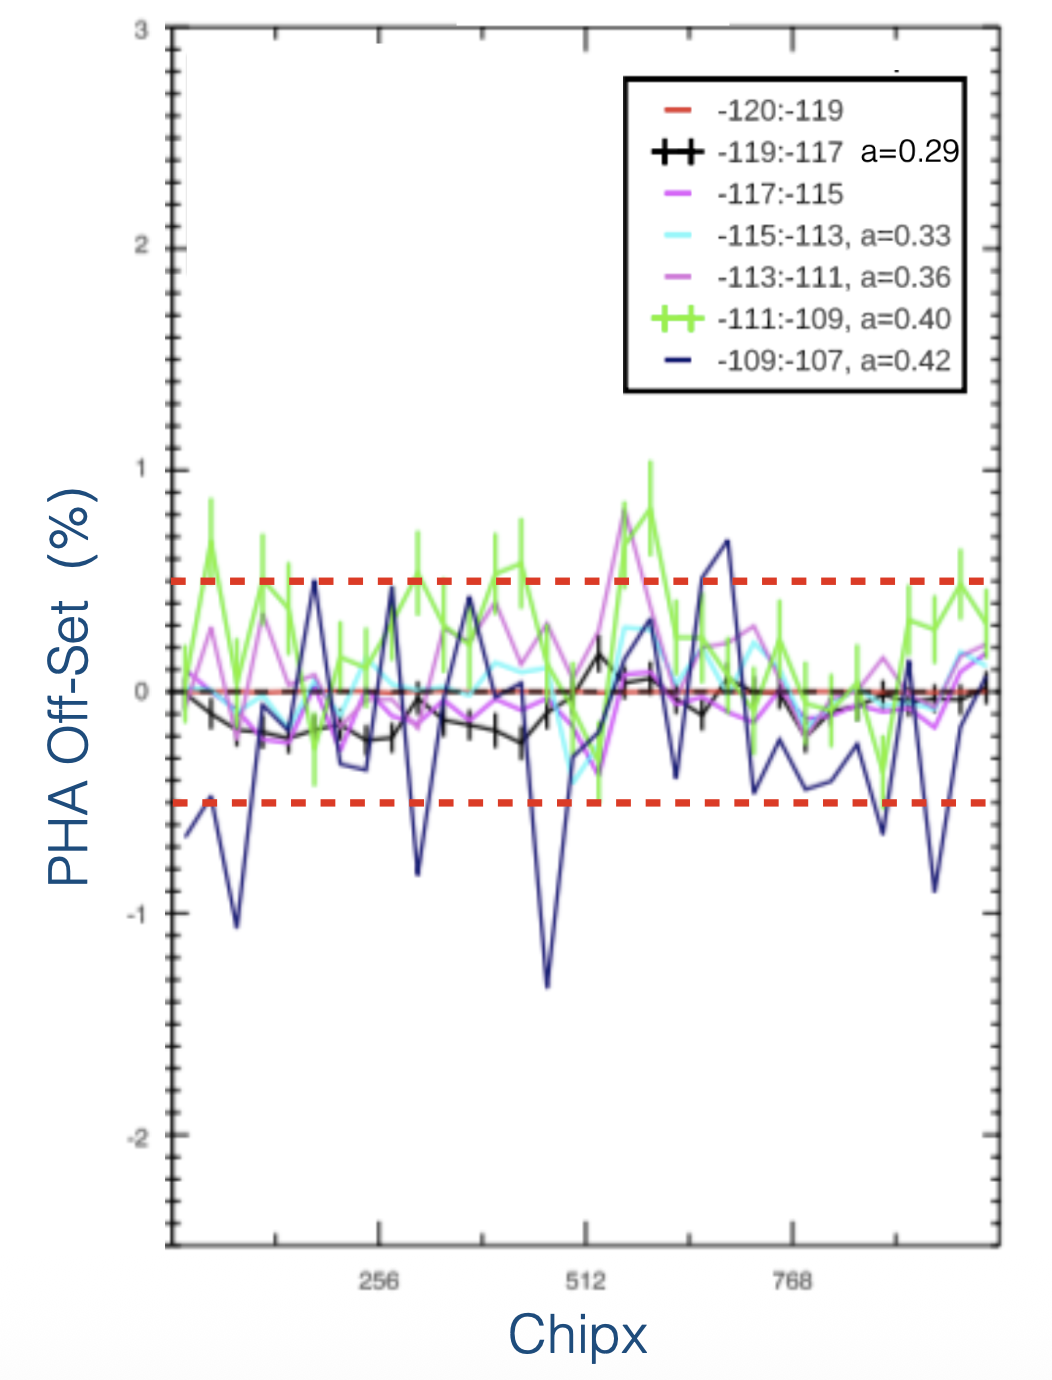
| ACIS-I3 @ Al-Ka | ACIS-I3 @ Mn-Ka | 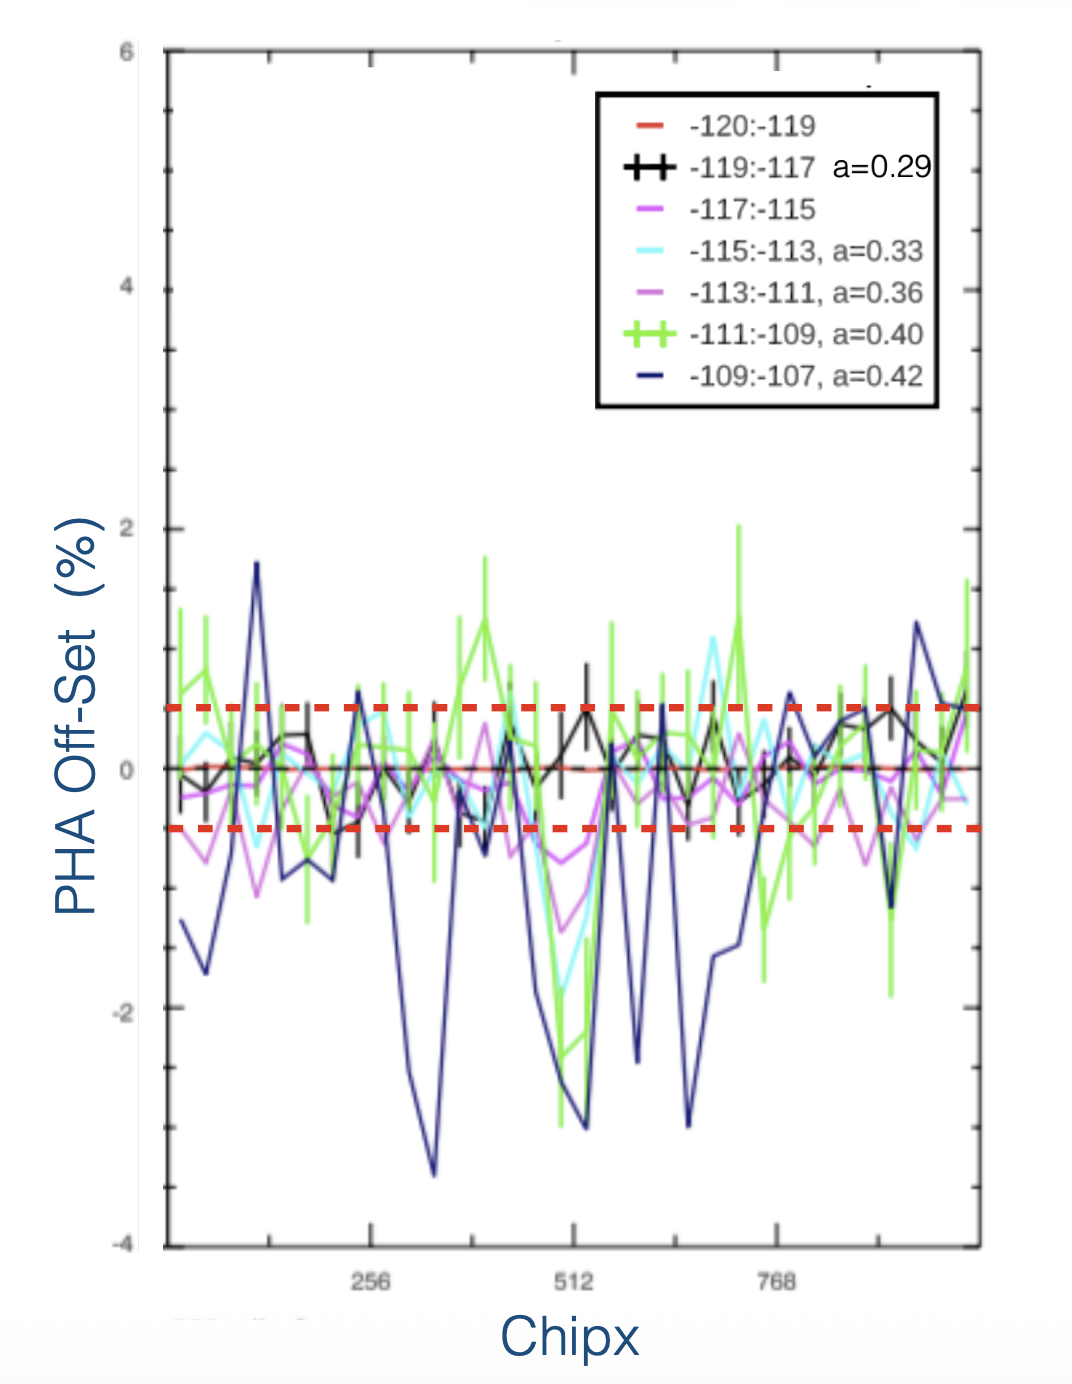 |
 |
|---|---|
| ACIS-S3 @ Al-Ka | ACIS-S3 @ Mn-Ka | 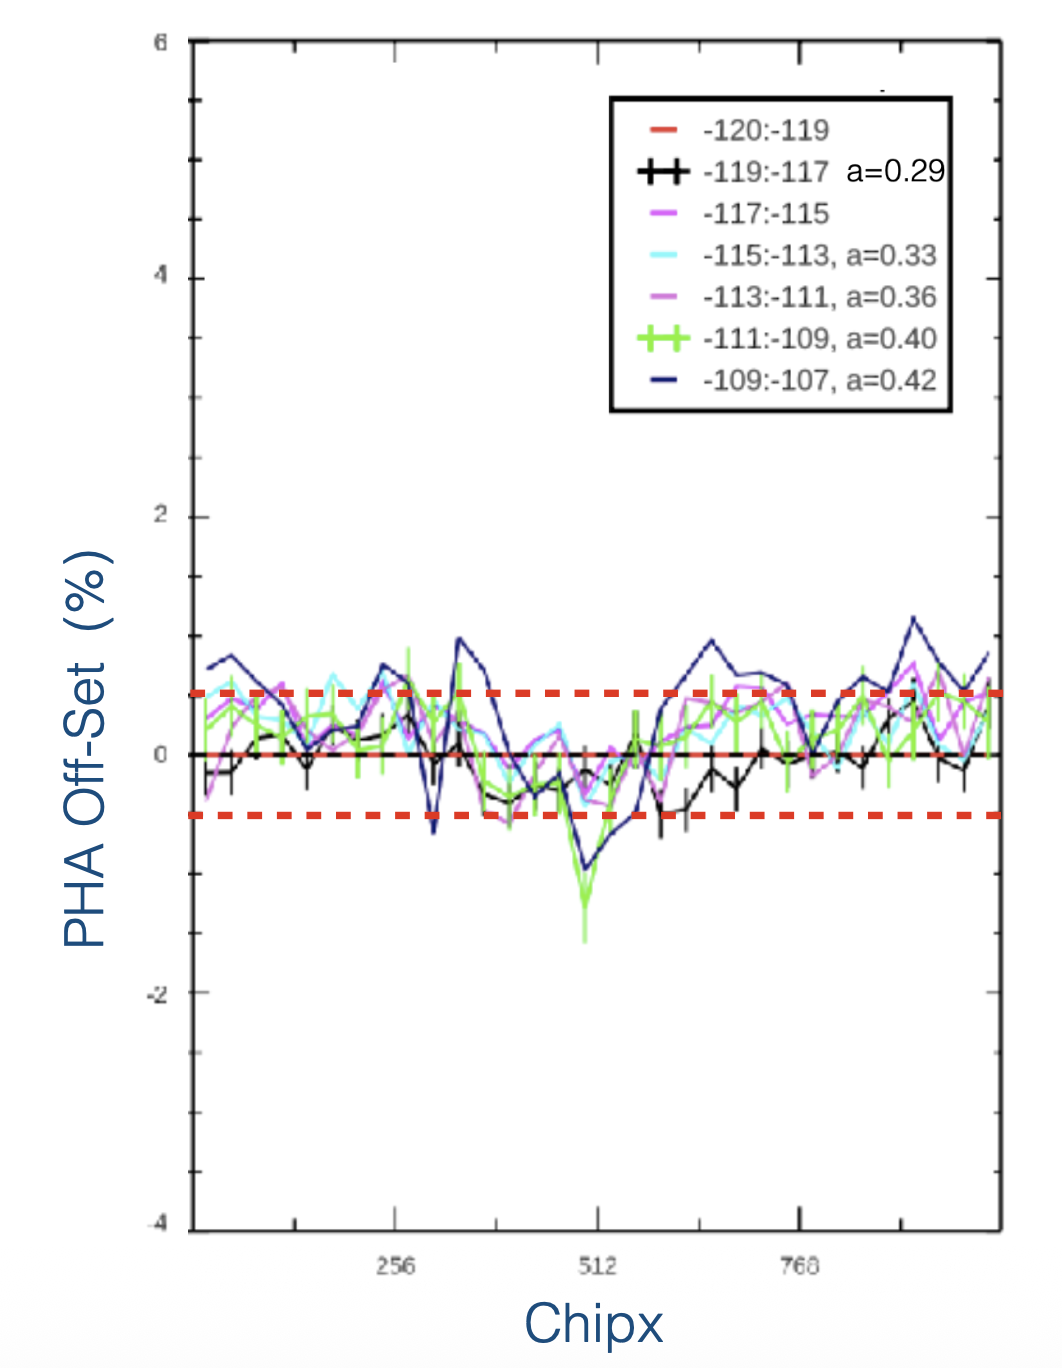 |
 |
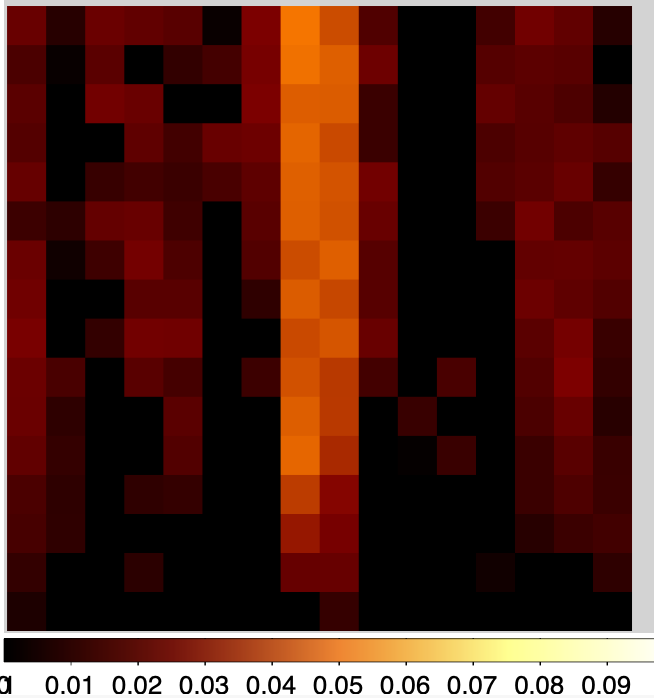
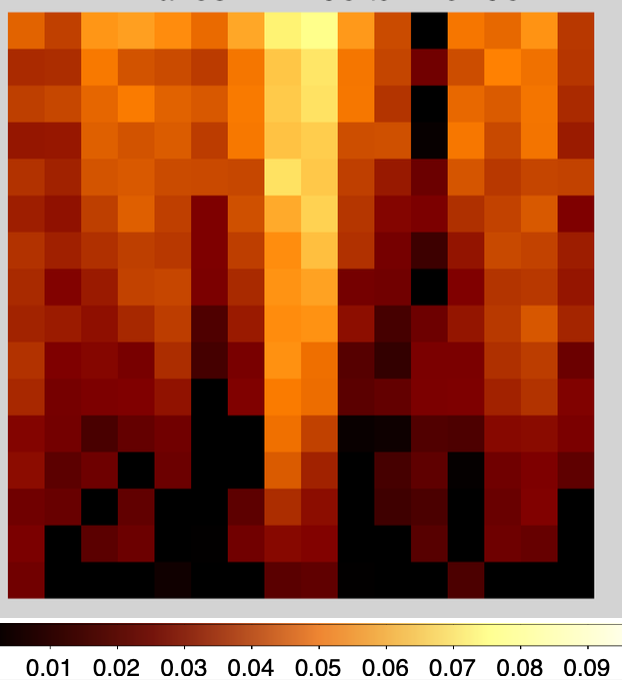
ACIS FWHM vs. Focal Plane Temperature
| FP Temp = -119:117 |
|---|
| ACIS-I3 @ Al-Ka | ACIS-I3 @ Ti-Ka | ACIS-I3 @ Mn-Ka | 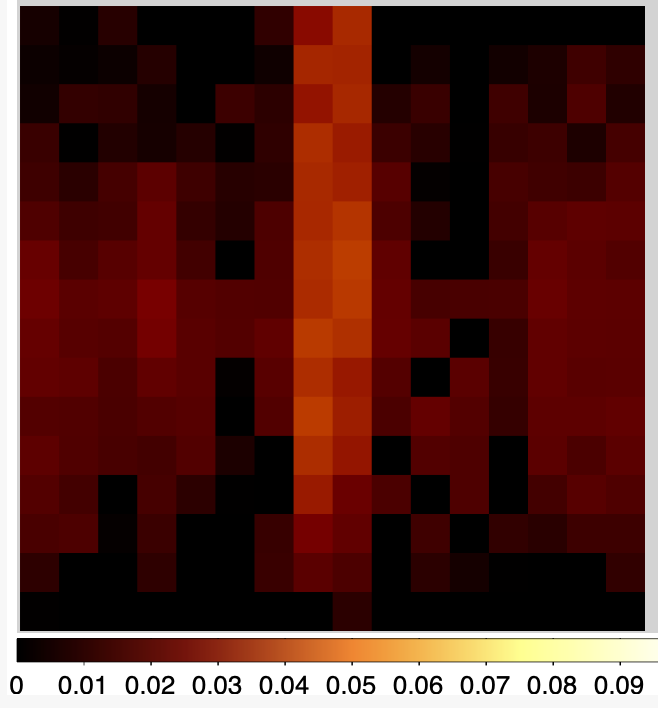 |
 |
 |
 |
|---|
| Uncertainties in the I3 FWHM | 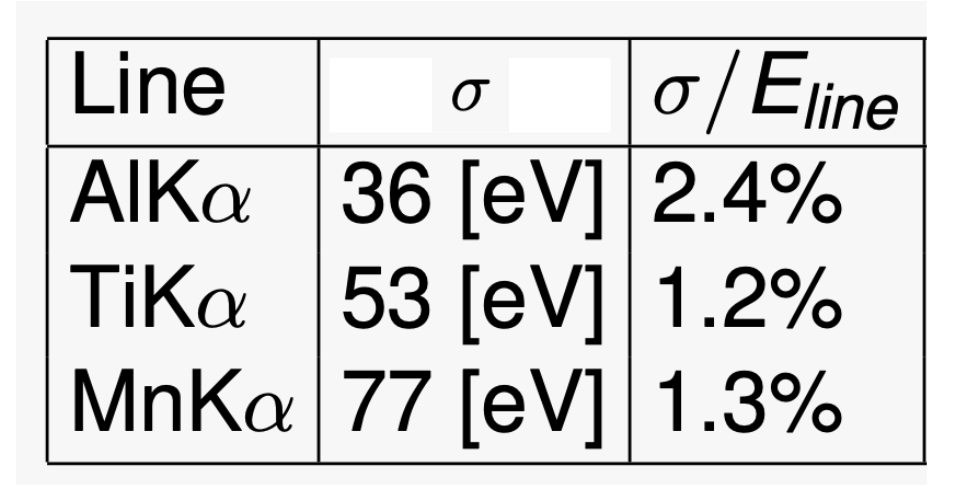 |
|---|
| FP Temp = -117:115 |
|---|
| ACIS-I3 @ Al-Ka | ACIS-I3 @ Ti-Ka | ACIS-I3 @ Mn-Ka | 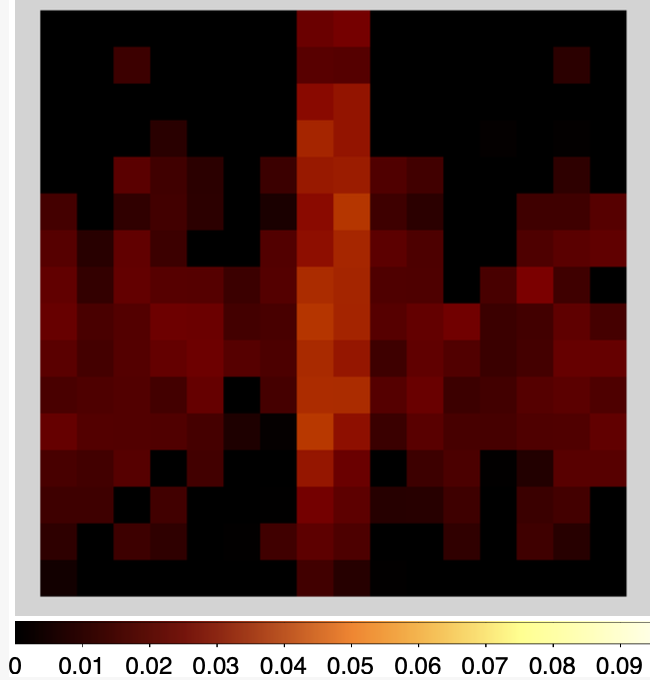 |
 |
 |
|---|
| Uncertainties in the I3 FWHM | 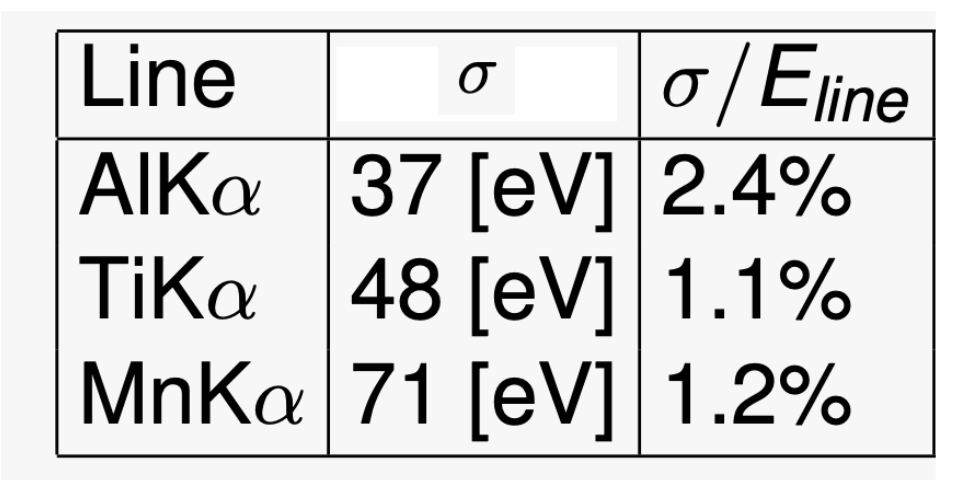 |
|---|
| FP Temp = -115:113 |
|---|
| ACIS-I3 @ Al-Ka | ACIS-I3 @ Ti-Ka | ACIS-I3 @ Mn-Ka | 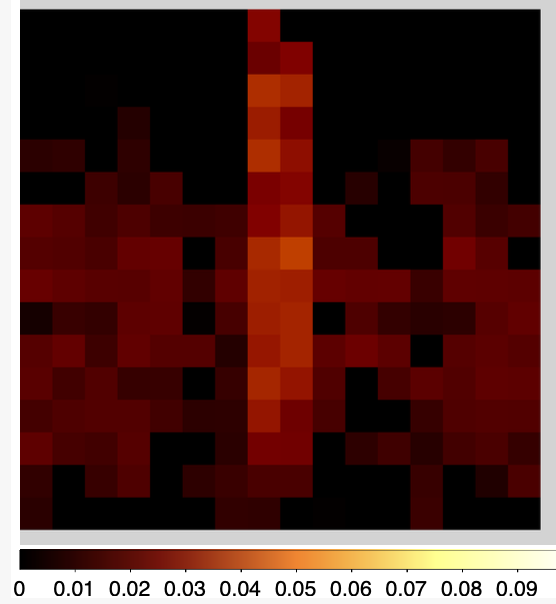 |
 |
 |
|---|
| Uncertainties in the I3 FWHM | 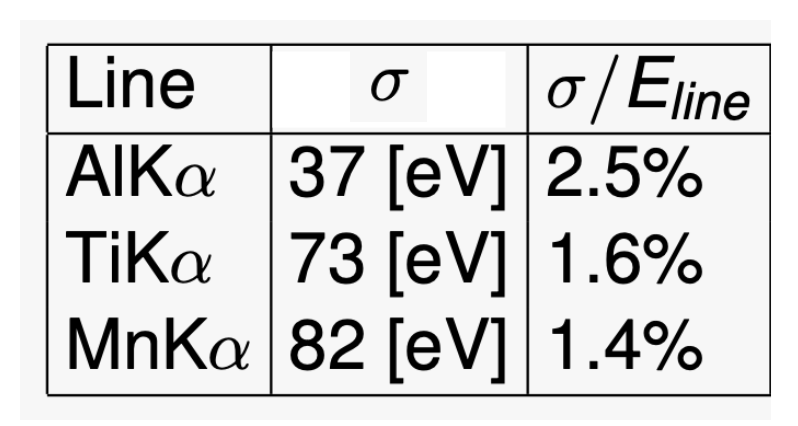 |
|---|
| FP Temp = -113:111 |
|---|
| ACIS-I3 @ Al-Ka | ACIS-I3 @ Ti-Ka | ACIS-I3 @ Mn-Ka | 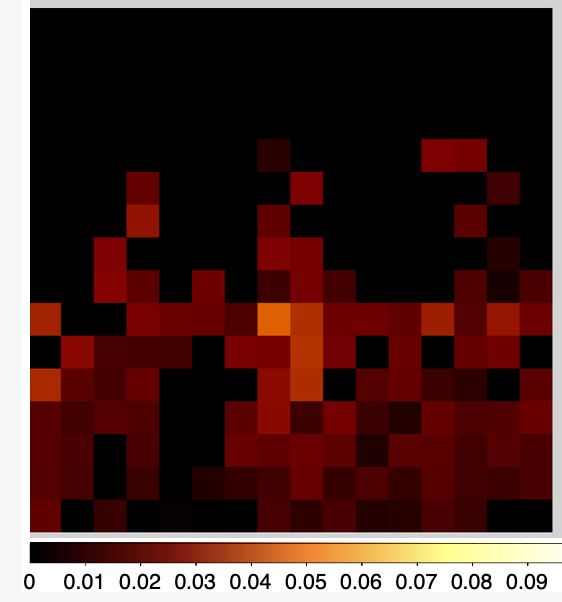 |
 |
 |
|---|
| Uncertainties in the I3 FWHM | 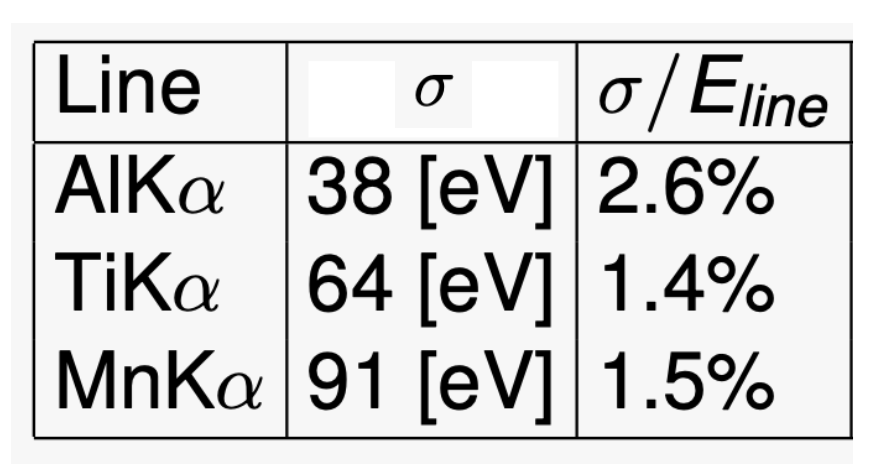 |
|---|
| 0.5 - 1.0 keV | 1.0 - 2.0 keV | 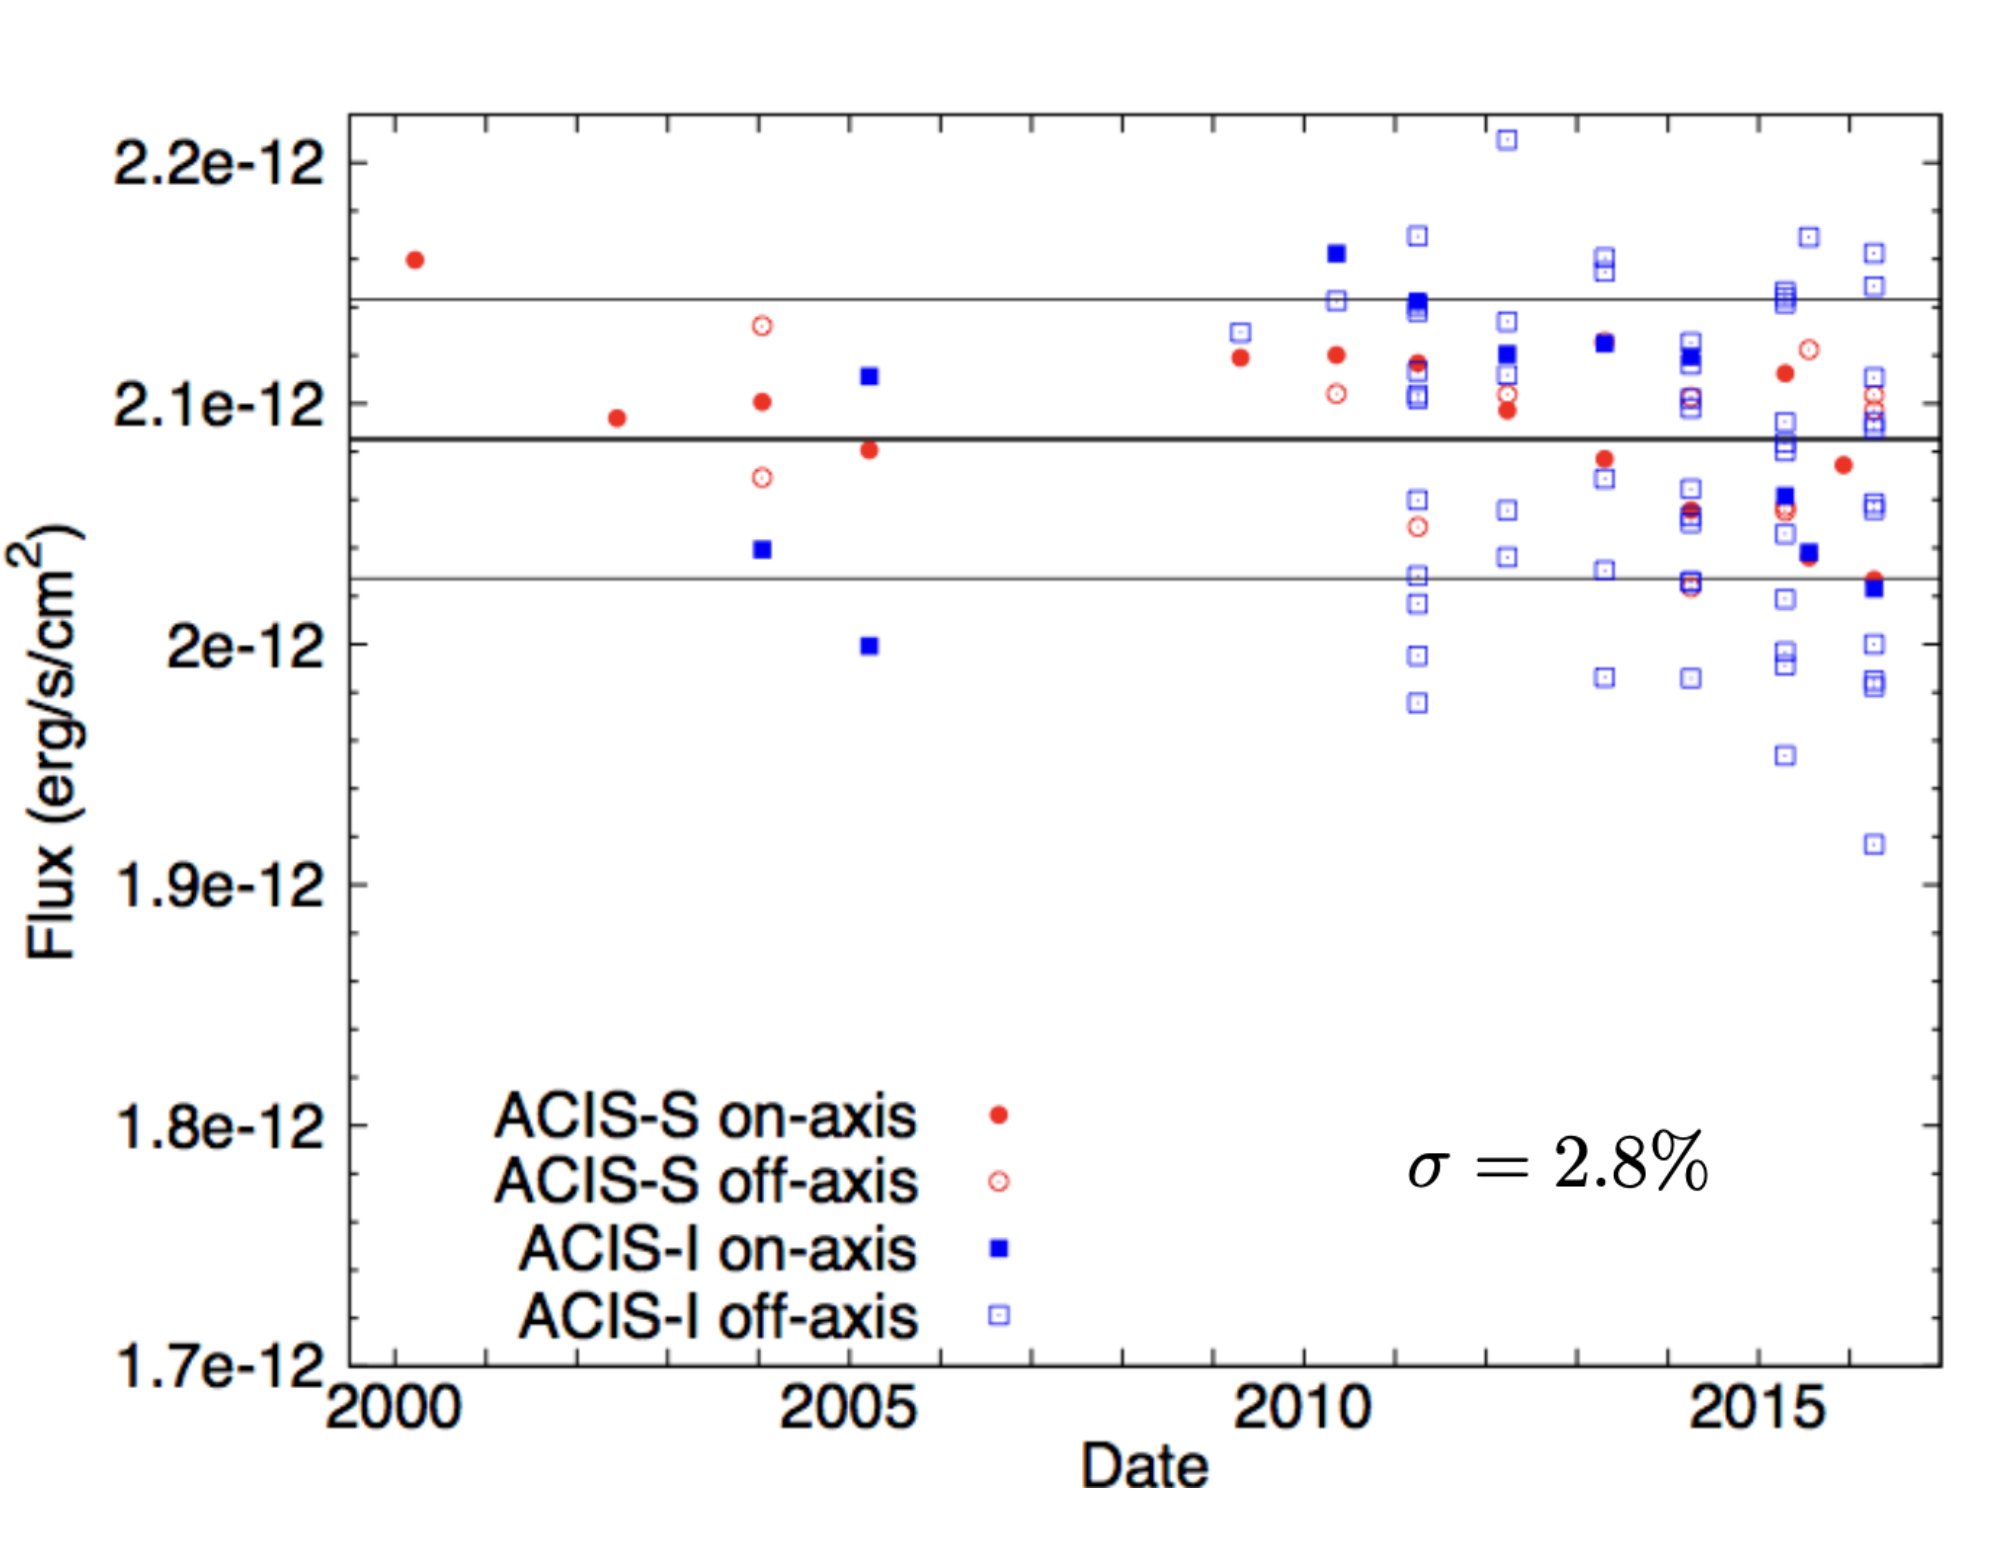 |
 |
|---|
| 2.0 - 4.0 keV | 4.0 - 6.0 keV | 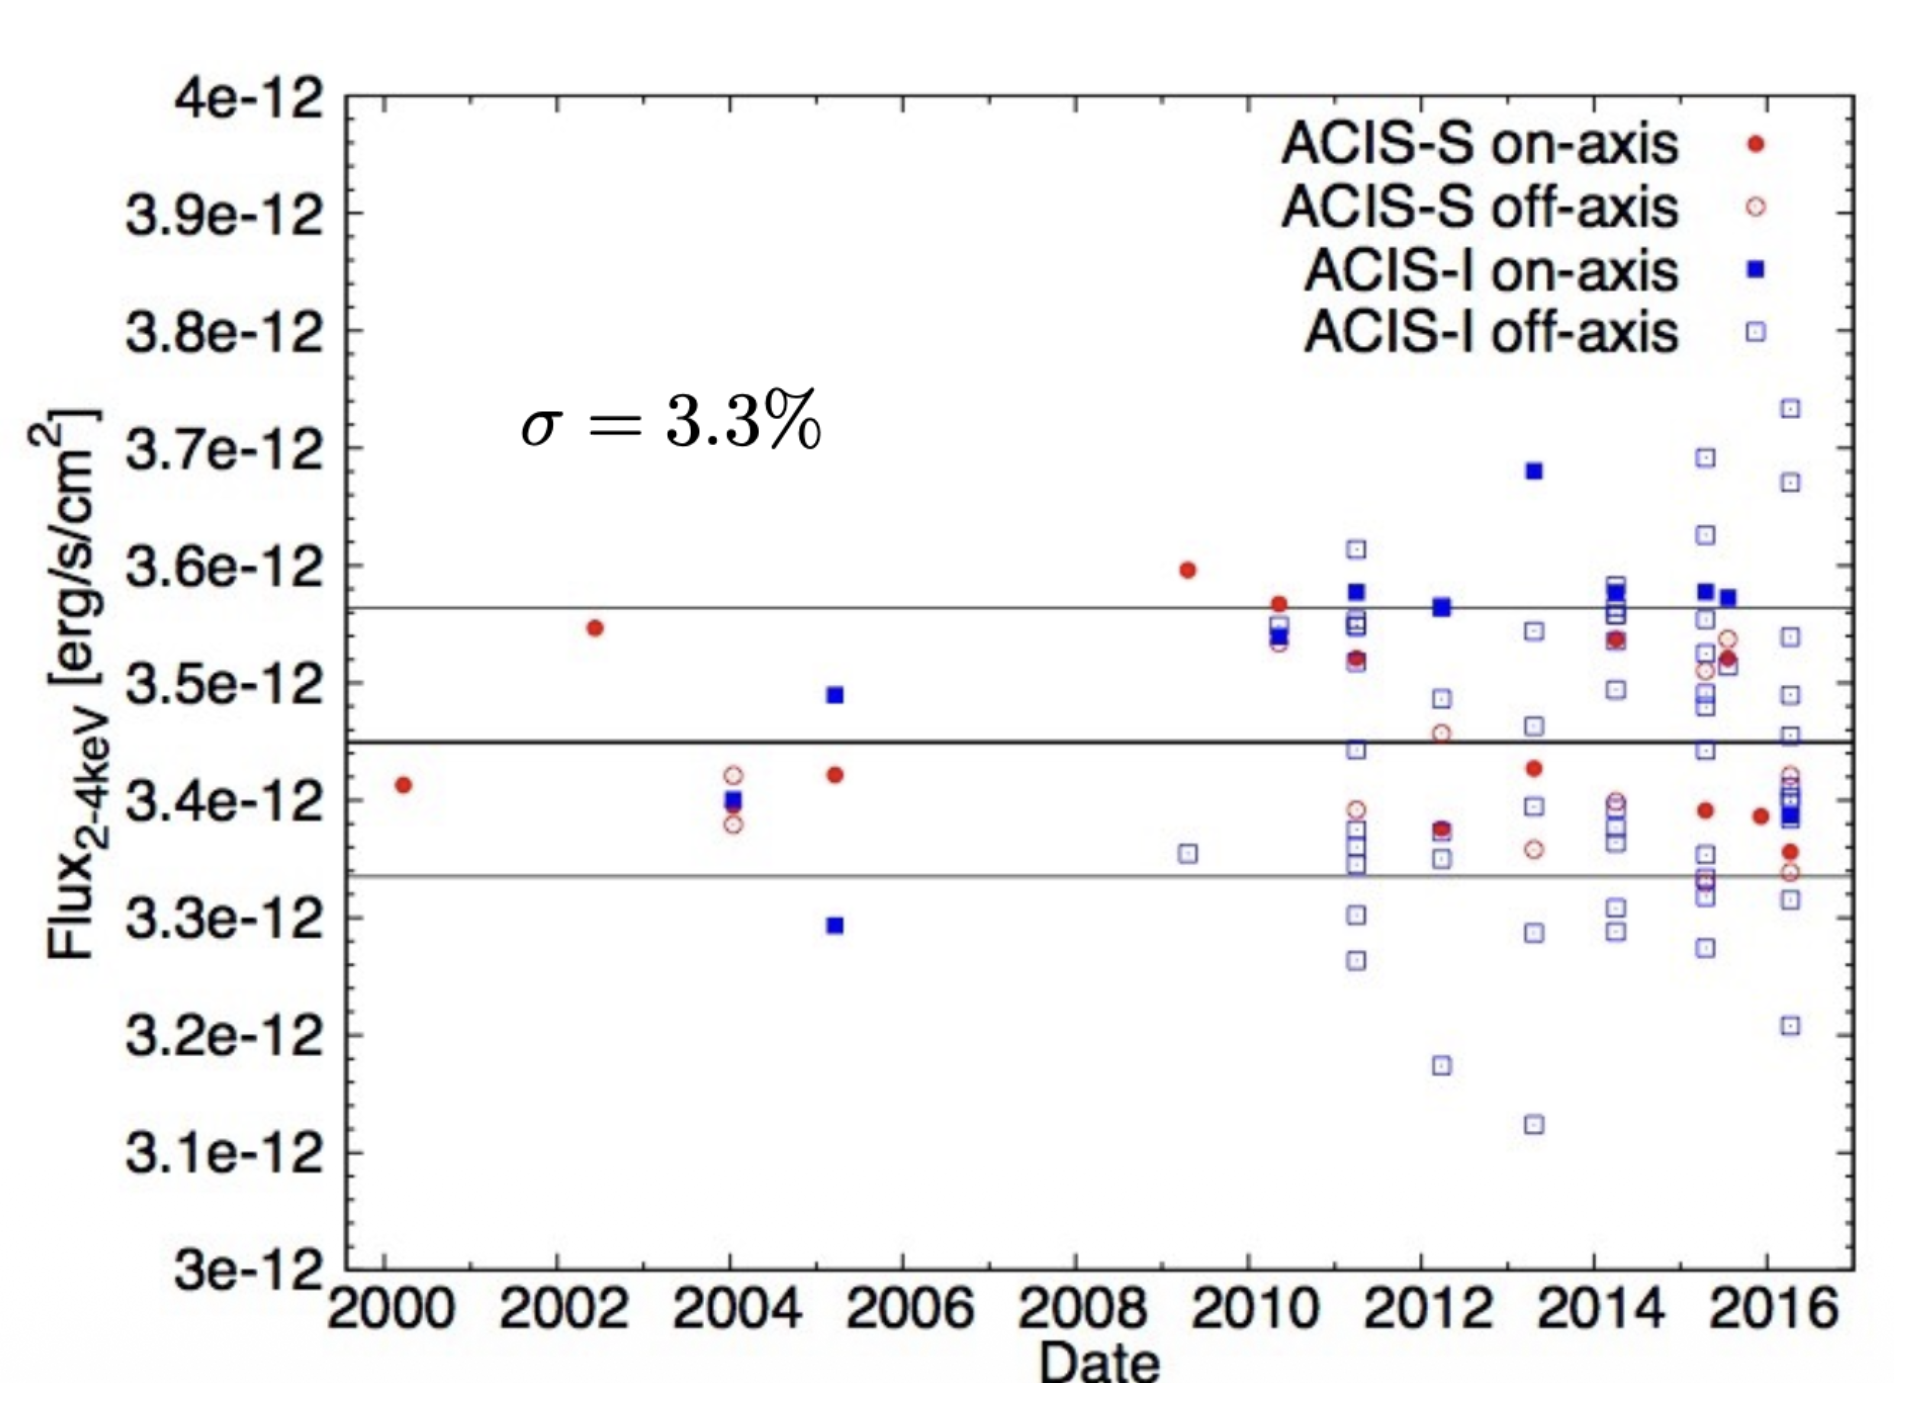 |
 |
|---|
| HZ 43 Count Rates | HZ43 Fluxed | 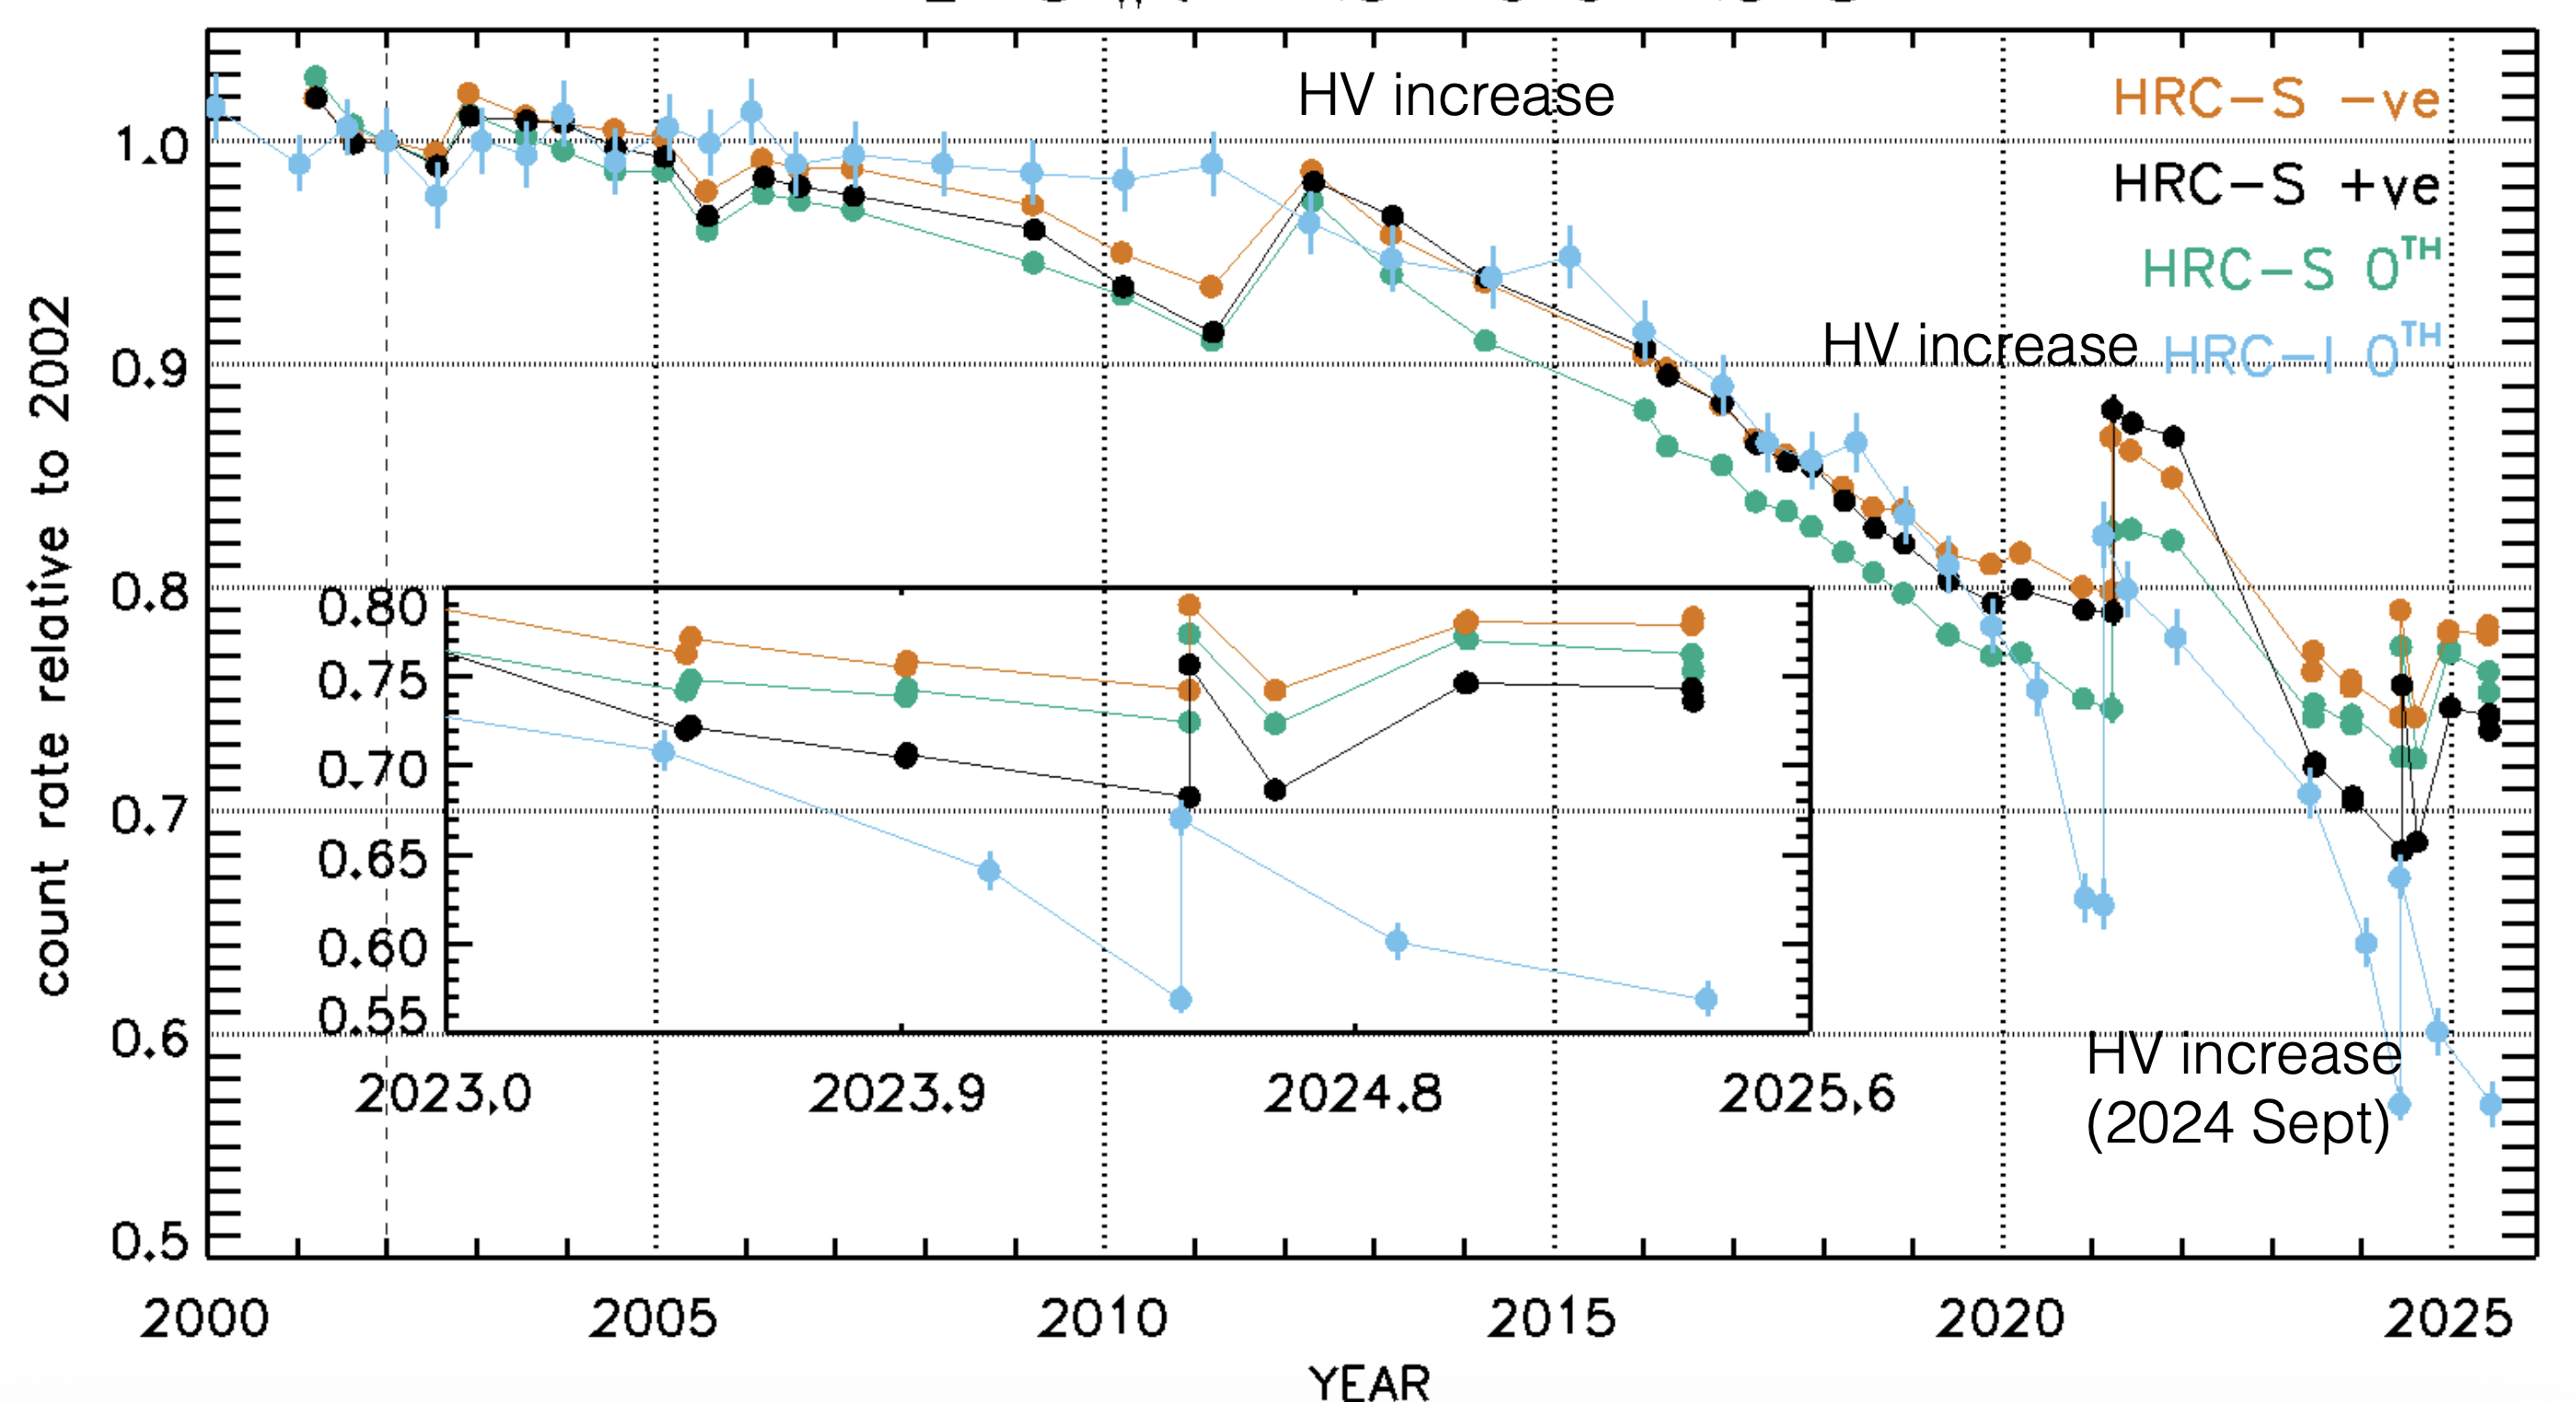 |
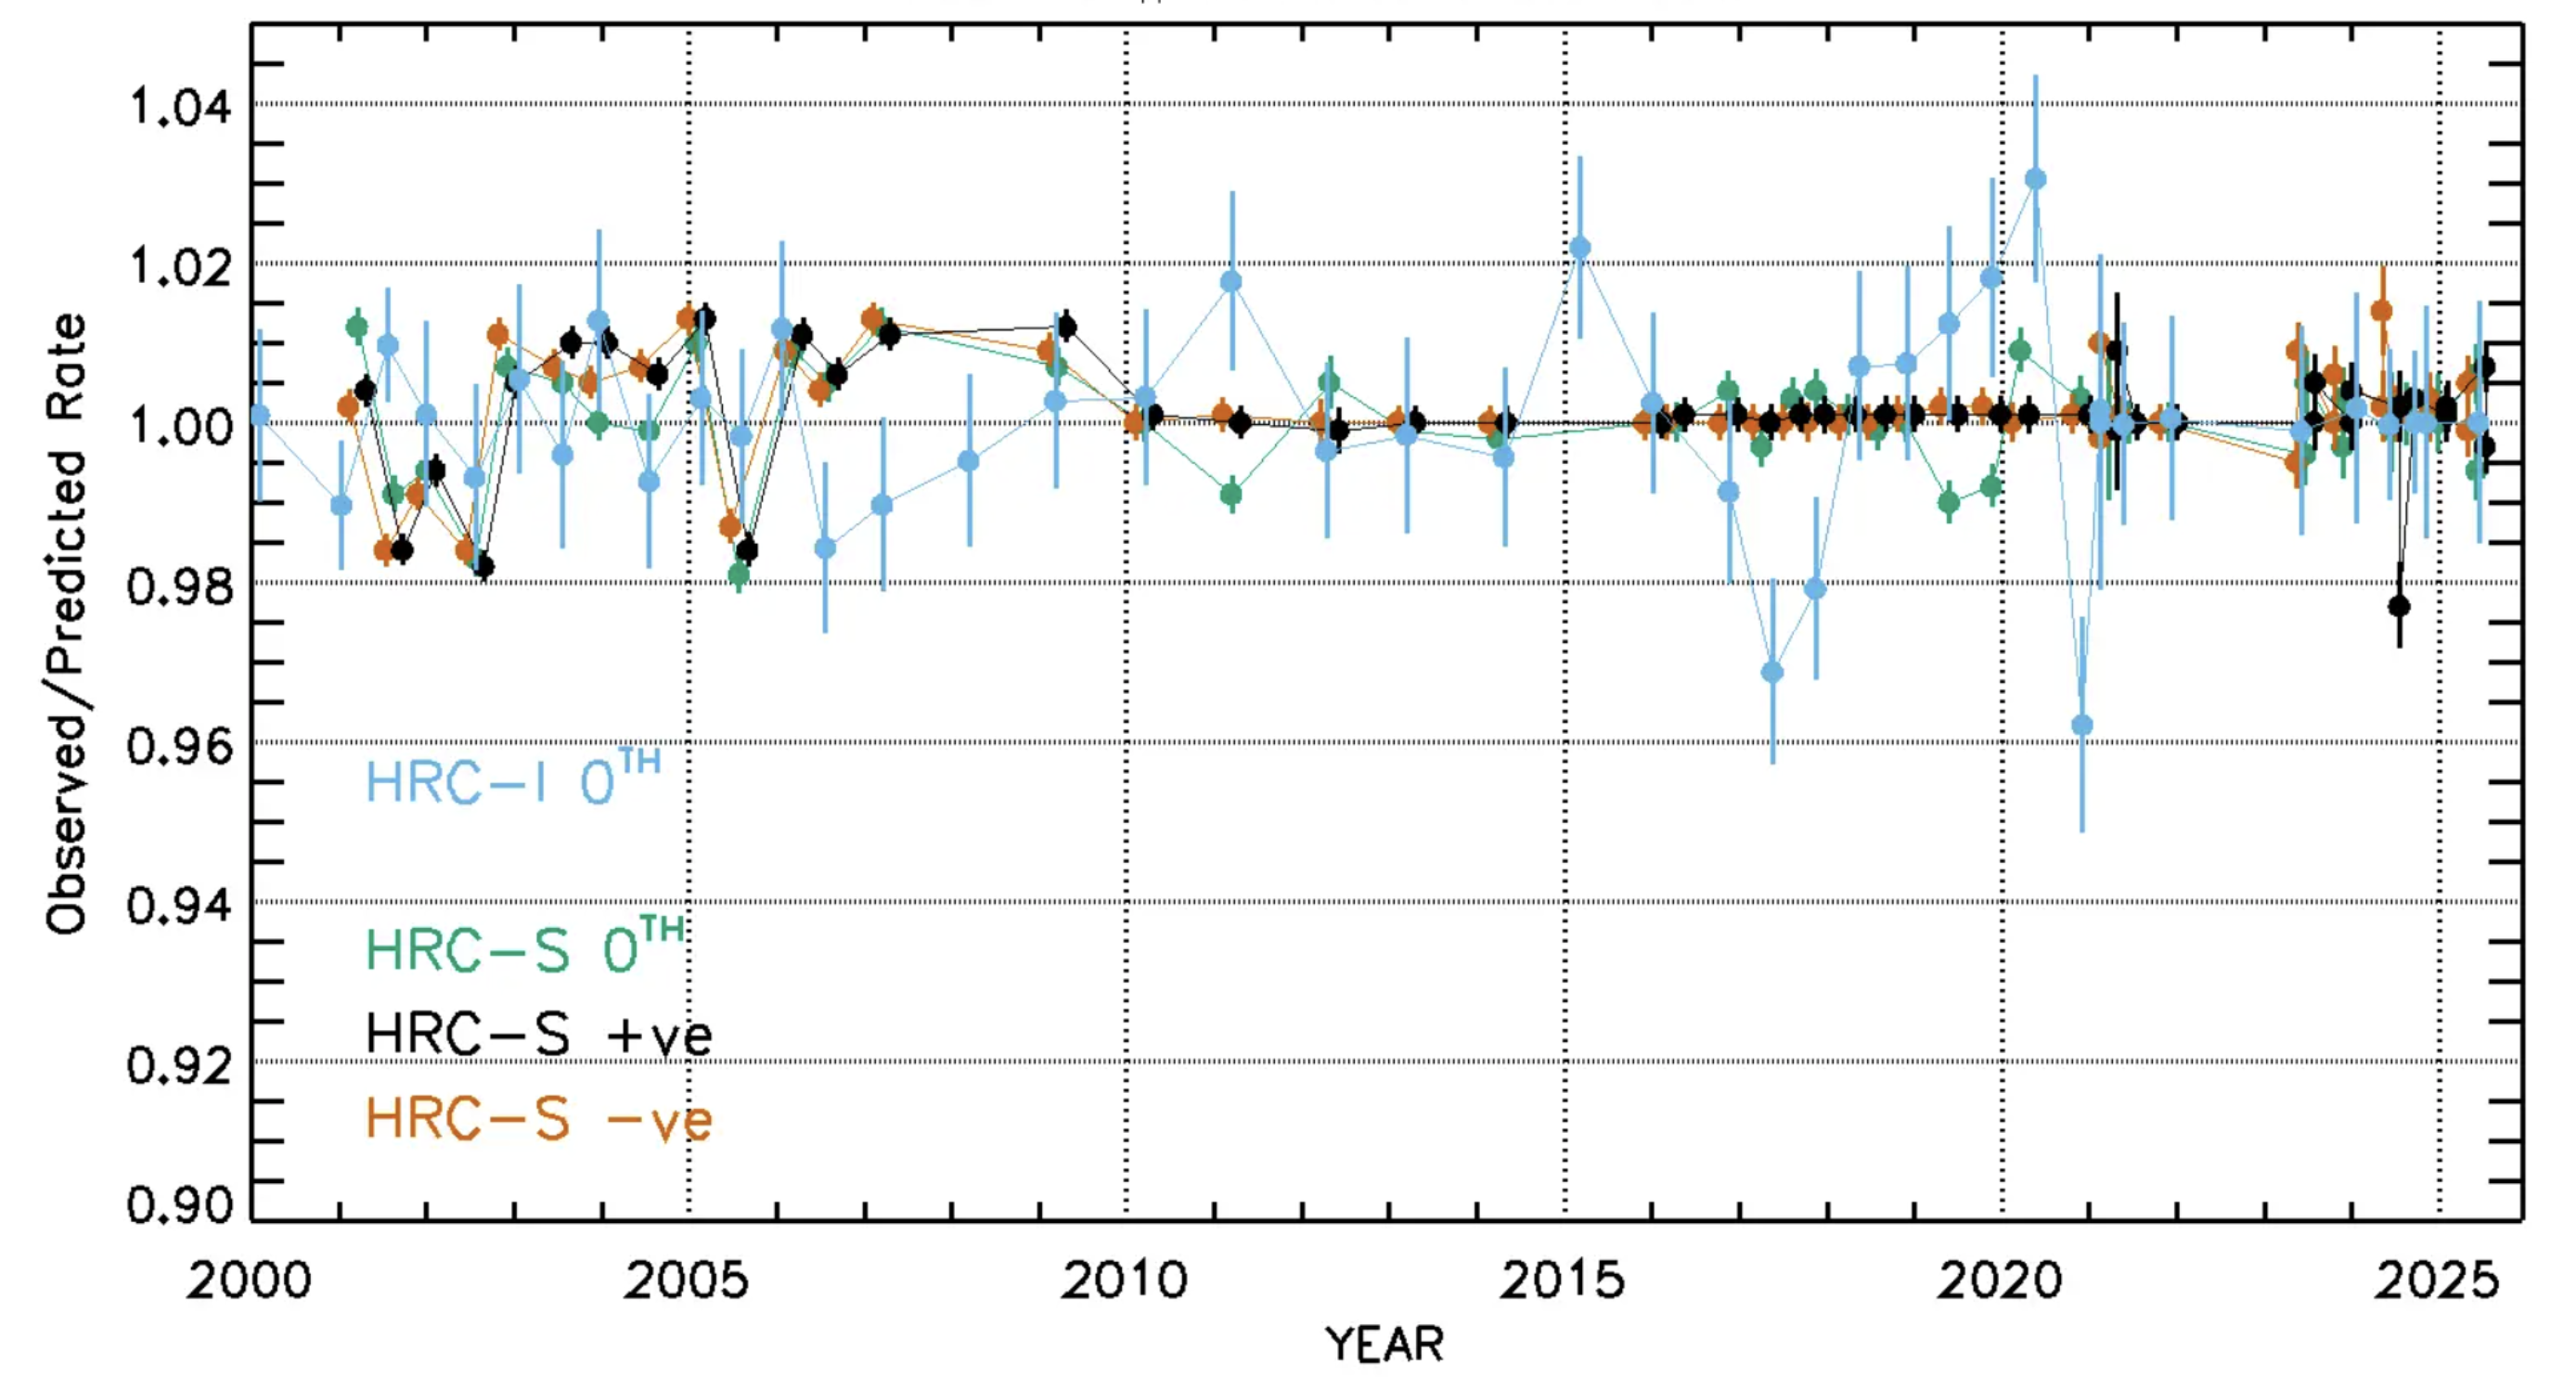 |
|---|
HRC Fluxed Data for Observations of G21.5-09
| HRC Fluxed Data for Observations of G21.5-09 | 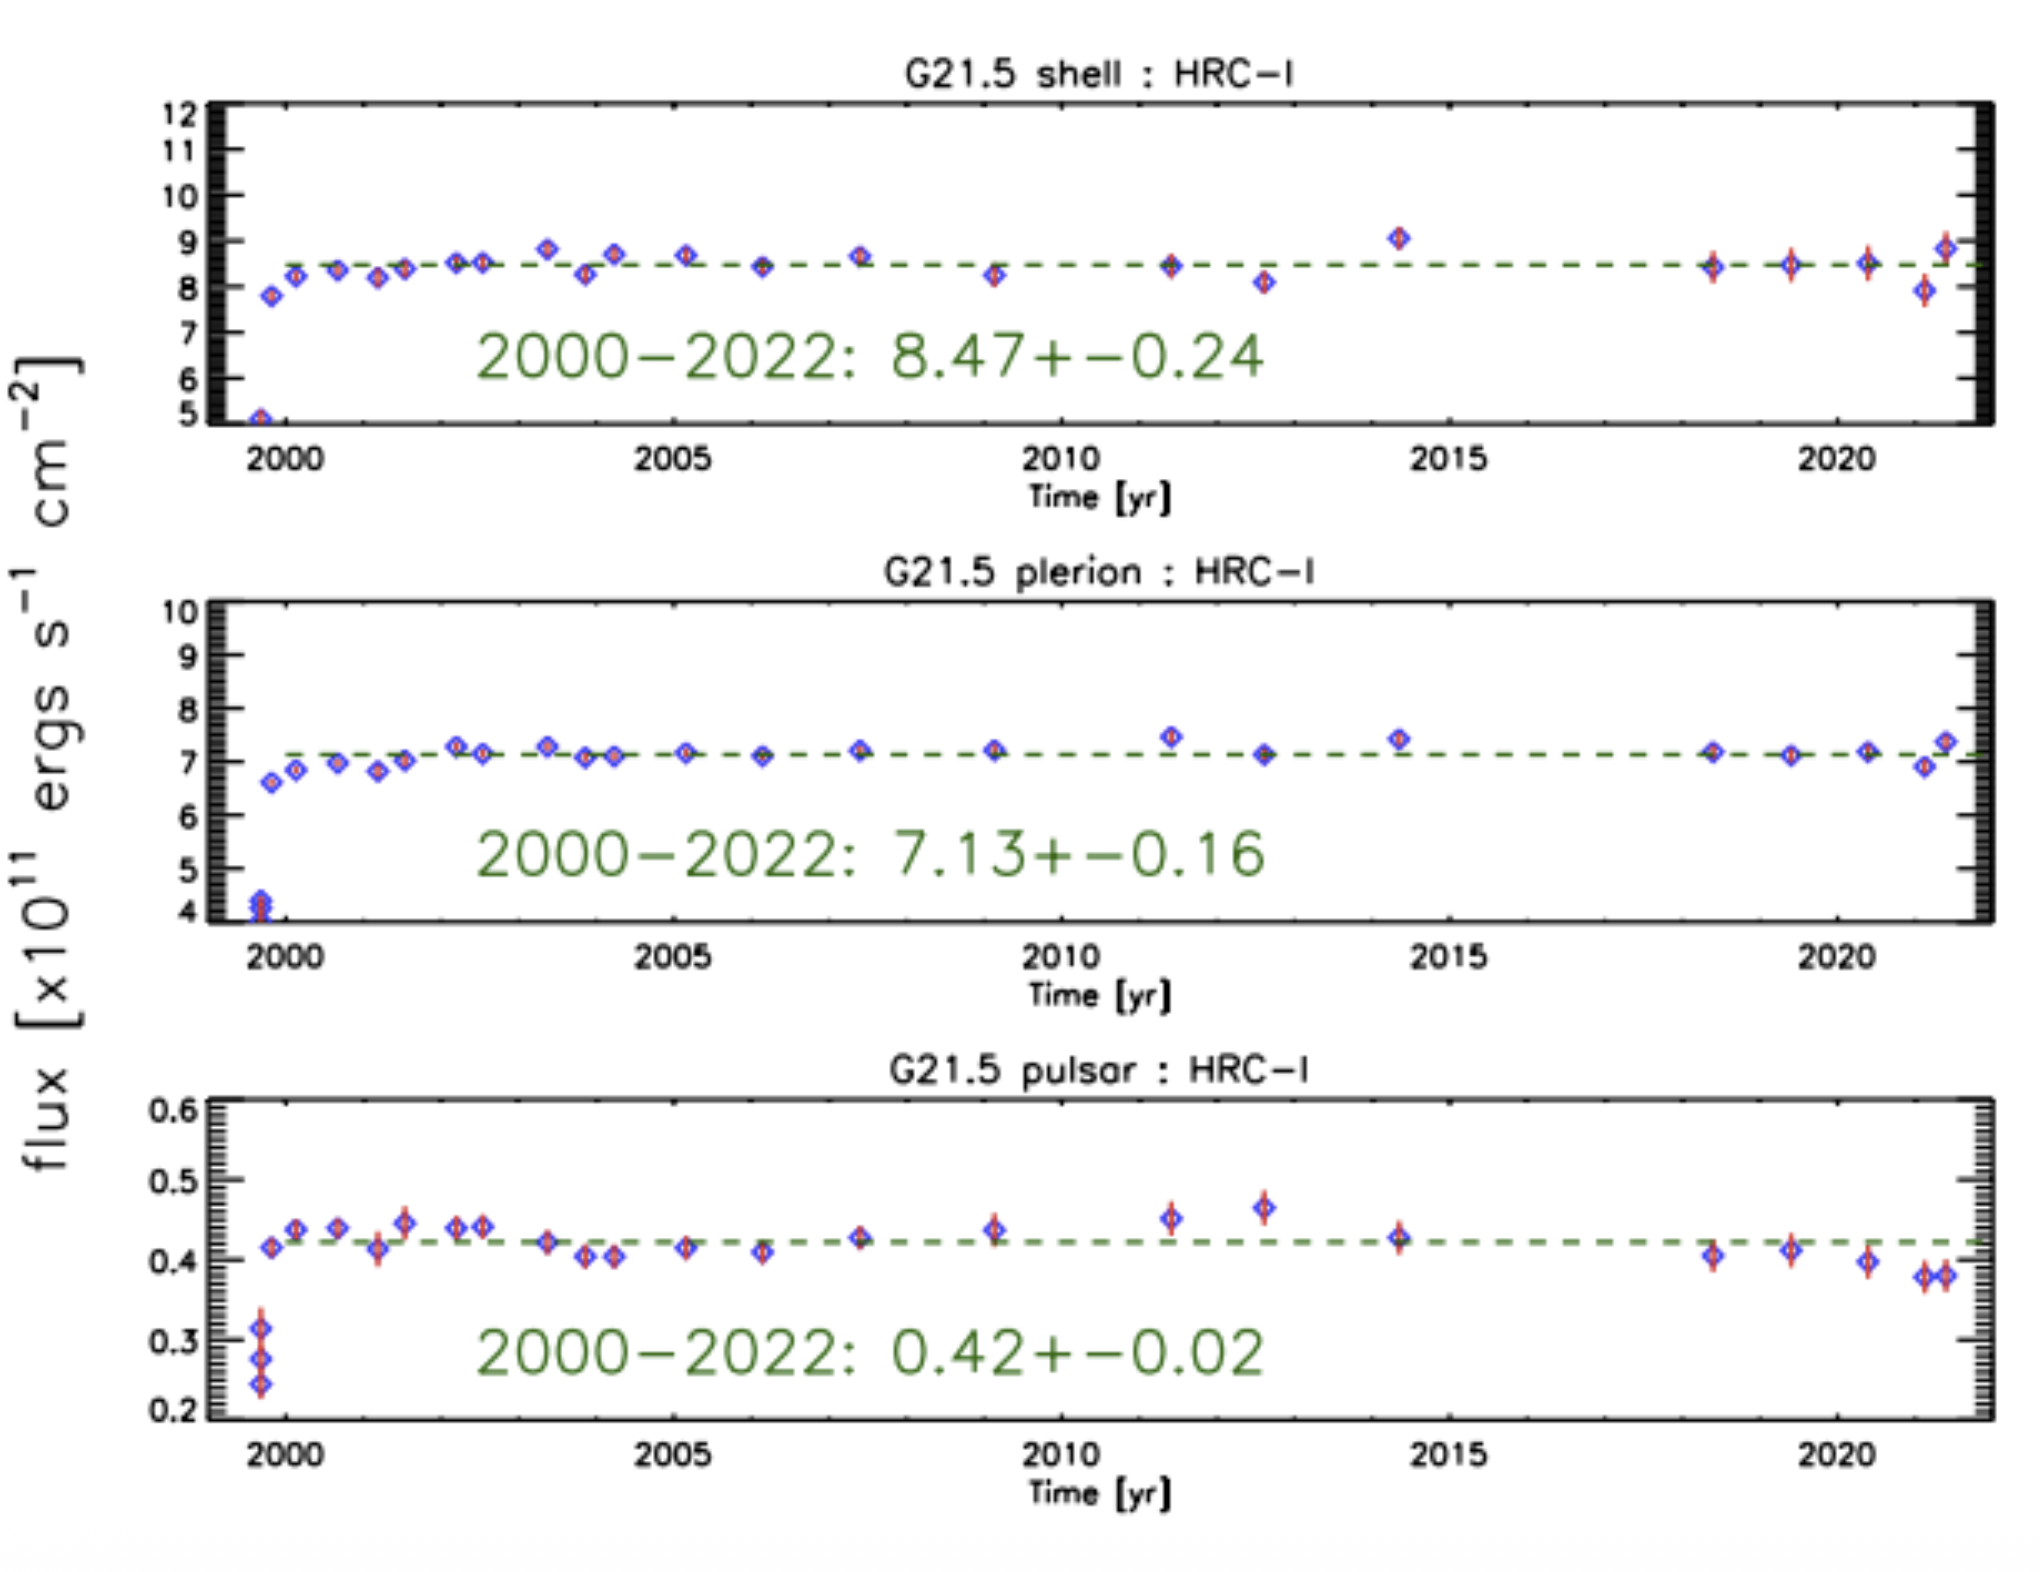 |
|---|
 |
Interleaved Gratings Observations
 |