Total Event Numbers
(Peak Area)
(Same Scale)
(peak Area)
(Same Scale)

415,820

264,617

776,334

785,327

44,735

1,281,328

966,698

1,664,272

882,970

127,995

994,865

90,965

219,880

283,245

528,655

477,725

9,805,431


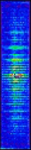
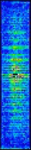
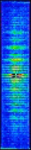
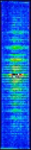
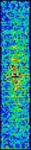
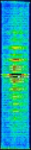
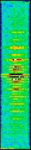
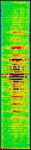
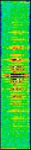
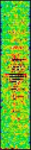
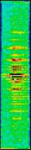
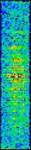
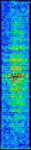
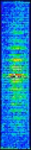
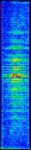
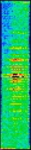
The background map is created as follows:
The table blow shows an overview of stowed background changes over years. The fist column is year, the second column is a dead time corrected yearly comulative background time. The third column is a stowed background map with event 1 data scaled so that details show up. The fourth column is the same data but unified scale for all years. The fifth and sixth columns are similar to those of the third and the fourth, but status bit corrected data. If you click on the year or one of the maps, it will take to the larger map of the map.
| Year | Time (sec) Total Event Numbers |
Evt1 (Peak Area) |
Evt1 (Same Scale) |
Lev2 (peak Area) |
Lev2 (Same Scale) |
|---|---|---|---|---|---|
| |||||
| 2000 | 10,074 415,820 |
|
|
|
|
| 2001 | 5,484 264,617 |
|
|
|
|
| 2002 | 16,682 776,334 |
|
|
|
|
| 2003 | 16,897 785,327 |
|
|
|
|
| 2004 | 798 44,735 |
|
|
|
|
| 2005 | 22,212 1,281,328 |
|
|
|
|
| 2006 | 14,551 966,698 |
|
|
|
|
| 2007 | 19,527 1,664,272 |
|
|
|
|
| 2008 | 11,707 882,970 |
|
|
|
|
| 2009 | 1,505 127,995 |
|
|
|
|
| |||||
| 2010 | 14,010 994,865 |
|
|
|
|
| 2011 | 1,516 90,965 |
|
|
|
|
| 2013 | 4,164 219,880 |
|
|
|
|
| 2014 | 5,582 283,245 |
|
|
|
|
| 2015 | 11,155 528,655 |
|
|
|
|
| 2018 | 7,237 477,725 |
|
|
|
|
| Cumulative Maps | |||||
| |||||
| Total | 163,101 9,805,431 |
|
|
|
|
If you have any questions about this page, please contact: swolk@cfa.harvard.edu.