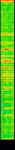
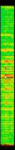
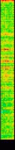
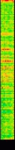
Hrc S Background Maps
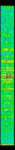
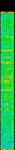
The background map is created as follows:
-
Add up all HRC S event 1 fits files for a given year.
-
Create an image file with bin size of 256x256 pixels.
-
Compute the background time of the year (including
dead time correction
) normalized to the background count rate per sec per pixel.
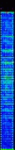
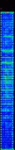
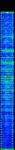
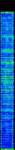
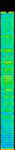
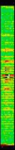
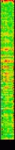
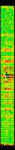
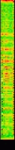
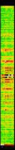
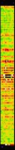
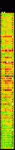
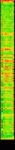
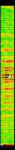
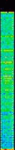
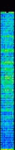
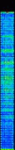
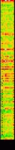
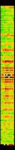
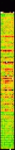
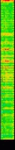
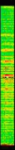
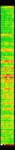
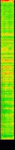
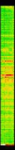
The table blow shows an overview of stowed background changes over years.
The fist column is year, the second column is a dead time corrected yearly comulative
background time. The third column is a stowed background map with event 1
data scaled so that details show up. The fourth column is the same data
but unified scale for all years. The fifth and sixth columns are similar
to those of the third and the fourth, but status bit corrected data.
If you click on the year or one of the maps, it will take to the larger map of the map.
| Year |
Time (sec)
Total Event Numbers |
Evt1
(Peak Area) |
Evt1
(Same Scale) |
Lev2
(Peak Area) |
Lev2
(Same Scale) |
 |
|---|
| 2000 |
5,703
1,168,593 |
   |
   |
|
|
|---|
| 2001 |
7,940
1,632,923 |
   |
   |
|
|
|---|
| 2002 |
7,208
1,504,125 |
   |
   |
|
|
|---|
| 2003 |
5,632
1,203,880 |
   |
   |
|
|
|---|
| 2004 |
4,644
1,175,115 |
   |
   |
|
|
|---|
| 2005 |
13,020
3,542,110 |
   |
   |
|
|
|---|
| 2006 |
6,961
2,347,363 |
   |
   |
|
|
|---|
| 2007 |
3,220
1,150,583 |
   |
   |
|
|
|---|
| 2008 |
9,215
3,427,345 |
   |
   |
|
|
|---|
| 2009 |
5,910
2,361,985 |
   |
   |
|
|
|---|
|
|---|
| 2010 |
10,083
3,760,622 |
   |
   |
|
|
|---|
| 2011 |
2,802
834,898 |
   |
   |
|
|
|---|
| 2012 |
5,693
1,565,378 |
   |
   |
|
|
|---|
| 2013 |
5,881
1,724,070 |
   |
   |
|
|
|---|
| 2014 |
12,360
2,821,763 |
   |
   |
|
|
|---|
| 2015 |
4,768
1,156,210 |
   |
   |
|
|
|---|
| 2016 |
8,637
3,383,489 |
   |
   |
|
|
|---|
| 2017 |
13,014
4,495,635 |
   |
   |
|
|
|---|
| 2018 |
9,919
3,429,965 |
   |
   |
|
|
|---|
| 2019 |
6,300
2,251,565 |
   |
   |
|
|
|---|
|
|---|
| 2020 |
7,273
2,620,250 |
   |
   |
|
|
|---|
| 2021 |
30,537
11,015,643 |
   |
   |
|
|
|---|
| 2022 |
842
0 |
   |
   |
|
|
|---|
| Cumulative Maps |
|---|
|
|---|
| Total |
187,562
58,573,510 |
   |
   |
|
|
|---|
If you have any questions about this page, please contact: swolk@cfa.harvard.edu.