| Science Run Stop: | 2024:366:17:17:09.000 |
| Science Run Start: | 2025:003:06:06:24.000 |
| Interruption: | 173.36 ks |
| Triggered by: | manual |
Go to:
ACE Plot (Electron DE1, DE4 / Proton P2,P3, P5, P6p, P7)
HRC Plot (HRC Shield Rate)
ACIS Plot (ACIS Count Rate)
GOES-R Plot (P5/P6/P7/HRC Prox)
XMM Plot (LE and HES)
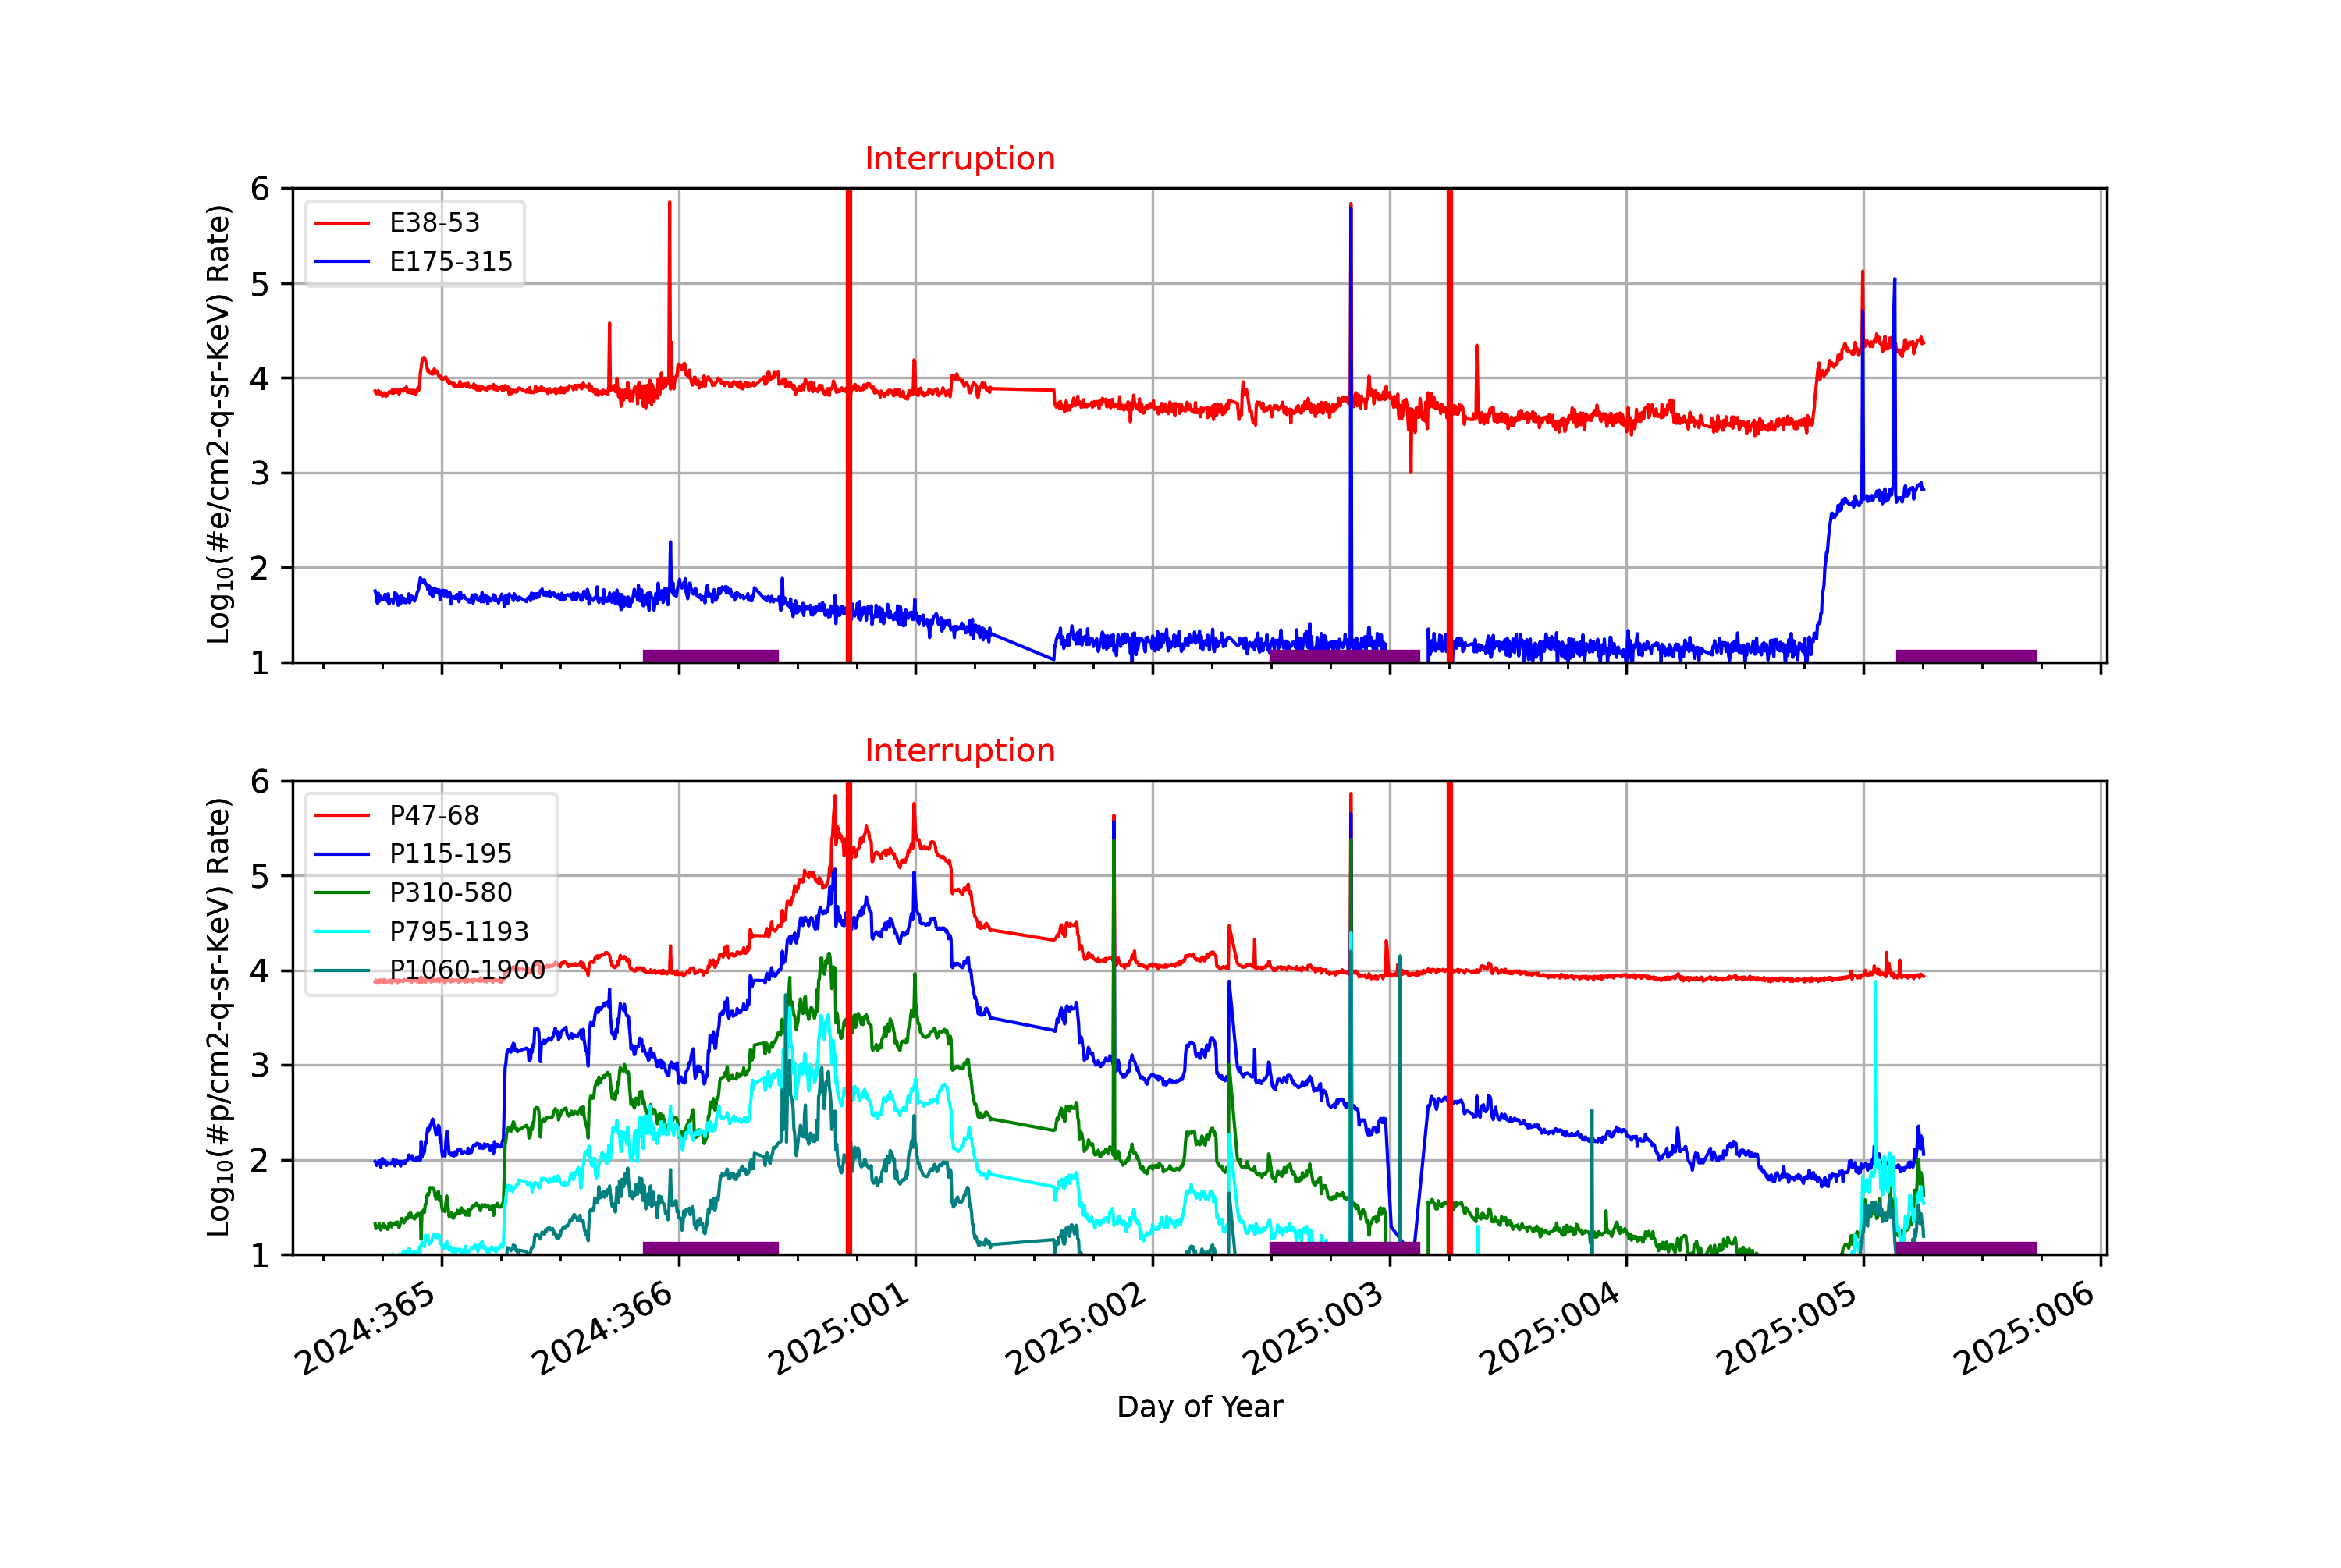
ACE radiation data are plotted around periods when science runs were interrupted. Plots start exactly 2 days before the interruption started. The top panel shows differential fluxes of electrons 38-53 and 175-315 (particles/cm2-s-ster-MeV), the bottom panel shows differential fluxes of protons 47-65, 112-187, and 310-580 (particles/cm2-s-ster-MeV).
		Avg			Max		Time		Min		Time		Value at Start of Interruption
-----------------------------------------------------------------------------------------------
e38-53		2.910e+02+/-3.616e+04	7.120e+05	2024:365:23:05:00	1.010e+03	2025:003:02:10:00	7420.0
e175-315		-6.670e+03+/-2.973e+04	6.160e+05	2025:002:20:05:00	1.670e-36	2025:003:02:35:00	34.2
p47-68		2.113e+04+/-6.700e+04	7.300e+05	2025:002:20:05:00	7.230e+03	2024:364:18:55:00	149000.0
p115-195		-4.618e+03+/-3.547e+04	4.490e+05	2025:002:20:05:00	9.740e+00	2025:003:02:20:00	24900.0
p310-580		-6.933e+03+/-2.800e+04	2.380e+05	2025:002:20:05:00	6.520e-29	2025:003:00:40:00	2450.0
p795-1193		-7.026e+03+/-2.585e+04	2.470e+04	2025:002:20:05:00	1.130e-32	2025:002:23:40:00	567.0
p1060-1900		-7.121e+03+/-2.582e+04	1.580e+04	2025:002:20:05:00	0.000e+00	2025:004:15:55:00	116.0
e38-53/e175-315		8.432e+35+/-3.656e+37	1.587e+39	2025:003:02:35:00	2.117e-01	2025:005:03:10:00	216.95906432748535
p47-68/p1060-1900		2.930e+36+/-1.271e+38	5.515e+39	2025:003:02:35:00	7.928e-02	2025:005:03:10:00	1284.4827586206898
p115-195/p1060-1900		-3.181e+37+/-1.380e+39	9.019e+28	2025:003:02:20:00	7.523e-04	2025:005:03:10:00	214.6551724137931
p310-580/p1060-1900		-3.180e+37+/-1.380e+39	1.806e+08	2025:003:02:20:00	2.081e-04	2025:005:03:10:00	21.120689655172413
p795-1193/p1060-1900		4.115e+31+/-1.785e+33	7.749e+34	2025:003:01:05:00	4.978e-05	2025:002:23:40:00	4.887931034482759
Two vertical red lines indicate the start and the end of the interruption. Purple hatched areas indicate that the satellite is in the radiation belt. The horizontal dashed line indicates P3 trigger level. If P3 level is higher than this level more than 2 hours, SCS 107 may be manually triggered.
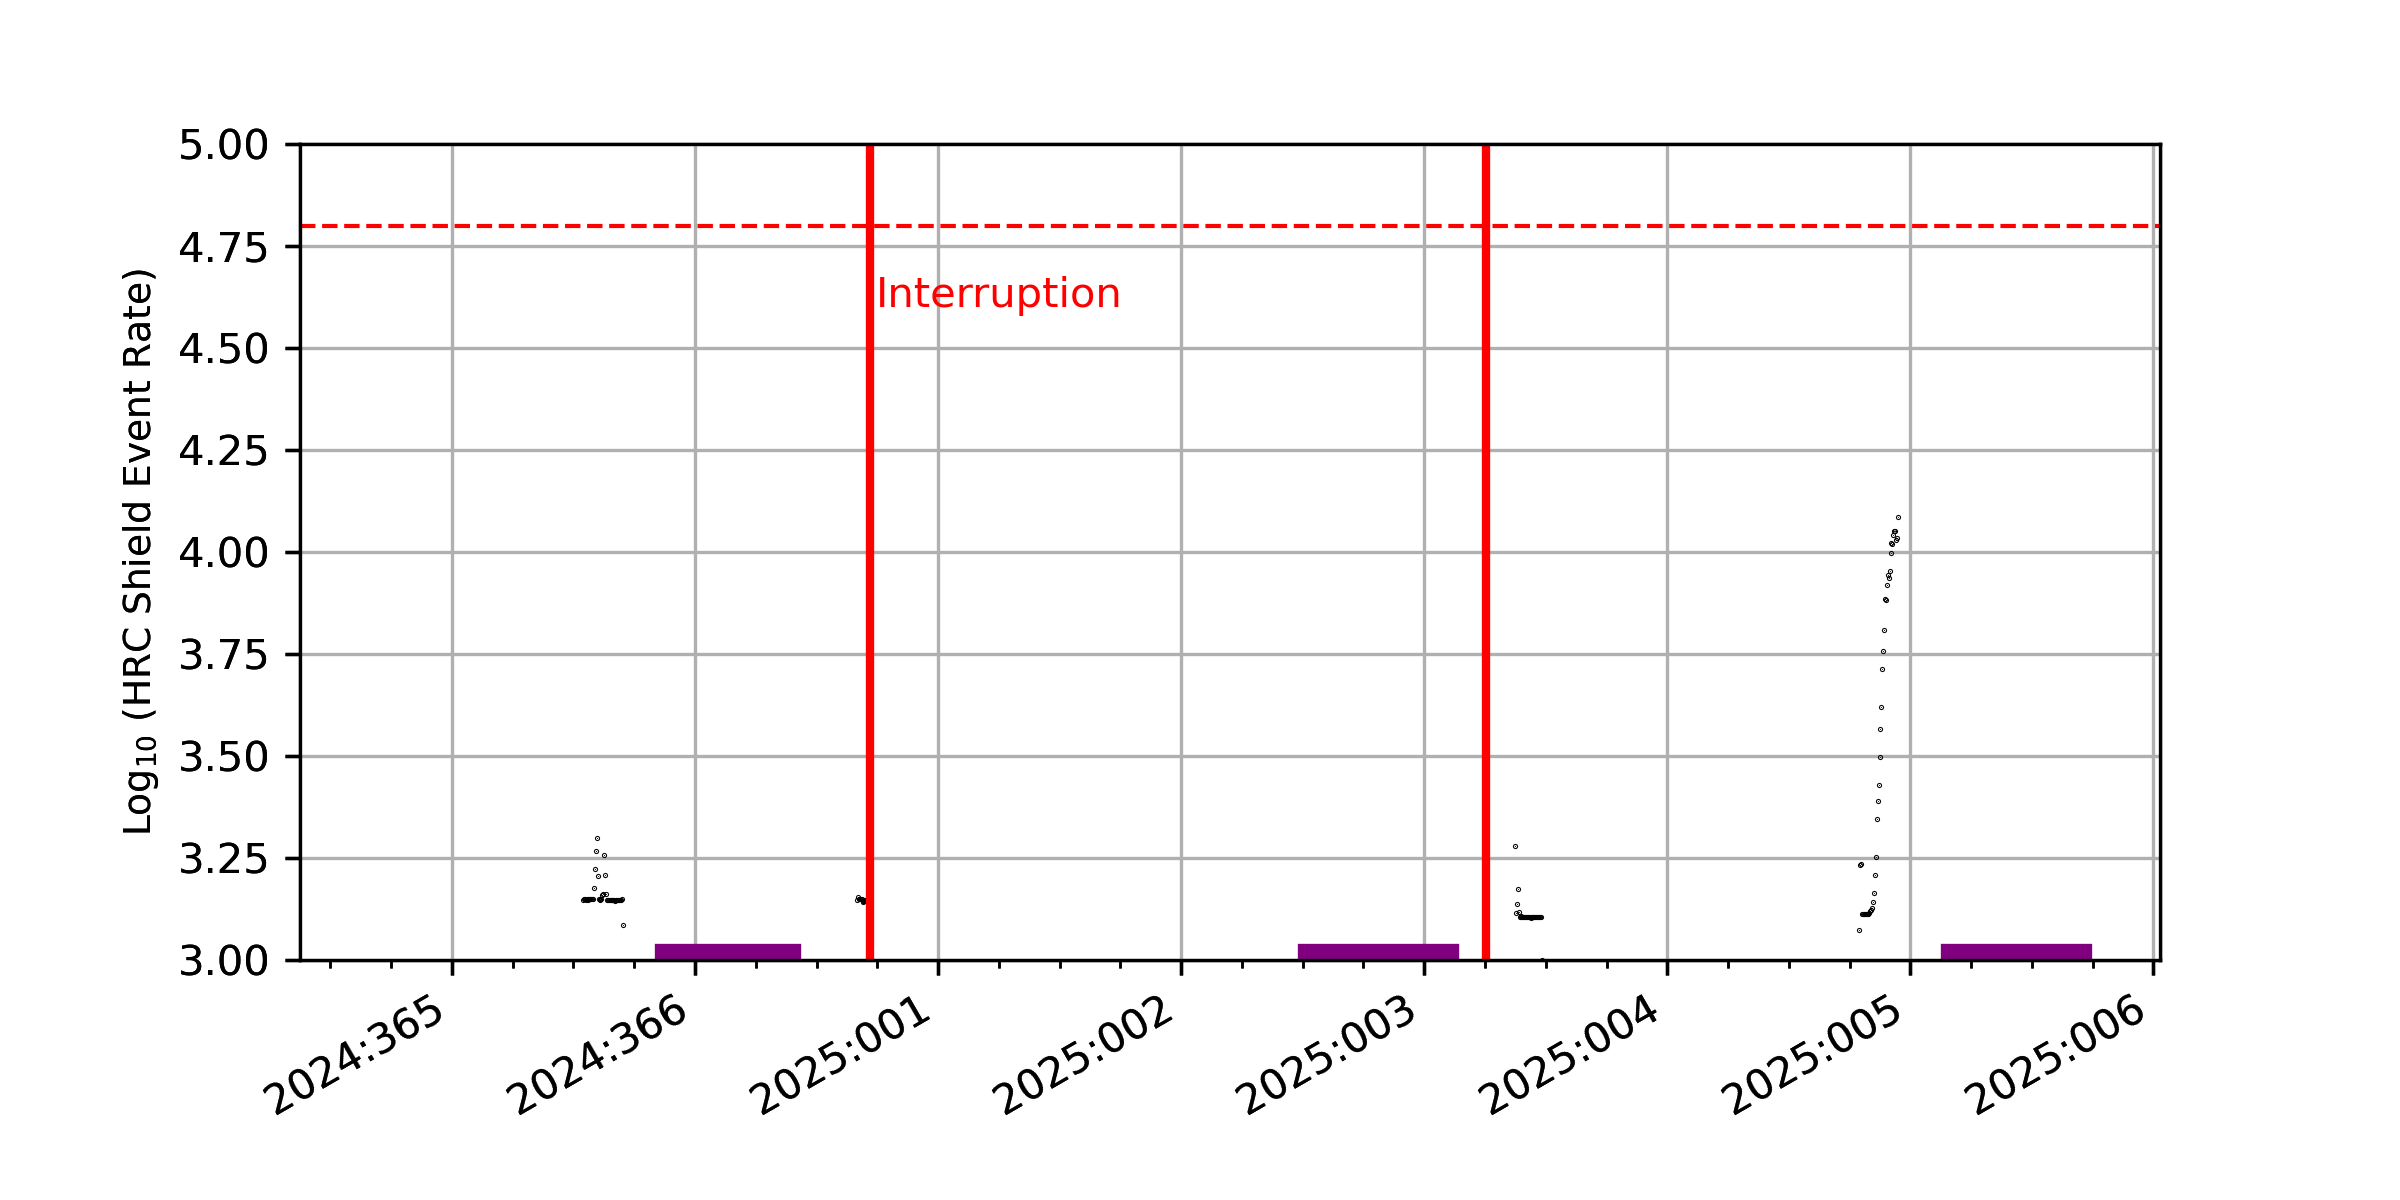
		Avg			Max		Time		Min		Time		Value at Interruption Started
-----------------------------------------------------------------------------------------------
2SHEV2RT		1.966e+02+/-1.022e+03	1.220e+04	2025:004:22:46:14	0.000e+00	2024:364:17:20:54	2024:366:17:16:22
Two vertical red lines indicate the start and the end of the interruption. Purple hatched areas indicate that the satellite is in the radiation belt. The red horizontal dashed line indicates SCS 107 limits. If the HRC shield rate/256 goes above 248, automatic SCS 107 is triggered.
The following plots are copied from the ACIS Threshold Crossings Page. For more details, please refer to Using ACIS to detect and report high radiation conditions. All available plots for each day of the shutdown are listed. If a day is missing, then there is no plot available.


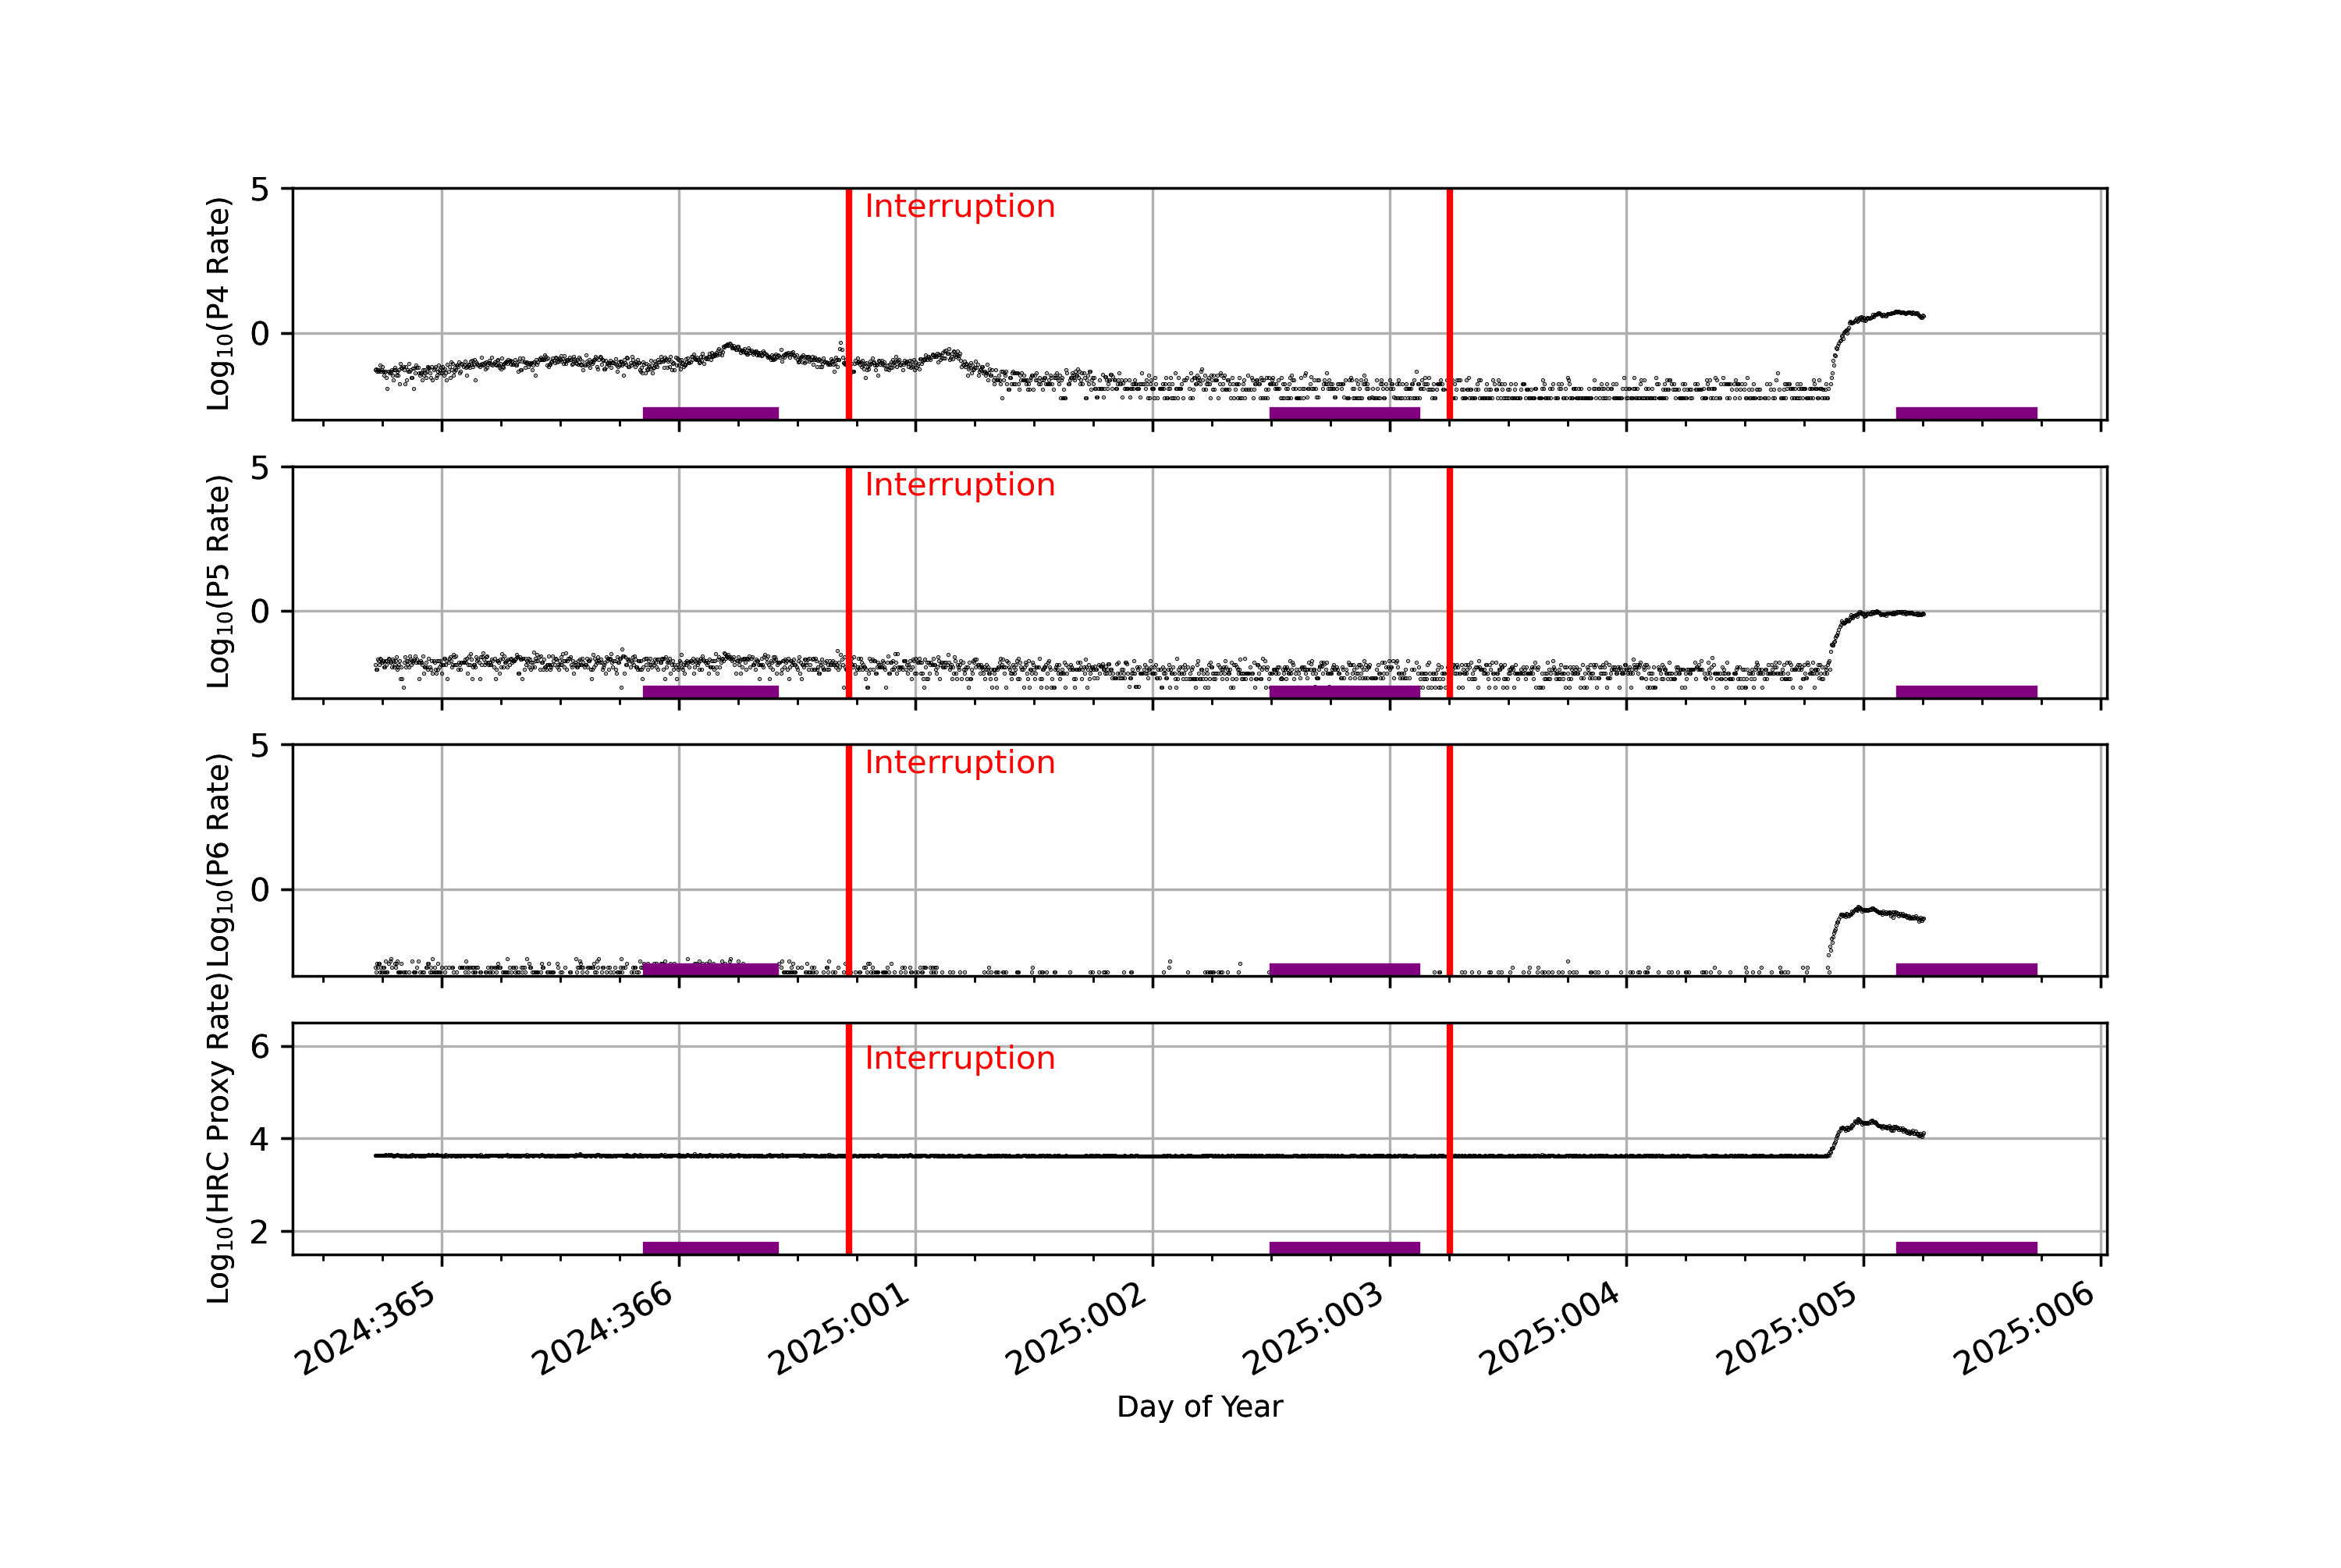
GOES-R data are taken from NOAA site (https://services.swpc.noaa.gov/json/goes/primary/integral-protons-1-day.json).
| P5 | 11.64 - 23.27 MeV protons (particles/cm2-sec-sr-MeV) |
| P6 | 25.90 - 38.10 MeV protons (particles/cm2-sec-sr-MeV) |
| P7 | 40.30 - 73.40 MeV protons (particles/cm2-sec-sr-MeV) |
HRC Proxy is defined as:
HRC Proxy = 143 * P5 + 64738 * P6 + 162505 * P7 + 4127
		Avg			Max		Time		Min		Time		Value at Start of Interruption
-----------------------------------------------------------------------------------------------
P4		2.609e-01+/-9.099e-01	5.593e+00	2025:005:03:35:00	0.000e+00	2025:001:12:00:00	0.04136
P5		5.463e-02+/-1.796e-01	1.010e+00	2025:005:01:20:00	0.000e+00	2024:364:22:45:00	0.01683
P6		9.251e-03+/-3.566e-02	2.573e-01	2025:004:23:25:00	0.000e+00	2024:364:20:25:00	0.0006808
HRC_Proxy		5.018e+03+/-3.214e+03	2.678e+04	2025:004:23:25:00	4.127e+03	2025:002:06:30:00	4211
Two vertical red lines indicate the start and the end of the interruption. Purple hatched areas indicate that the satellite is in the radiation belt. The red horizontal dashed lines indicate SCS 107 limits. If GOES P Channels or the HRC Proxy go above these levels, SCS 107 may be manually triggered.
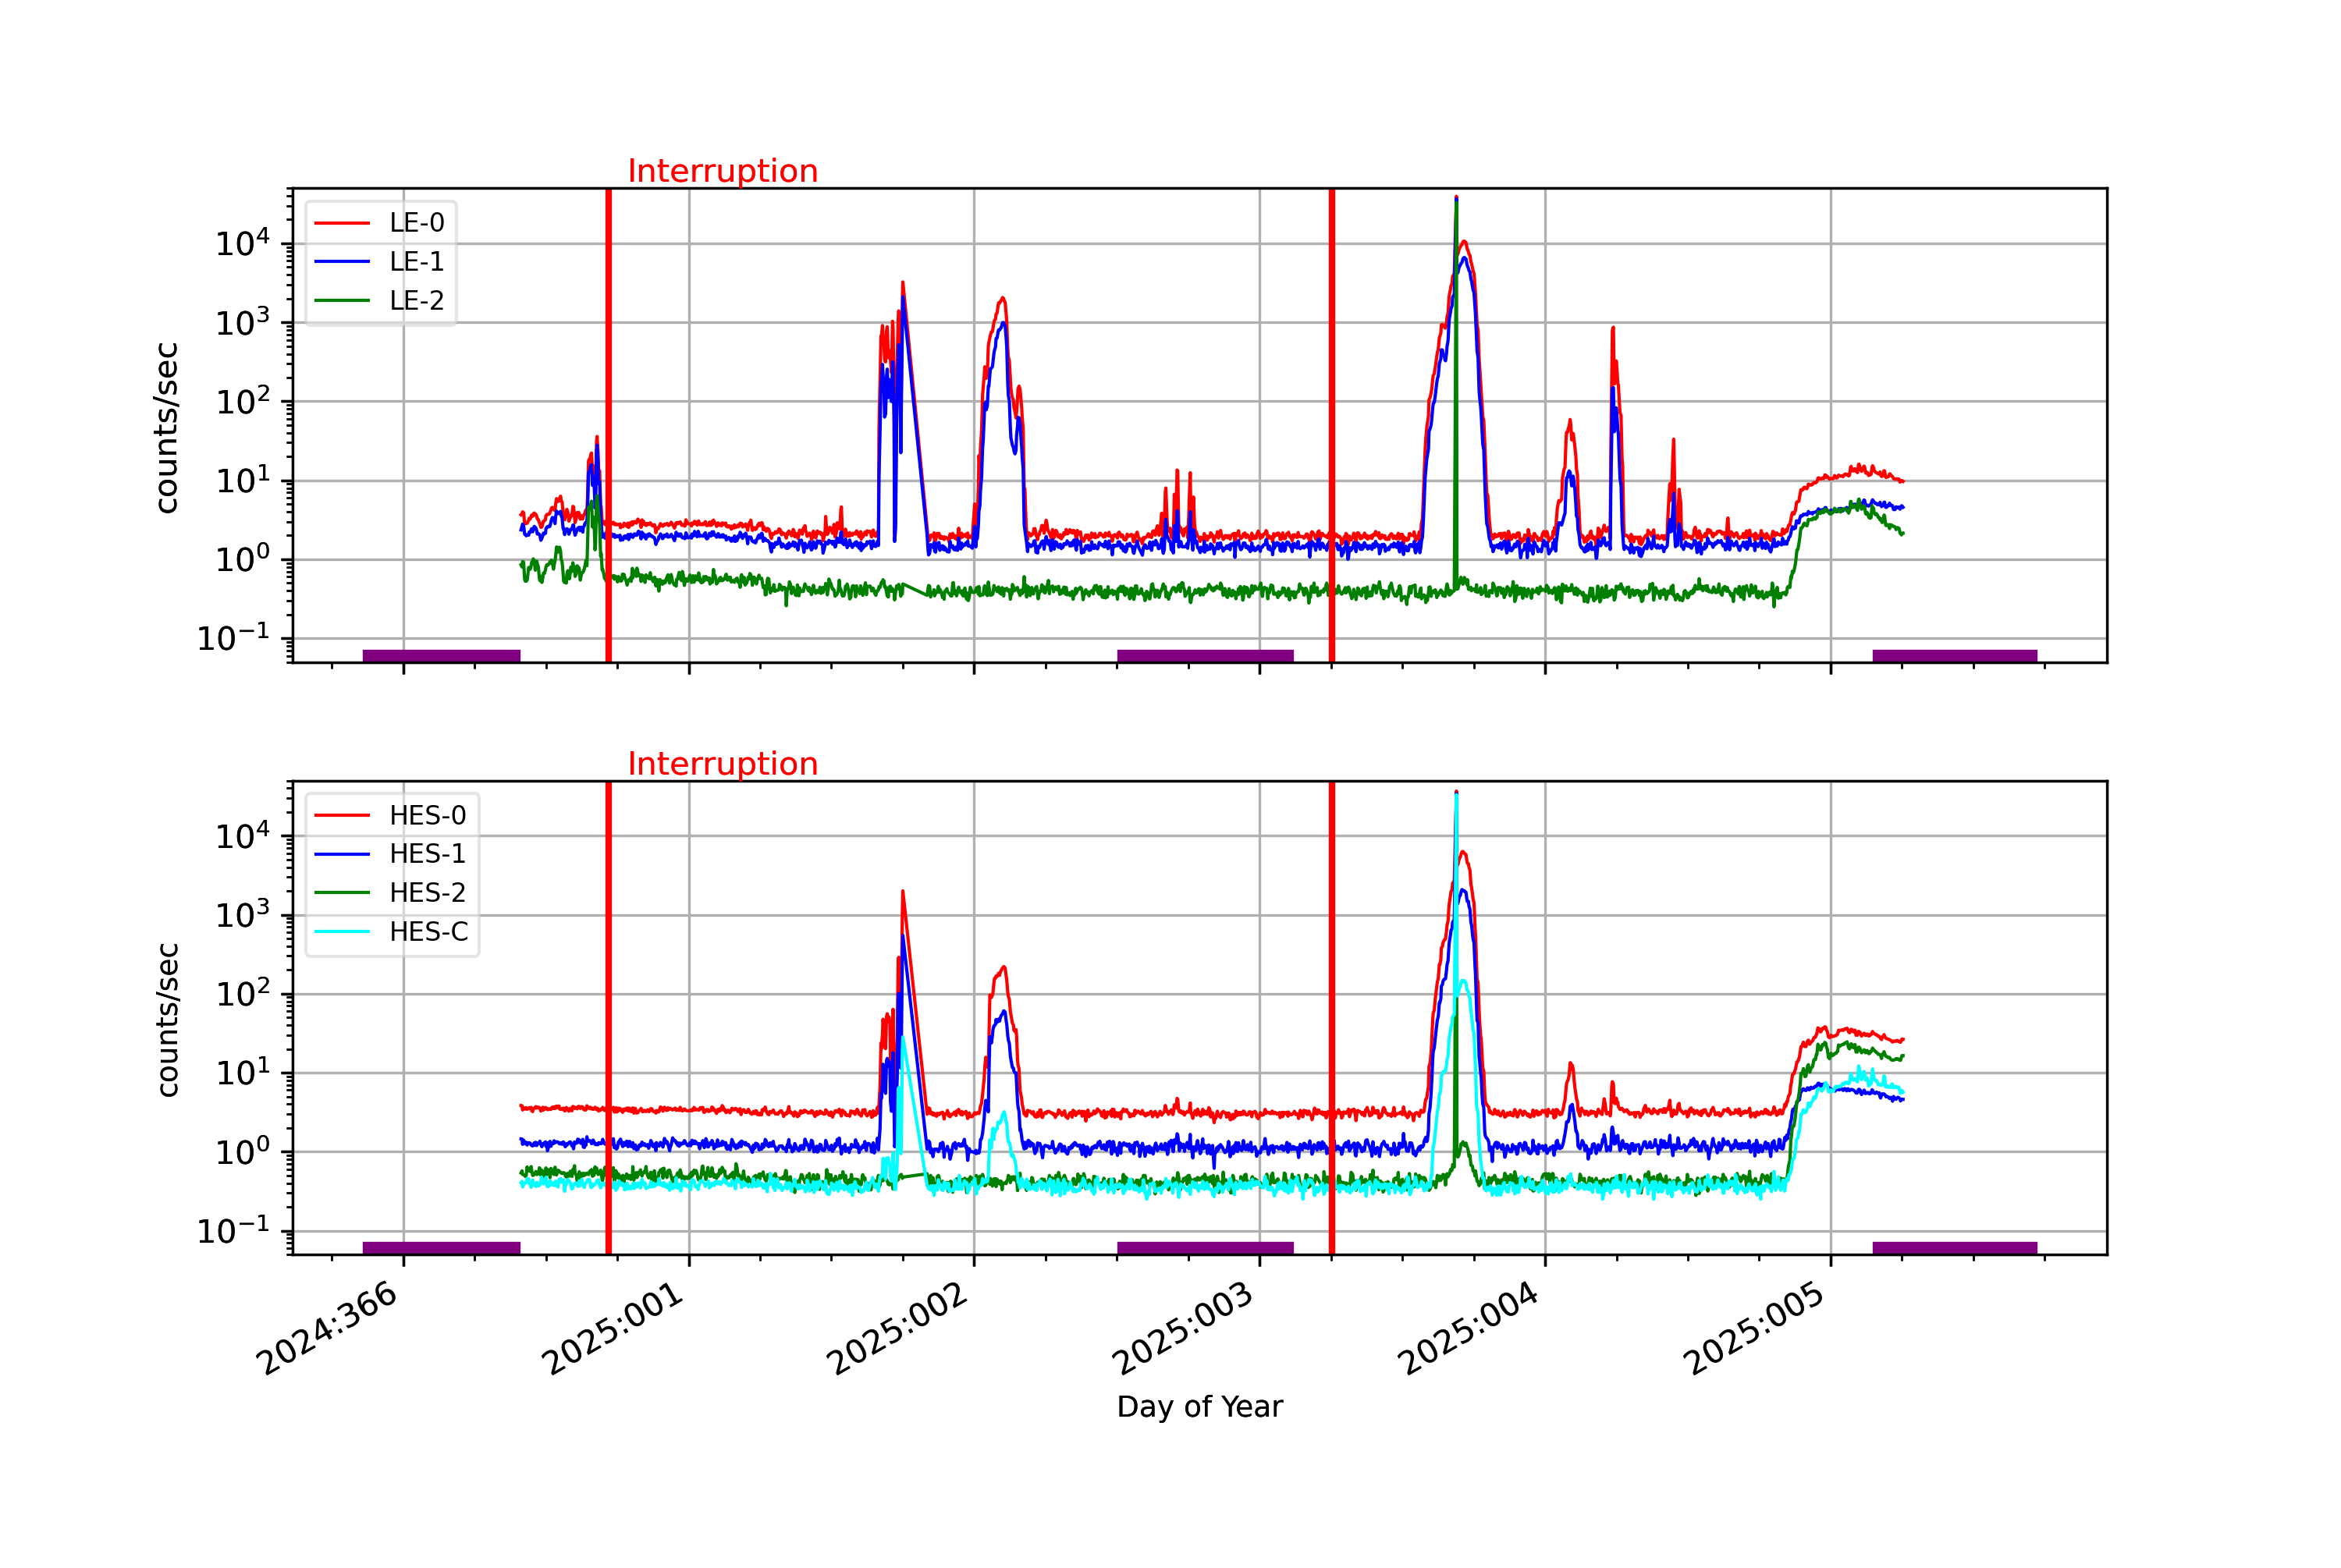
		Avg			Max		Time		Min		Time		Value at Start of Interruption
-----------------------------------------------------------------------------------------------
LE-0		1.991e+02+/-1.393e+03	3.940e+04	2025:003:16:32:38	1.434e+00	2025:004:04:17:35	2.056
LE-1		1.182e+02+/-1.086e+03	3.668e+04	2025:003:16:32:38	1.000e+00	2025:003:07:25:14	1.681
LE-2		2.103e+01+/-8.180e+02	3.297e+04	2025:003:16:32:38	2.500e-01	2025:004:19:14:26	0.306
HES-0		1.065e+02+/-1.067e+03	3.674e+04	2025:003:16:32:38	2.327e+00	2025:002:20:10:38	3.042
HES-1		4.798e+01+/-8.667e+02	3.418e+04	2025:003:16:32:38	6.150e-01	2025:002:20:10:38	1.153
HES-2		2.212e+01+/-8.180e+02	3.297e+04	2025:003:16:32:38	2.790e-01	2025:004:12:40:36	0.431
Two vertical red lines indicate the start and the end of the interruption. Red hatched areas indicate that the satellite is in the radiation belt.