As mentioned in Aldcroft's memo, fid lights drift with time. We plotted here 14 fid light trends.
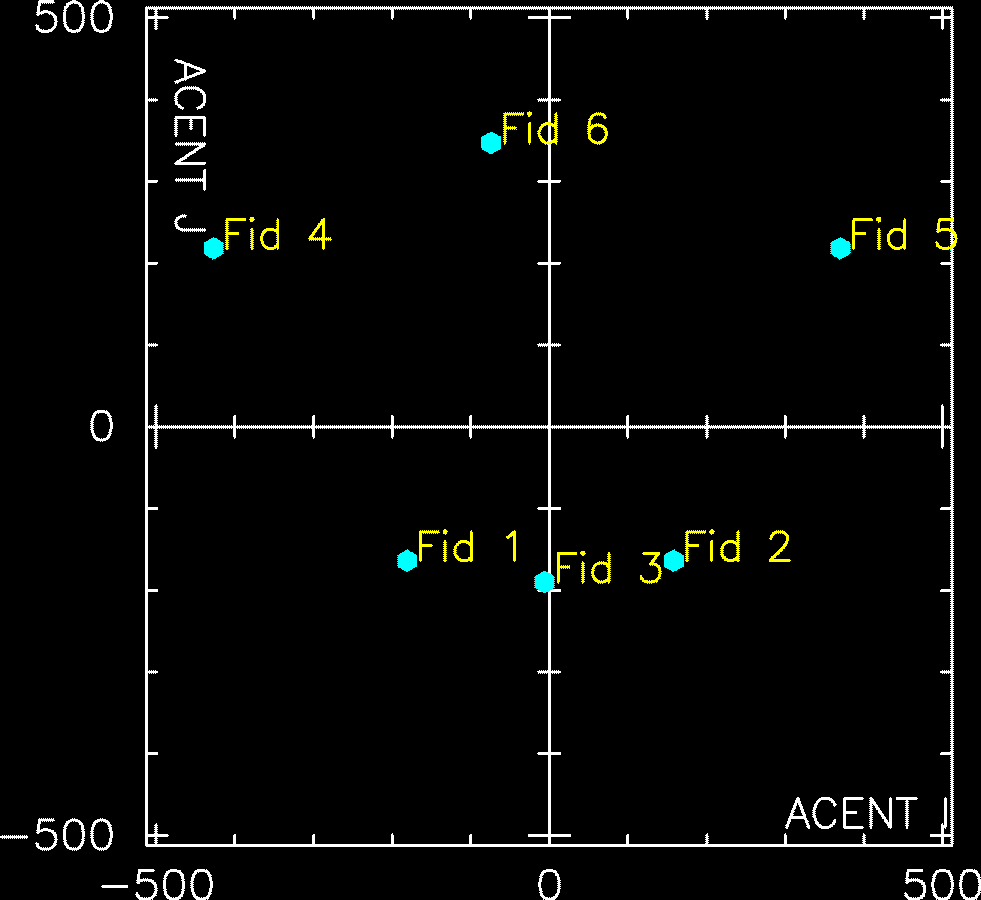
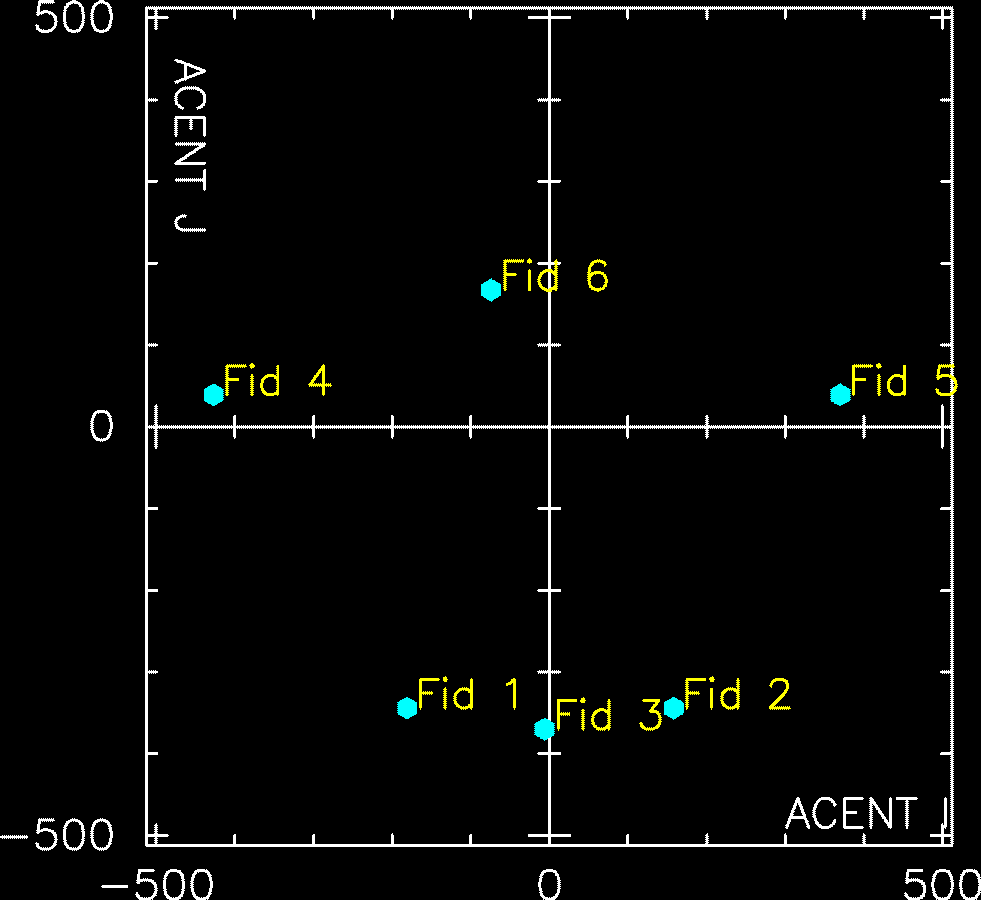
Two top two figures show fid light positions on ACA for ACIS I configuration, and for ACIS S configuration. The CCD size is 1024 x 1024, and approximately 1 arcsec per pixel. We use ACENT I/ ACENT J (unit in pixel) coordinates. ACENT I is along with approximately -Y axis, and ACENT J is approximately Z axis. Similar plots are shown to both HRC-I and HRC-S.
If you click a blue dot on the ACA map, it brings up two plots: ACENT I and J drift trend plots. A blue vertical line indicates an approximate date of swapping IRU-1 to IRU-2 (DOM 1411 = Jun 1, 2003). Fitted lines are a simple linear fit, and the unit of the slope given at the right top corner is arcsec/yr.
If you open up a trending plot from "Plot" row below the ACA maps of ACIS, the page will show both ACIS-I and ACIS-S configuration plots for the selected Fid light. For HRC, either selections (from a blue dot or from the Plot row) bring up a same plot.
Please click a blue dot to open the Fid light trend plot
| ACIS I Fid Light Positions on ACA | ACIS S Fid Light Positions on ACA |
|---|---|
|
|
|
| Plots | Fid light 1 | Fid light 2 | Fid light 3 | Fid light 4 | Fid light 5 | Fid light 6 |
|---|---|---|---|---|---|---|
| Data | I-1 | I-2 | I-3 | I-4 | I-5 | I-6 |
| Data | S-1 | S-2 | S-3 | S-4 | S-5 | S-6 |
Please click a blue dot to open the Fid light trend plot
| HRC I Fid Light Positions on ACA |
|---|
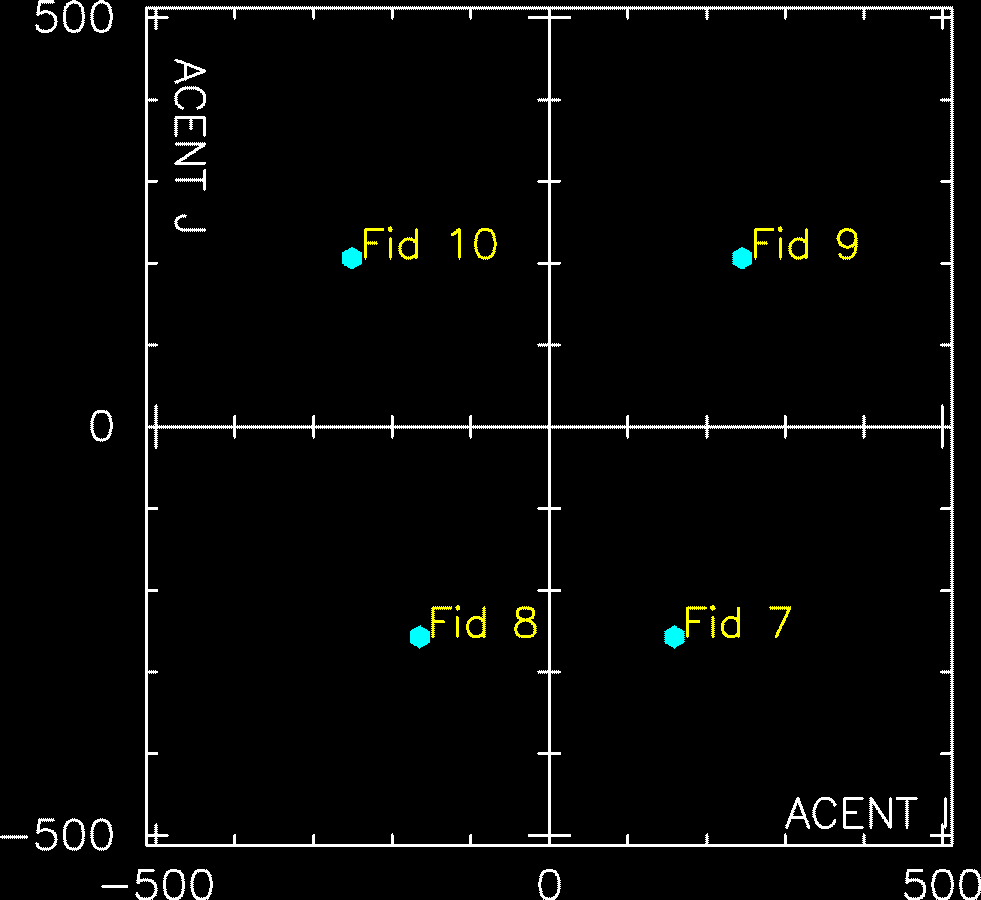
|
| Plots | Fid light 7 | Fid light 8 | Fid light 9 | Fid light 10 | |
|---|---|---|---|---|---|
| Data | I-1 | I-2 | I-3 | I-4 |
Please click a blue dot to open the Fid light trend plot
| HRC S Fid Light Positions on ACA |
|---|
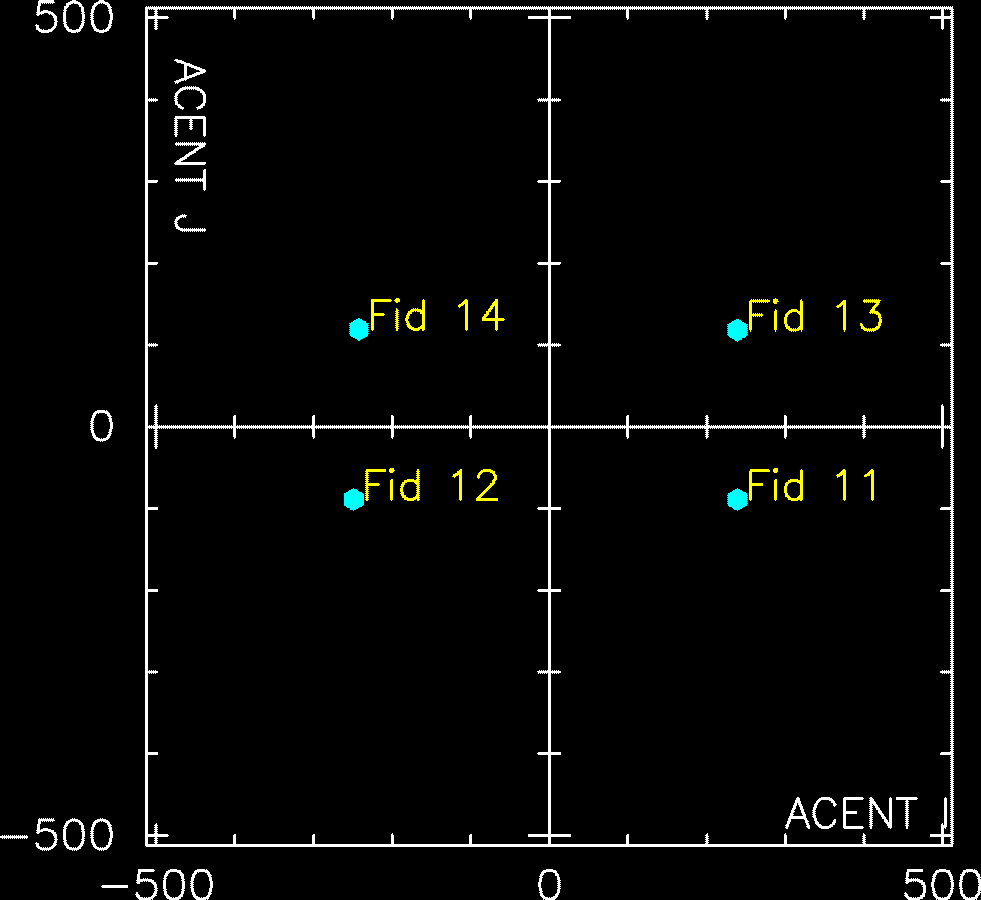
|
| Plots | Fid light 11 | Fid light 12 | Fid light 13 | Fid light 14 | |
|---|---|---|---|---|---|
| Data | S-1 | S-2 | S-3 | S-4 |
Last Modified: Apr 19, 2017
If you have questions about this page, please contact to
swolk@cfa.harvard.edu.