 |
| FIGURE 18: An image of the Sun from the Michelson Doppler Imager on the SOHO (Solar and Heliospheric Observatory) satellite. Several large and complex active regions are shown. |
|
| FIGURE 18: An image of the Sun from the Michelson Doppler Imager on the SOHO (Solar and Heliospheric Observatory) satellite. Several large and complex active regions are shown. |
 |
| FIGURE 19: Plot of 5-minute average solar x-ray flux values measured on the GOES 10 and 12 satellites over the three day period Nov 2-5. Four X-class solar flares can be seen, with the flare on Nov 4 being classified as X28, the largest ever measured. |
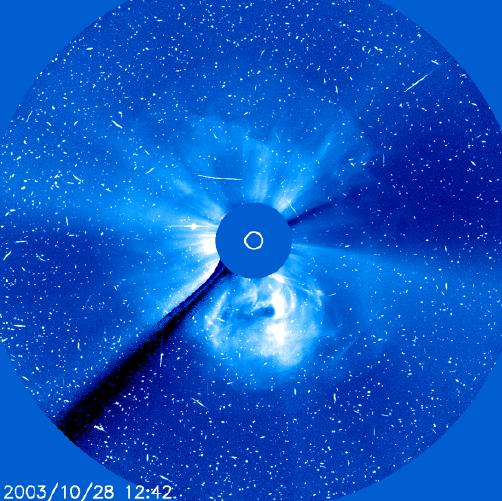 |
| FIGURE 20: An image of the solar corona taken with the LASCO coronagraph on SOHO. This shows a coronal mass ejection (CME) emerging from the sun on October 28, associated with an X17 flare from active region AR10486. The white spots and streaks in the image result from charge deposited in the LASCO CCD imager by energetic protons associated with the CME. |
 |
| FIGURE 21: Plot of proton and electron fluxes measured by the EPAM (Electron, Proton and Alpha Monitor) detectors on the ACE (Advanced Composition Explorer) satellite. This shows the slow decline in proton fluxes in the solar wind over a period of 7 days after the X28 flare on Nov 4. Unfortunately, it also shows that three lowest energy proton flux channels of the five proton flux energy channels available in real-time from EPAM were damaged by the solar activity, including the 112-187 keV channel which was the principal real-time measure of the solar wind proton flux in this energy range affecting ACIS. A new real-time measurement of protons in this energy range became available from another EPAM detector in February 2004. |
SOT and FOT team members have had to take on the role of space weather forecaster. During periods of solar activity, they must often assess the likelihood of the 100 keV proton fluence at Chandra exceeding the nominal threshold of 3 x 10⁹ protons/cm2/ster/MeV. To do this, they must account for the protection to ACIS provided by the HETG (which attenuates 100 keV proton fluxes at ACIS by about a factor of 5) or LETG (which attenuates 100 keV proton fluxes at ACIS by about a factor of 2) and by the translation of the Science Instrument Module which can protect ACIS by removing it from the telescope boresight. In addition, the SOT must give guidance to the FOT Mission Planning staff about best guess times for when radiation fluxes will be low enough to resume science observations. Typically at least a day is required to plan, build, release, review and approve a new observing schedule for Chandra after SCS 107 runs. While this is much faster than the normal 3-week mission planning process, the SOT must try to predict space weather a day or two into the future.
This explains why October and November 2003 were difficult times for Chandra operations. The Sun produced 12 X-class flares between Oct 19 and Nov 20, from solar active regions AR10484, AR10486 and AR10488. These active regions first appeared in October, but persisted for more than one 27-day solar rotation, and reappeared in November as AR10501, AR10506 and AR10507 respectively.
The experience gained from previous radiation events proved itself useful. The SOT and FOT were forewarned of impending trouble by seeing the rapid evolution of AR10484 after it appeared on Oct 19, and by several large non-Earth directed CMEs from AR10486 before it appeared around eastern limb of the Sun. Nonetheless, Chandra observing was stopped 5 times for radiation in this period: see Table 5.
In each radiation event, a radiation teleconference among SOT and FOT members is convened, initiated either by concern over rising proton fluxes, or after an automatically triggered alert when SCS 107 execution is seen in realtime telemetry. These telecons can occur anytime, day or night. In each telecon, the radiation environment is assessed and direction is given to execute SCS 107 if necessary. When SCS 107 has executed, the immediate health and safety of Chandra is assessed. Will Chandra lose track of guide stars at its current attitude over the next few days, due to Earth or Moon blockage of the aspect camera? Will the predicted rate of increase of angular momentum stored in Chandra's reaction wheels require a momentum unload?
Planning discussions for resumption of the science mission start immediately. The SOT attempts to forecast radiation fluxes, to predict when proton fluxes will be low enough to "unsafe" the science instruments and prevent the on-board "RADMON" radiation monitor software from re-triggering SCS 107. If radiation rates are sufficiently uncertain, multiple restart options are discussed, known informally as "Plan A", "Plan B", "Plan C" and so on. The radiation shutdown starting on November 2 lasted an unprecedented 5 days, and was the result of several X-class solar flares including the largest X28 flare on November 4 (Figure 15). The mission replanning discussions went on for several days, as "Plan A" and "Plan B" observing restart schedules were built, reviewed and then abandoned. Eventually, the "Plan C" schedule was used to resume science on November 8, after "Plan D" preparation had already started. As always, a "Go/No-Go" telecon was held at the planned time for uplink of the new observing schedule to Chandra, to finally assess radiation levels and give or deny approval for the mission restart.
The radiation events of this time period were exceptional in several ways. For the first time, a discrete, step function increase in the CTI of the ACIS CCDs was observed just after this storm. Also associated with this storm was a significant drop in the measured background rate of the S3 CCD, which is used in the CTI calculation. As the background rate has recovered to pre-storm values, the magnitude of the apparent increase in CTI has declined, but the step function behavior remains. The damage to ACIS occurred despite the correct operation of SCS 107, which protects the ACIS CCDs from 100 keV protons. It is thought that the damage resulted from high energy (MeV) protons, that are capable of penetrating the normal ACIS shielding. Before launch, such hard proton events were expected to be the dominant damage process for the ACIS CCDs.
In addition, these hard protons also affected the CCD in the aspect camera on Chandra. The star images tracked by the aspect camera for controlling the spacecraft attitude were corrupted by charge deposited from the solar protons. Chandra's OBC needs at least 2 guide stars to perform attitude control, and also rejects corrupted data from the aspect camera to prevent attitude disturbances. On several occasions, the number of guide stars being used for attitude control fell to 0 from the normal 5. If this situation had persisted, Chandra would have reverted to attitude control using the Sun, but the periods were thankfully brief and the Kalman filter used in the OBC attitude control can flywheel through short interruptions of this sort.
Finally, these solar storms were so severe they even damaged the LEMS30 telescope (Low-Energy Magnetic Spectrometer) in the EPAM instrument on the ACE satellite. This knocked out our only source for realtime flux measurements of 100 to 200 keV solar protons, available from NOAA's Space Environment Center. However, starting in February 2004, the SEC began providing new real-time flux data from the (undamaged) LEMS120 detector in EPAM, covering approximately the same energy channels as the LEMS30.
Robert Cameron for the Science Operations Team
References
ACIS CTI measurements from Catherine Grant (MIT):
http://space.mit.edu/~cgrant/cti/
ACE data are available from the Space Environment Center (SEC) at NOAA:
http://www.sec.noaa.gov/ace/ACErtsw_data.html
Chandra Science Operations Team Radiation Monitoring:
http://cxc.harvard.edu/mta/RADIATION/
GOES X-ray flux data are
available from the SEC:
http://www.sec.noaa.gov/today.html
SOHO solar
images are available from:
http://sohowww.nascom.nasa.gov/