The Chandra X-Ray Observatory (CXC)
Calibration of ACIS Continuous Clocking (CC) Mode
The ACIS detectors on-board the Chandra X-ray Observatory can operate in two observing modes. In the timed exposure (TE) mode, each chip is exposed for approximately 3 seconds, or less, if only a portion (sub-array) of a chip is being read-out. Once the exposure is complete, the data is transfered from the imaging array to the frame store array. In the continuous clocking (CC) mode, data is continuously (2.85 msec per row) transfered from the imaging array to the frame store array. In the process, a 2D image is collapsed into a 1D image. The exact pattern of CTI-induced grade morphing depends on both the time scale at which the data is clocked-out and the time scales of the traps (i.e., how long the charge remains trapped before being released down stream of an event). Thus, the effects of CTI-induced grade morphing are different in CC mode compared to TE mode.
Figure 1 shows a plot of the 256 flight grades that are assigned on-board to each detected event. These 256 events are latter binned into the 7 ASCA grades during ground processing. In order not to saturate telemetry, not all flight grades are telemetered to the ground. The flight grades in green show events that mapped into good ASCA grades (0,2,3,4 and 6) and the flight grades in red show events that are mapped into bad ASCA grades (1,5 and 7).
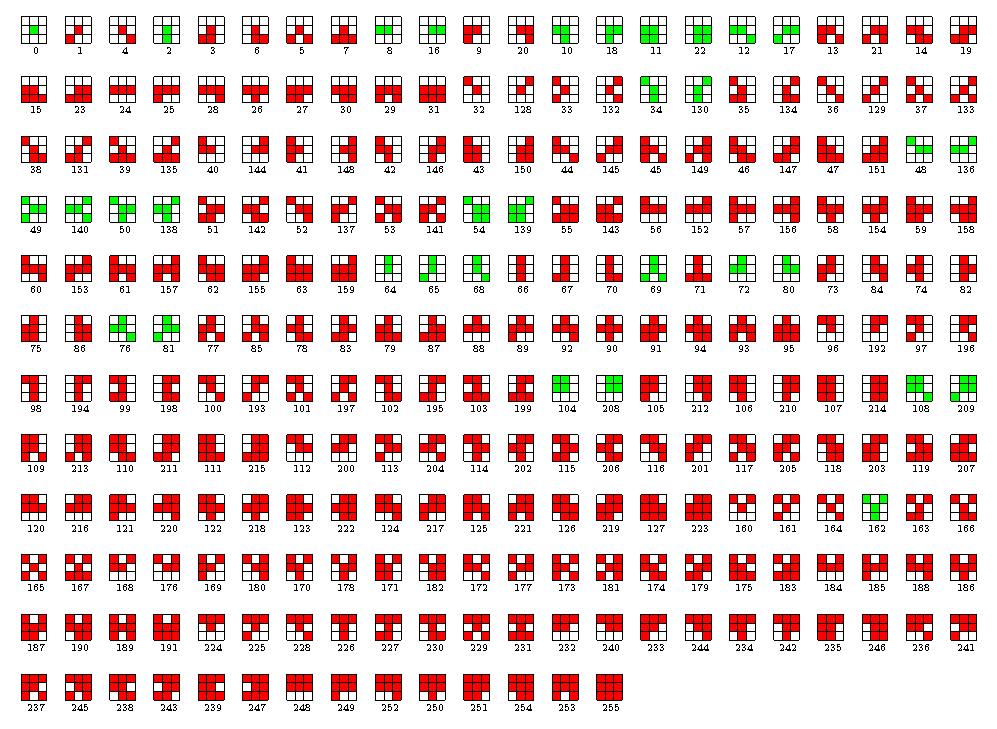
Fig. 1
The cumulative grade distribution from ACIS external calibration source (ECS) data in TE and CC mode is shown in Fig. 2. Notice that that are far fewer grade 0 events in CC mode compared to TE mode. Also, there are far more flight grade 66 events in CC mode compared to TE mode data. Flight grade 66 events (which are bad events) are produced by cti-induced grade morphing from flight grade 2 events (which are good events). Prior to Dec. 2009, flight grade 66 events were not telemetered in CC mode. This means that approximately 10% of good events were left on-board and the QE in CC mode with the flight grade selection used prior to Dec., 2009 was approximately 10% less than that in TE mode. Since Dec. 2009, additional flight grades, including flight grade 66, are telemetered to the ground in CC mode and the resulting QE in CC and TE mode are in good agreement.
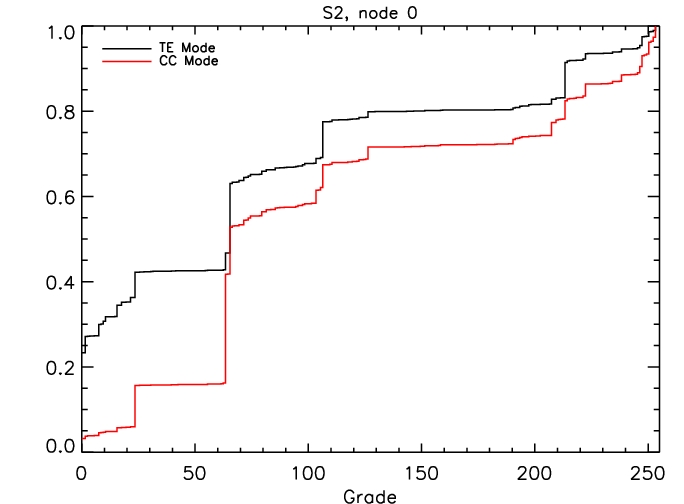
Fig. 2
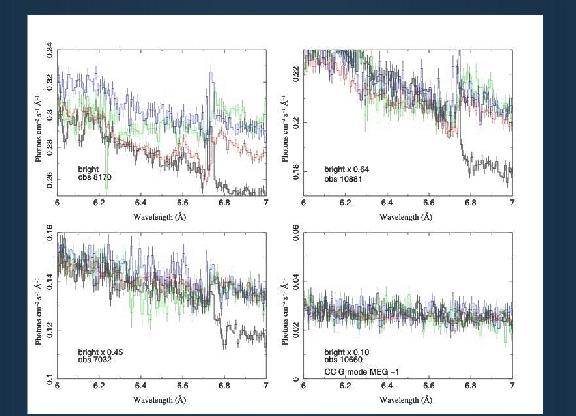
In addition to affecting grade morphing, CTI also affects the detector gain differently in TE and CC mode. To properly account for the effects of CTI in CC mode data, a different set of trap maps must be used. These trap maps are presently being generated and tested. Figure 3 shows an example of CC mode ECS data corrected with the set of trap maps developed for TE mode data (red) and with a test version of CC mode trap maps. By default, acis_process_events uses the TE mode trap maps for all ACIS data.
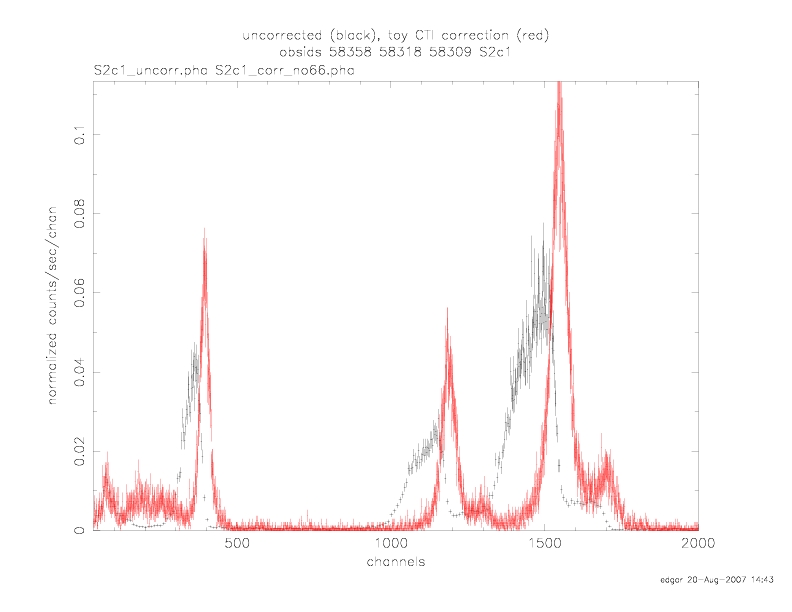
Fig. 3