The High Resolution Camera (HRC) detectors are occasionally active while they are in a stowed position. Data taken during these active intervals can be used to study HRC backgrounds. Most "events" that HRC sees during the stowed position are cosmic rays which are missed by the anti-coincidence shield, and hence, we can also use the stowed data to study changes in the anti-coincidence shield efficiency.
In this study, we address following points:
HRC level 0 event data which satisfy all of the following criteria are extracted from archive.
The level 0 data are processed with the standard HRC function, hrc_process_events, but with no aspect solution applied.
Extracted data are shown in Table 1 below.
Table 1: Data and Plots
| Detector | Data | Plot |
|---|---|---|
| HRC I RANGE_SWITCH_LEVEL=115 | Data | Plot |
| HRC S RANGE_SWITCH_LEVEL=125 Section 1 | Data | Plot |
| HRC S RANGE_SWITCH_LEVEL=125 Section 2 | Data | Plot |
| HRC S RANGE_SWITCH_LEVEL=125 Section 3 | Data | Plot |
| HRC S RANGE_SWITCH_LEVEL=125, high precision timing | Data | Plot |
If you are interested in a more detailed description of the selection criteria, please check: Detailed Description of Data Selections and Reduction.
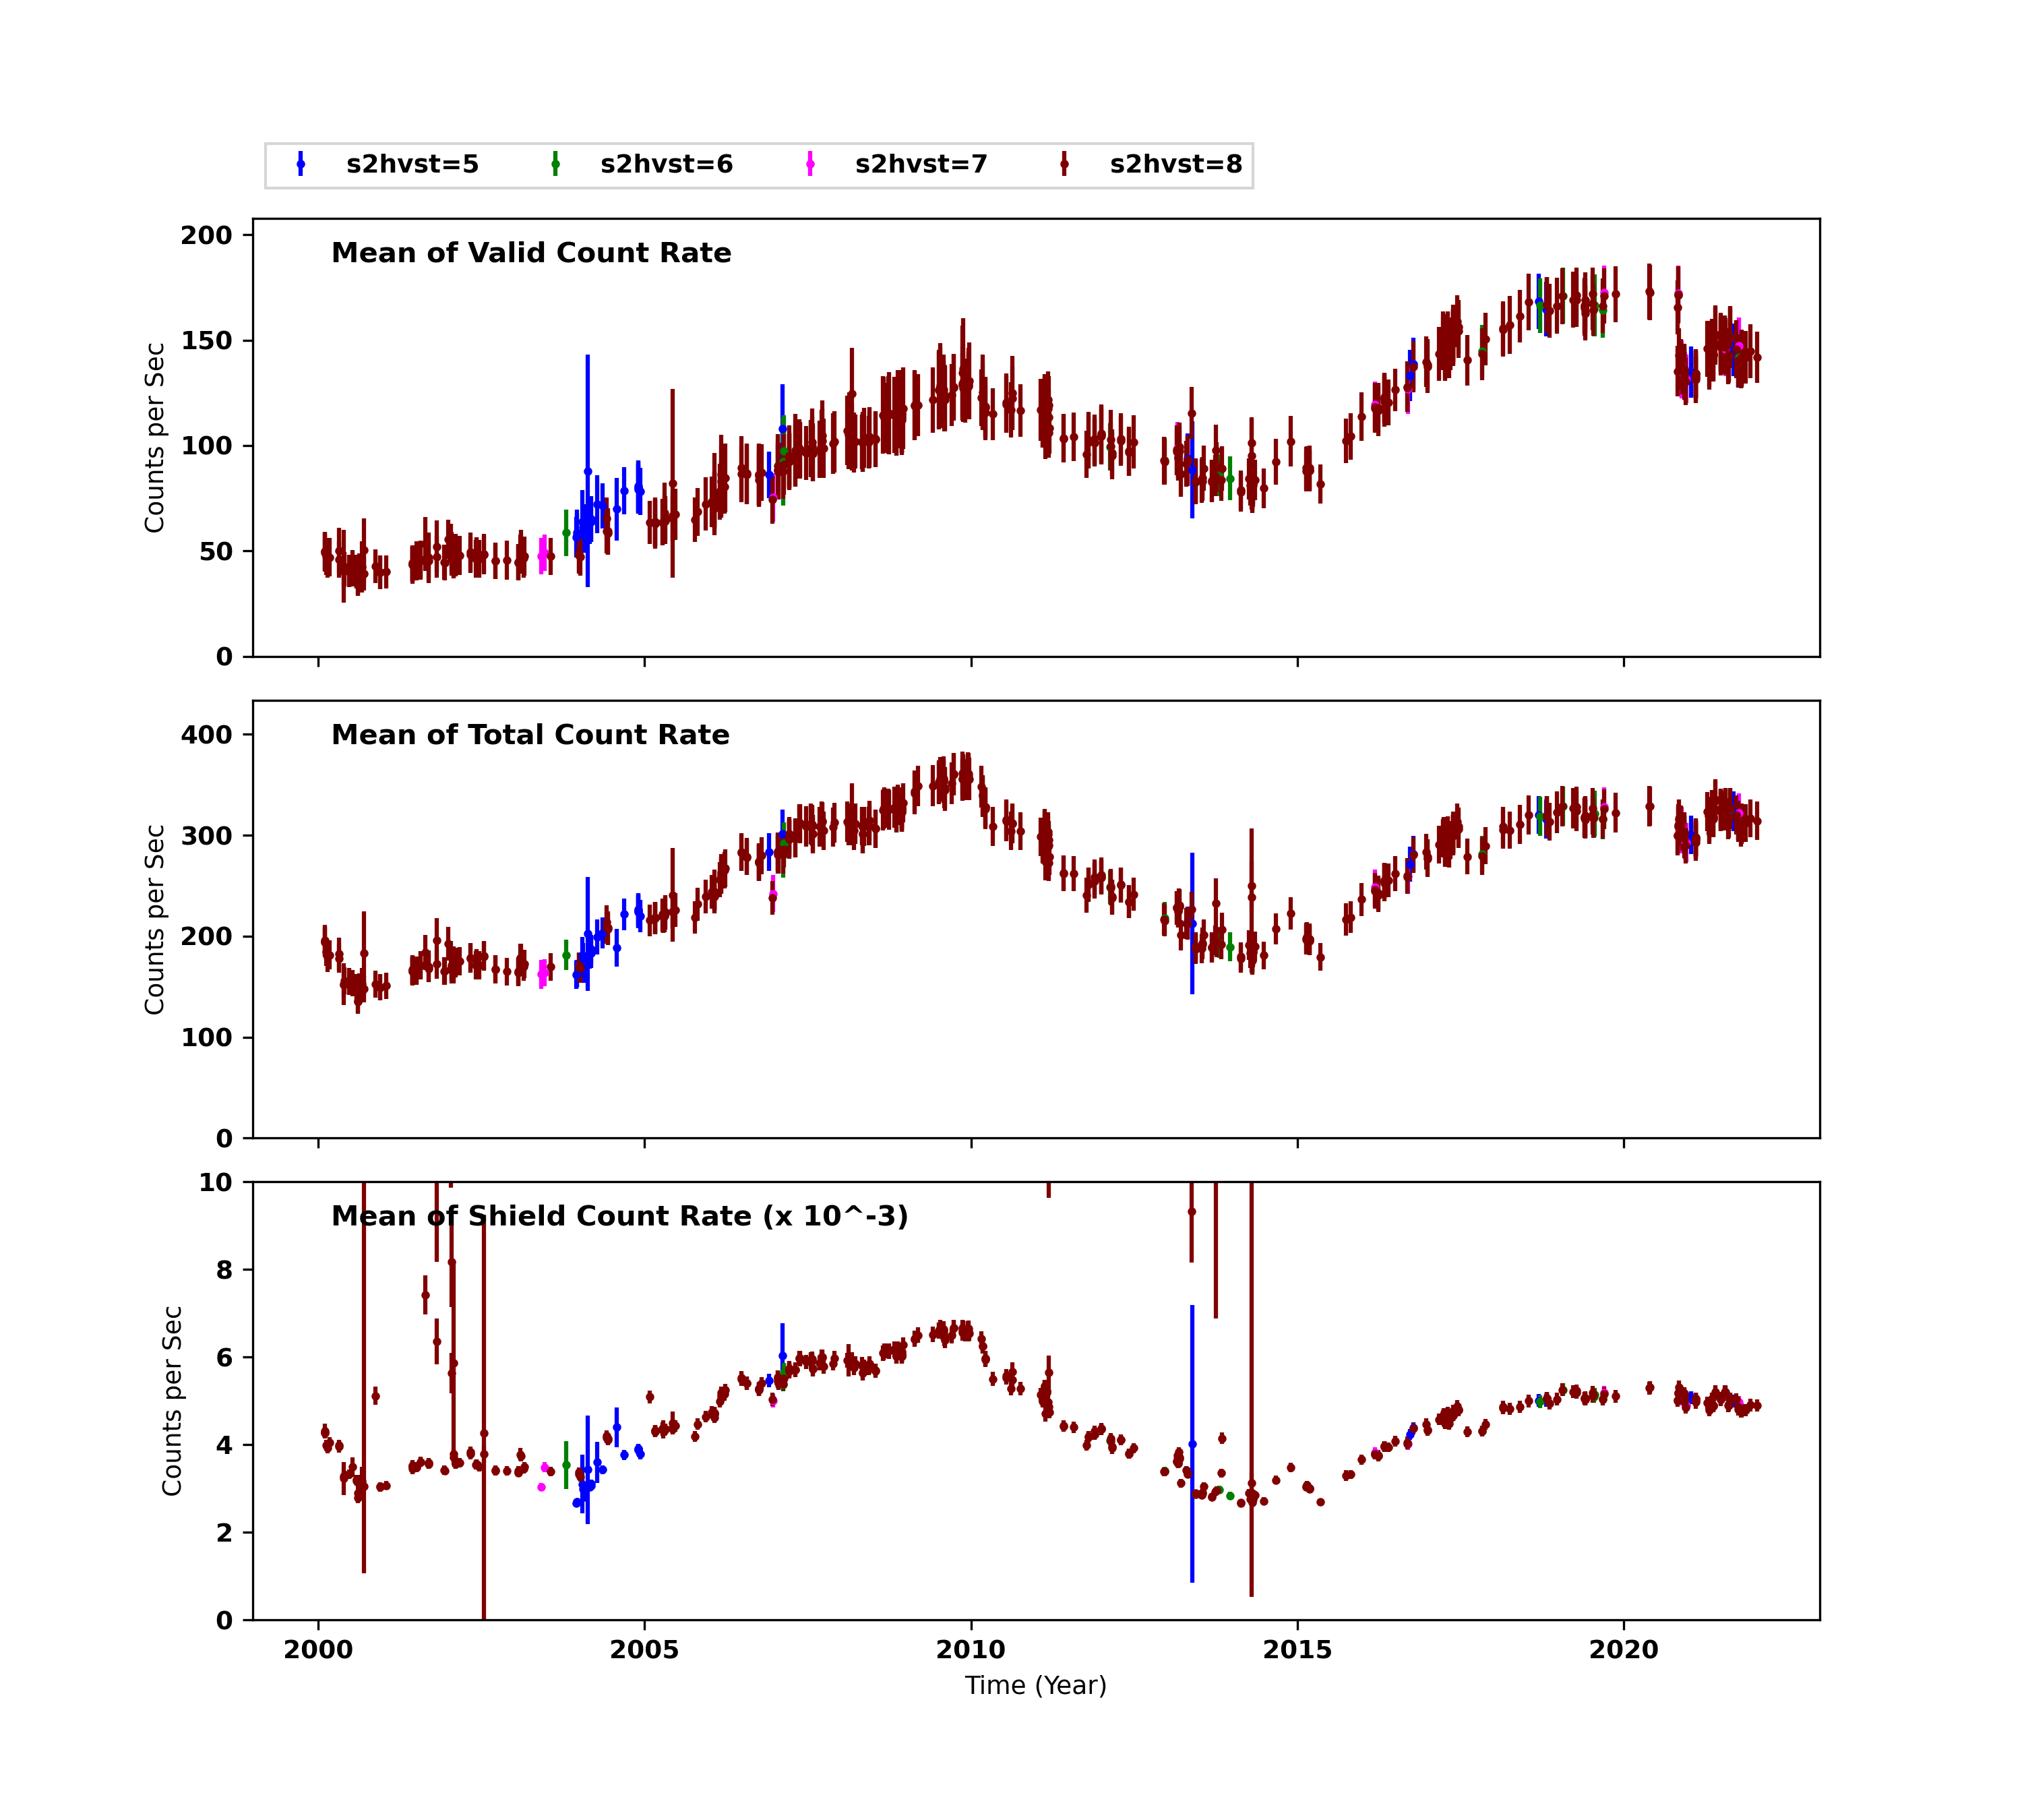
When the HRC is in the stowed position it is usually in the next-in-line telemetry format; the amount of data telemetered to the Earth is very limited, and the data are usually telemetry-saturated. However, the HRC also reports three different count rates. The first rate is the total rate, which is the count rate of all MCP events (X-rays and high-energy particles). The second rate is the valid rate, which counts the fraction of the "total" events that pass the on-board event validity tests (non-vetoed rate). The last rate is the shield rate, events due to high-energy particles counted by anti-coincidence shield. Since when the HRC is in the stowed position, the MCP rates (total and valid) are dominated by high-energy particles, we expect the three rates should closely follow the Electron Proton Helium Instrument (EPHIN) Integral channel flux (see Figure 1 below, or a memo 'Raw HRC Antico Rate v EPHIN Flux' by M. Juda).
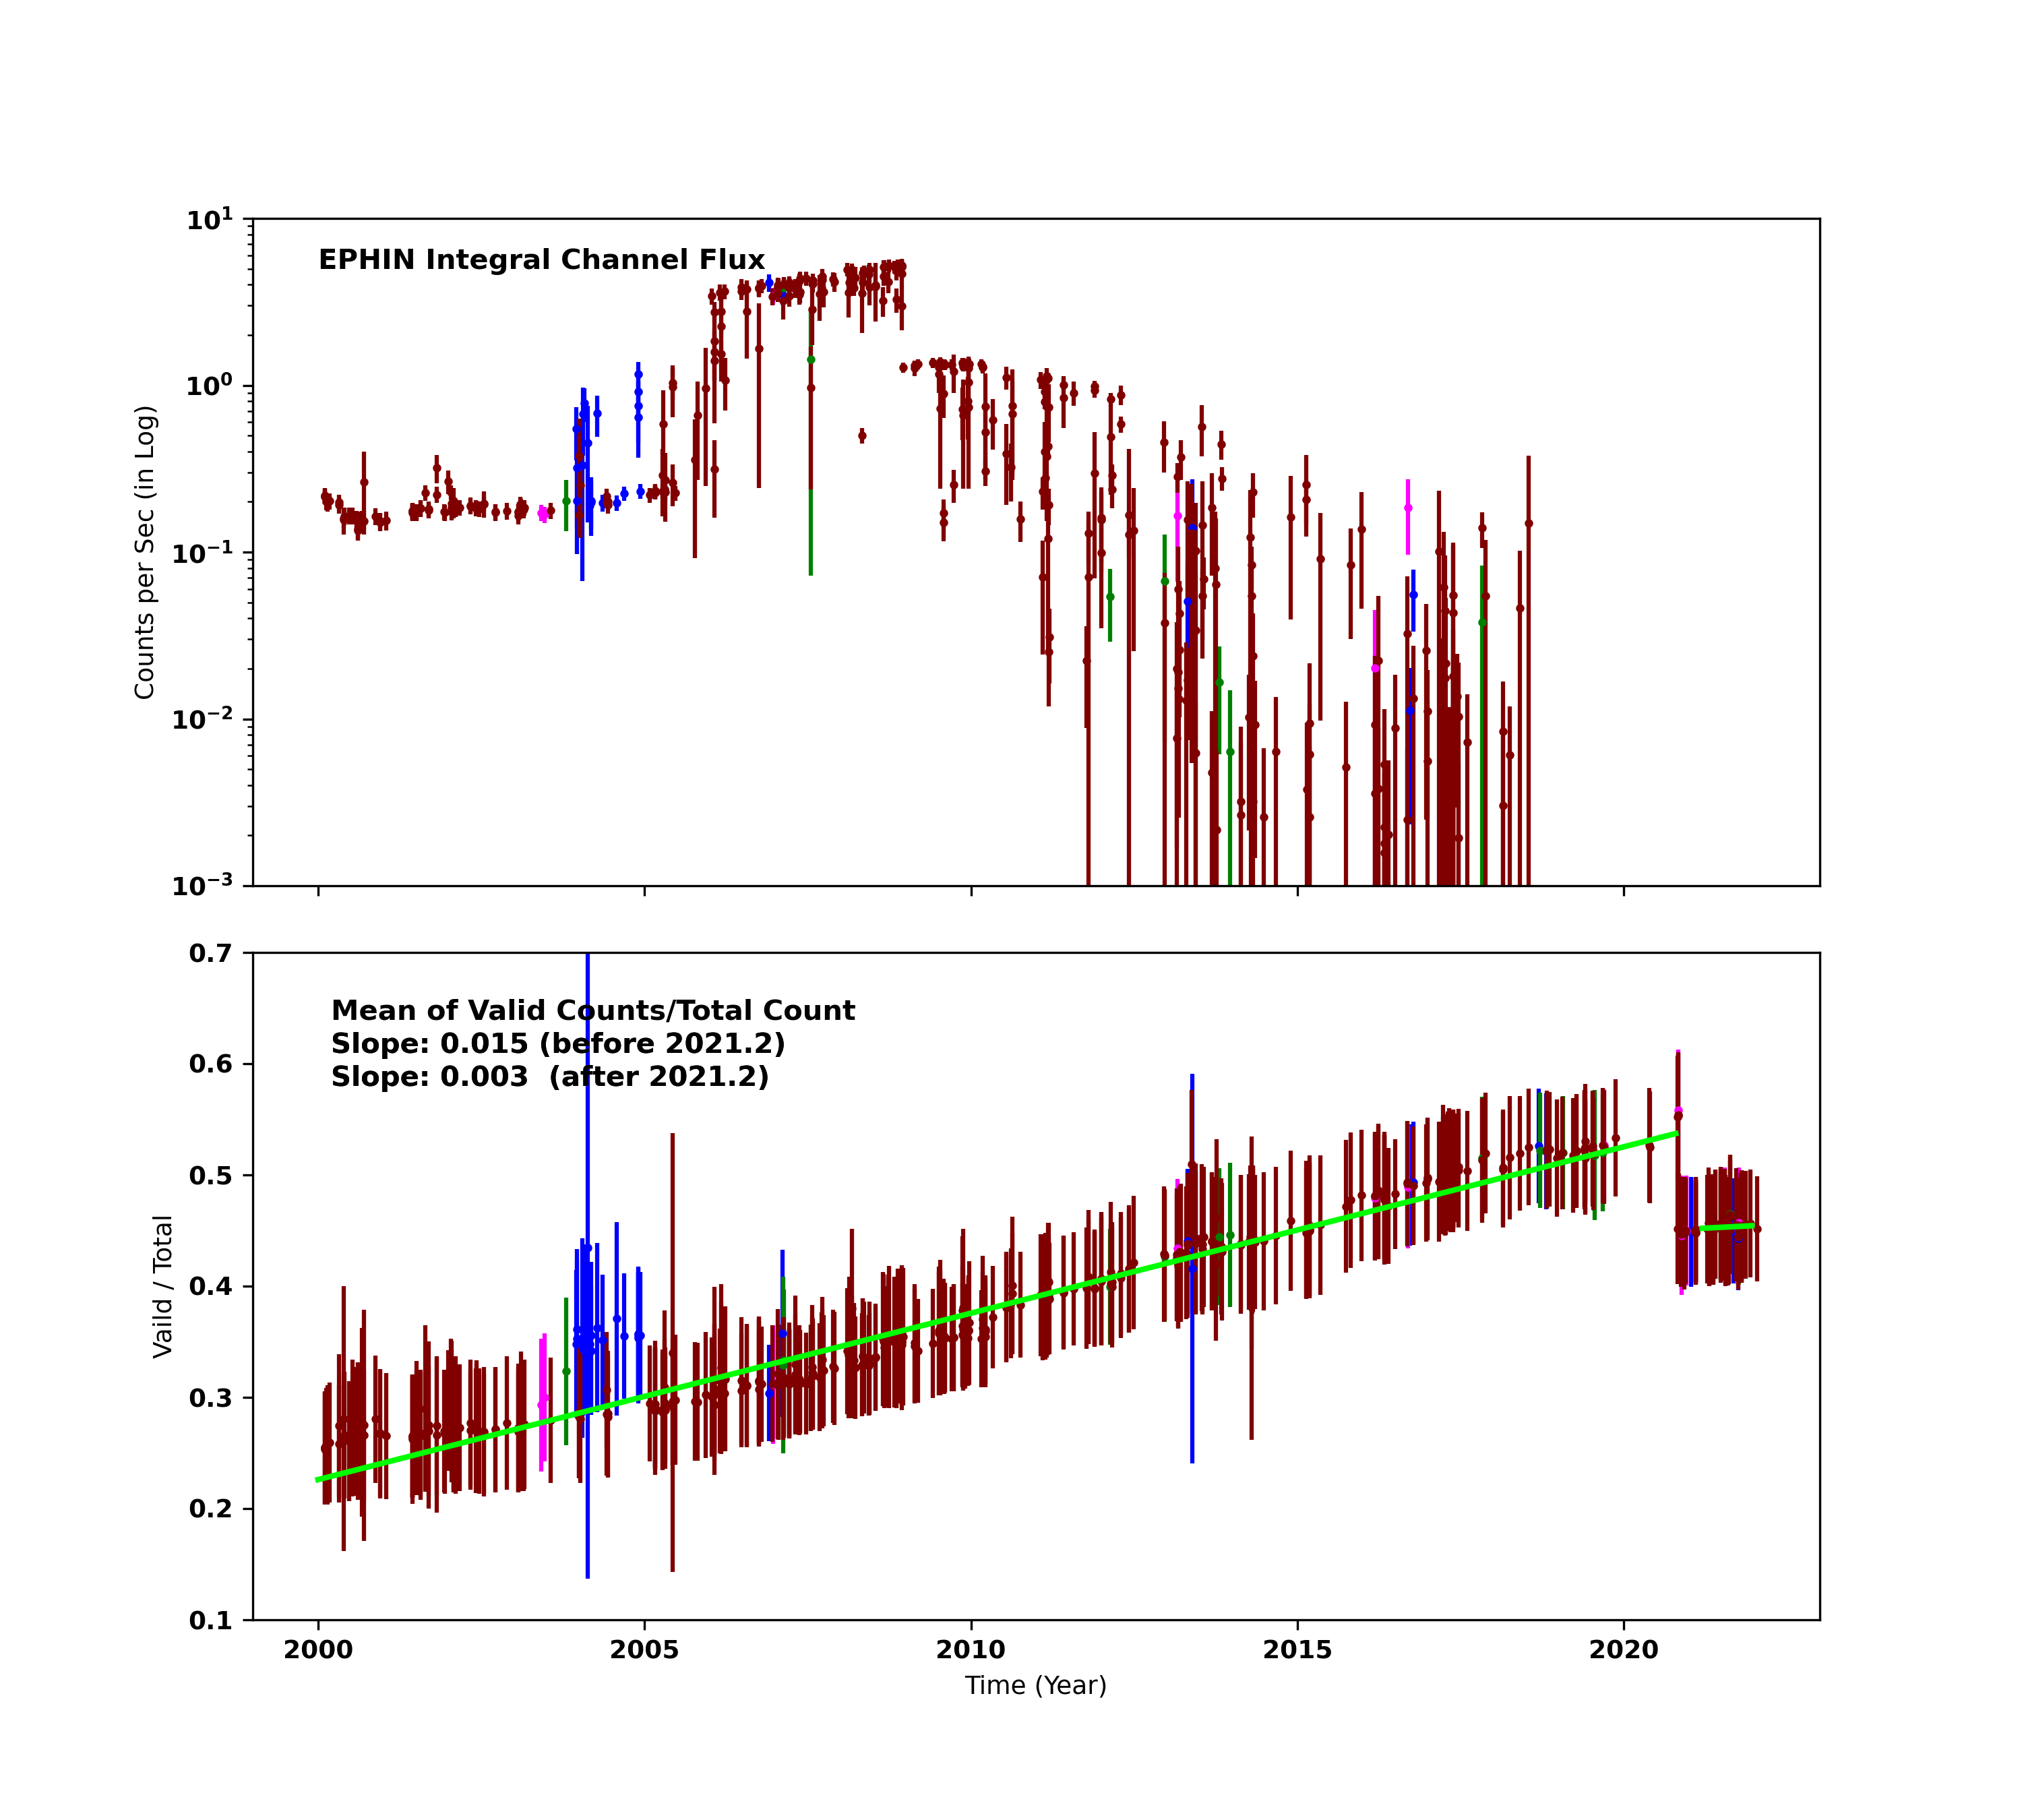
Temporal variations of the HRC-I valid, total, and shield rates, as well as those of the EPHIN Integral channel flux and the valid/total rate ratio are shown in figure 1a. The fitte line on ratio of valid / total count rates against time is a linear regression of the second power for Hrc I, but fitted lines for Hrc S are a simple linear regression (see Table 1 "Plot").
Temporal variation in the event PHA peak for the HRC-I are shown in Figure 1b. The fitted lines in Figure 1b are computed using a robust method on the data with an anti-coincidence shield PMT HV. The width of PHA peak in Figure 1b is the standard deviation of the Gaussian fit on the peak.
Because of the modulation of the cosmic-ray flux due to the solar-activity cycle (see EPHIN Integral Channel PHAs), HRC anti-co shield and MCP valid and total count rates change non-linearly with time, and hence, we did not fit a line. The value of the EPHIN integral channel flux from the beginning of 2006 onward is artificially high due to the EPHIN running in a current-limited state.
Figure 1a: Time Evolution of MCP Valid Count Rate, Total Count Rate,
and the ratio
of Valid Count Rate/Total Count Rate of Hrc I
Figure 1b: Time Evolution of PHA Peak Median and PHA Peak Width
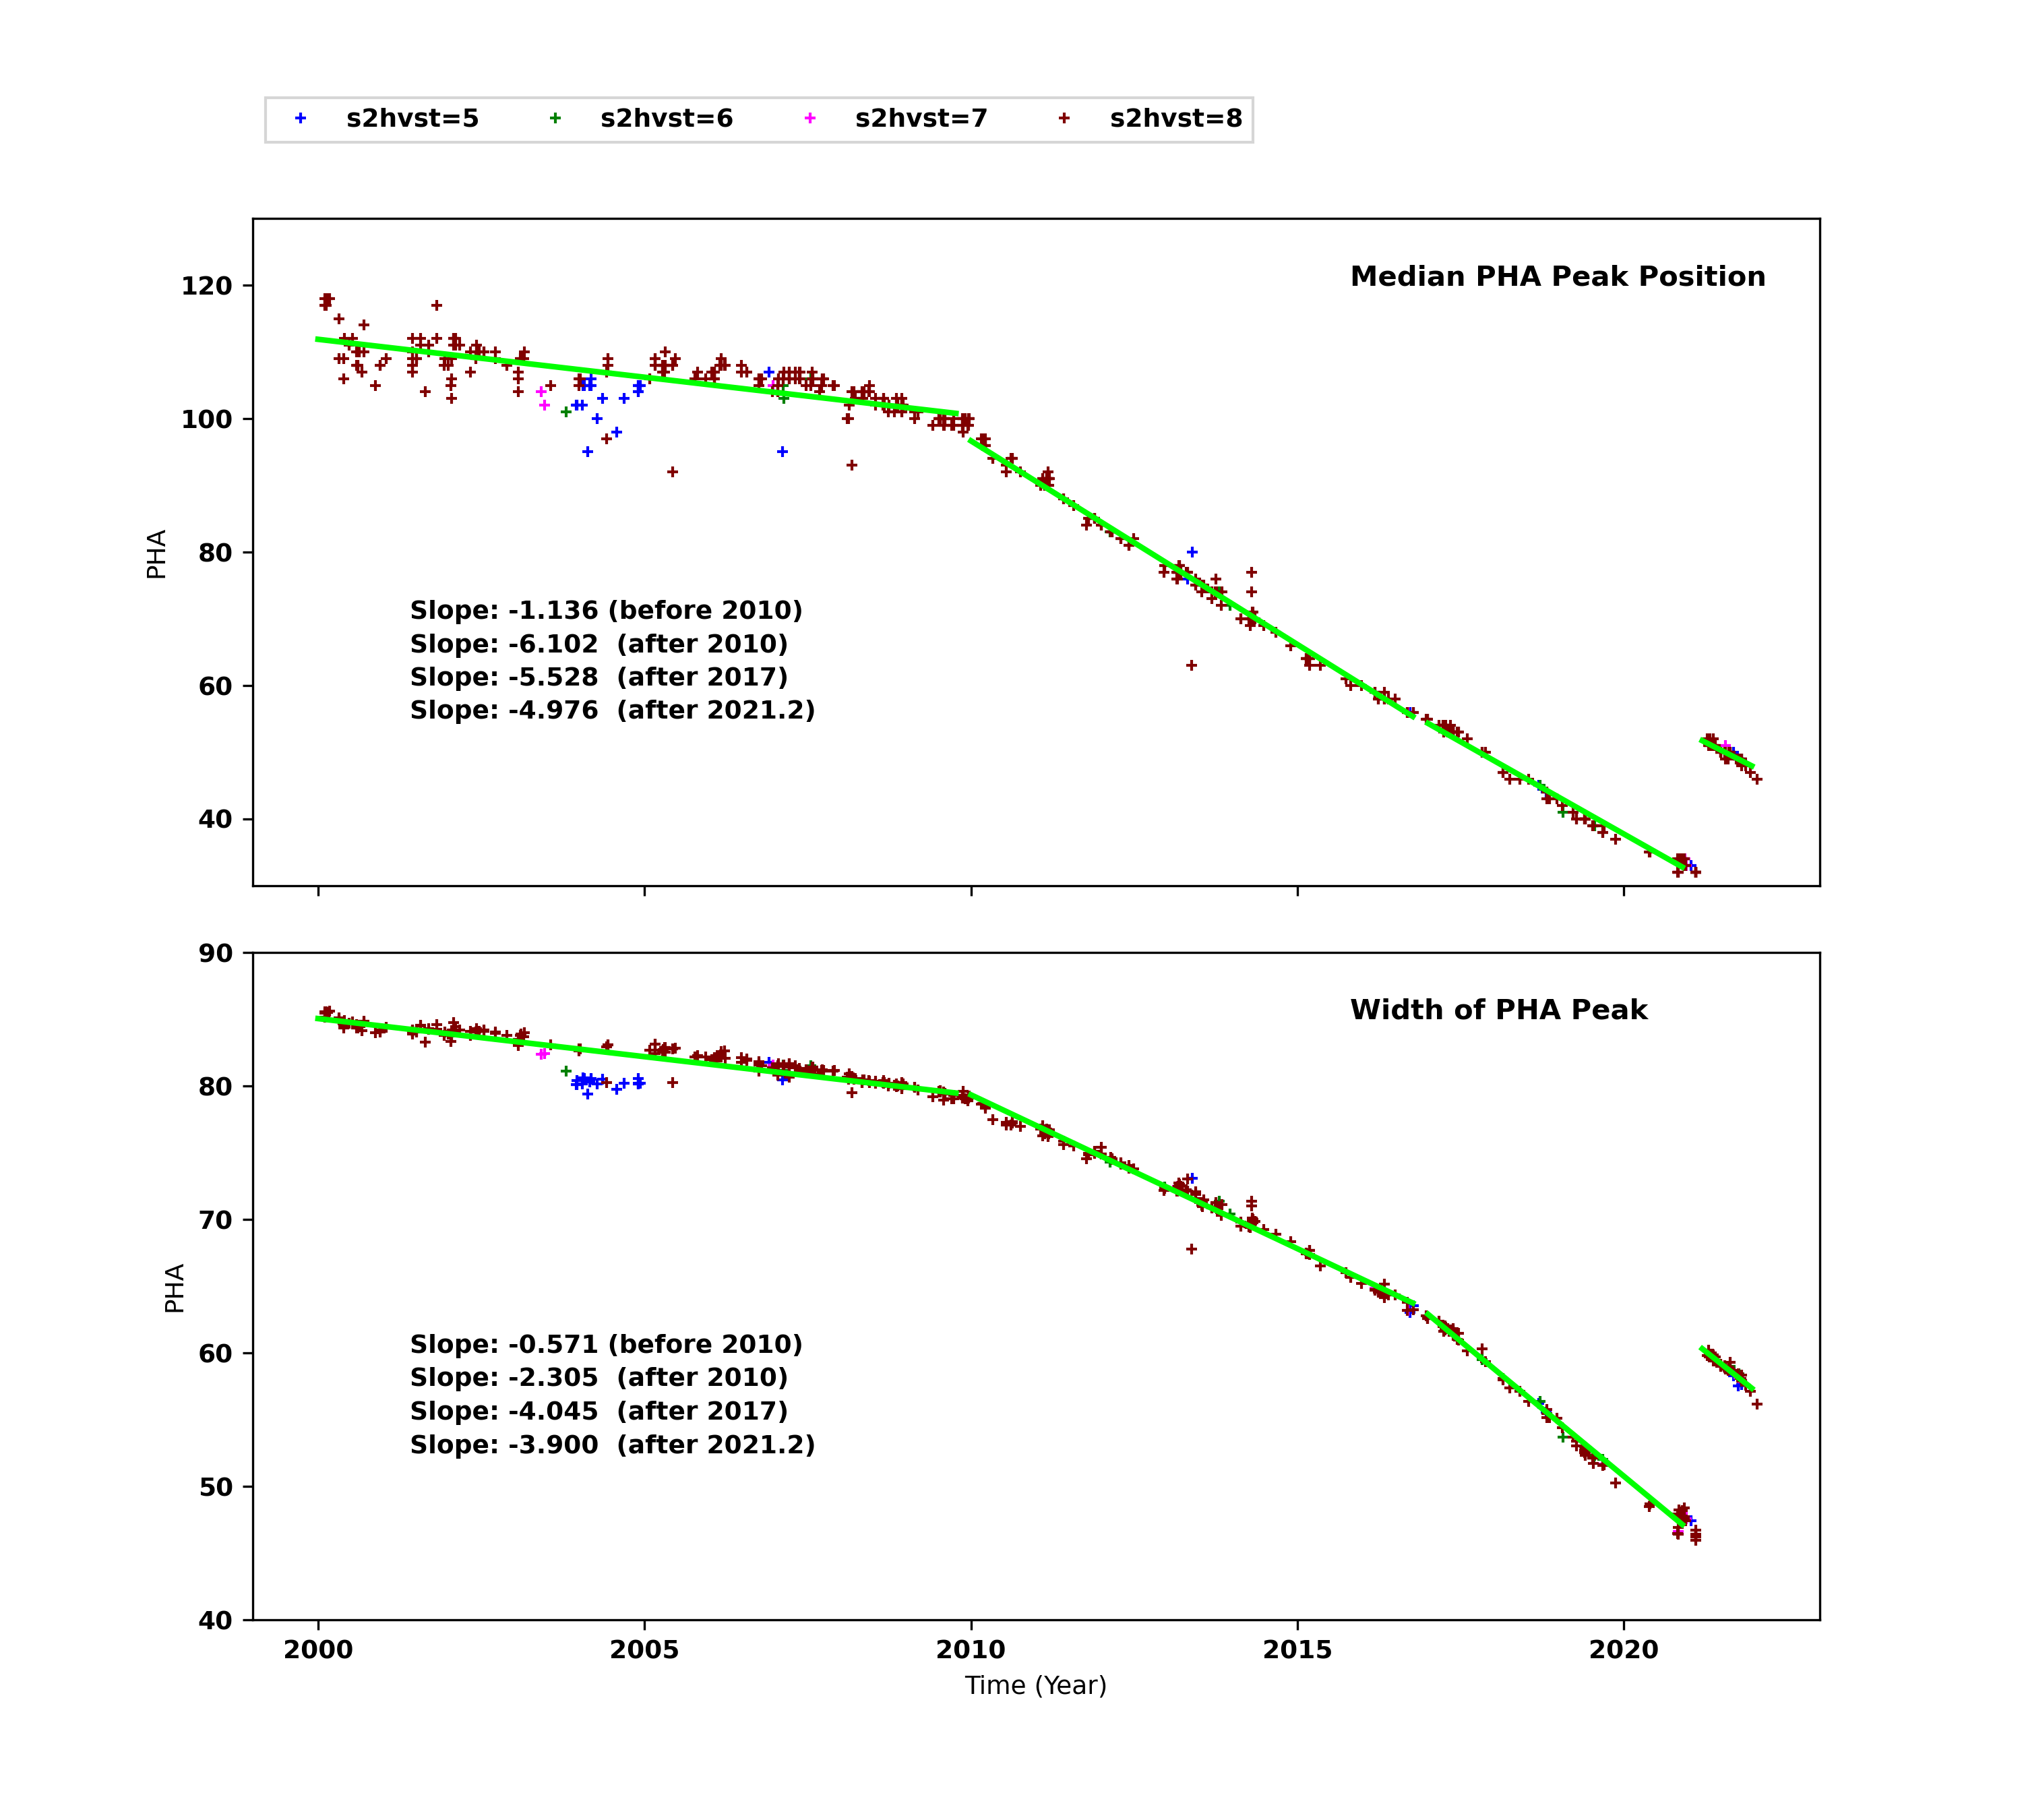
If you like to see the similar plots for Hrc S and Hrc S High Precision cases, please use the links in the Table 1. Note; since the parameter setting changed in 2012 for Hrc S and Hrc S High Precision, PHA peak position and width trends plots display a big jump around year 2012.
Although the isotropic flux of high-energy particles might lead one to expect the background to be spatially uniform, shielding by spacecraft and detector structures can be expected to produce some variations in the spatial distribution. We created cumulative background maps to study the variations.
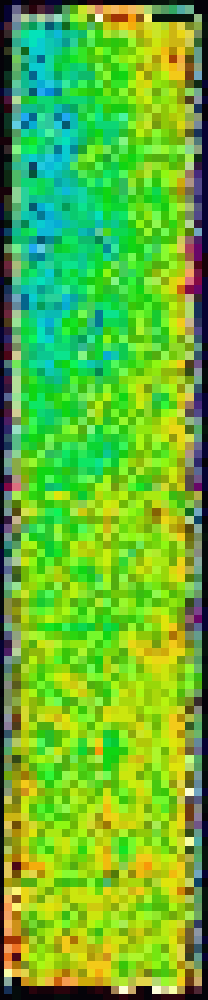
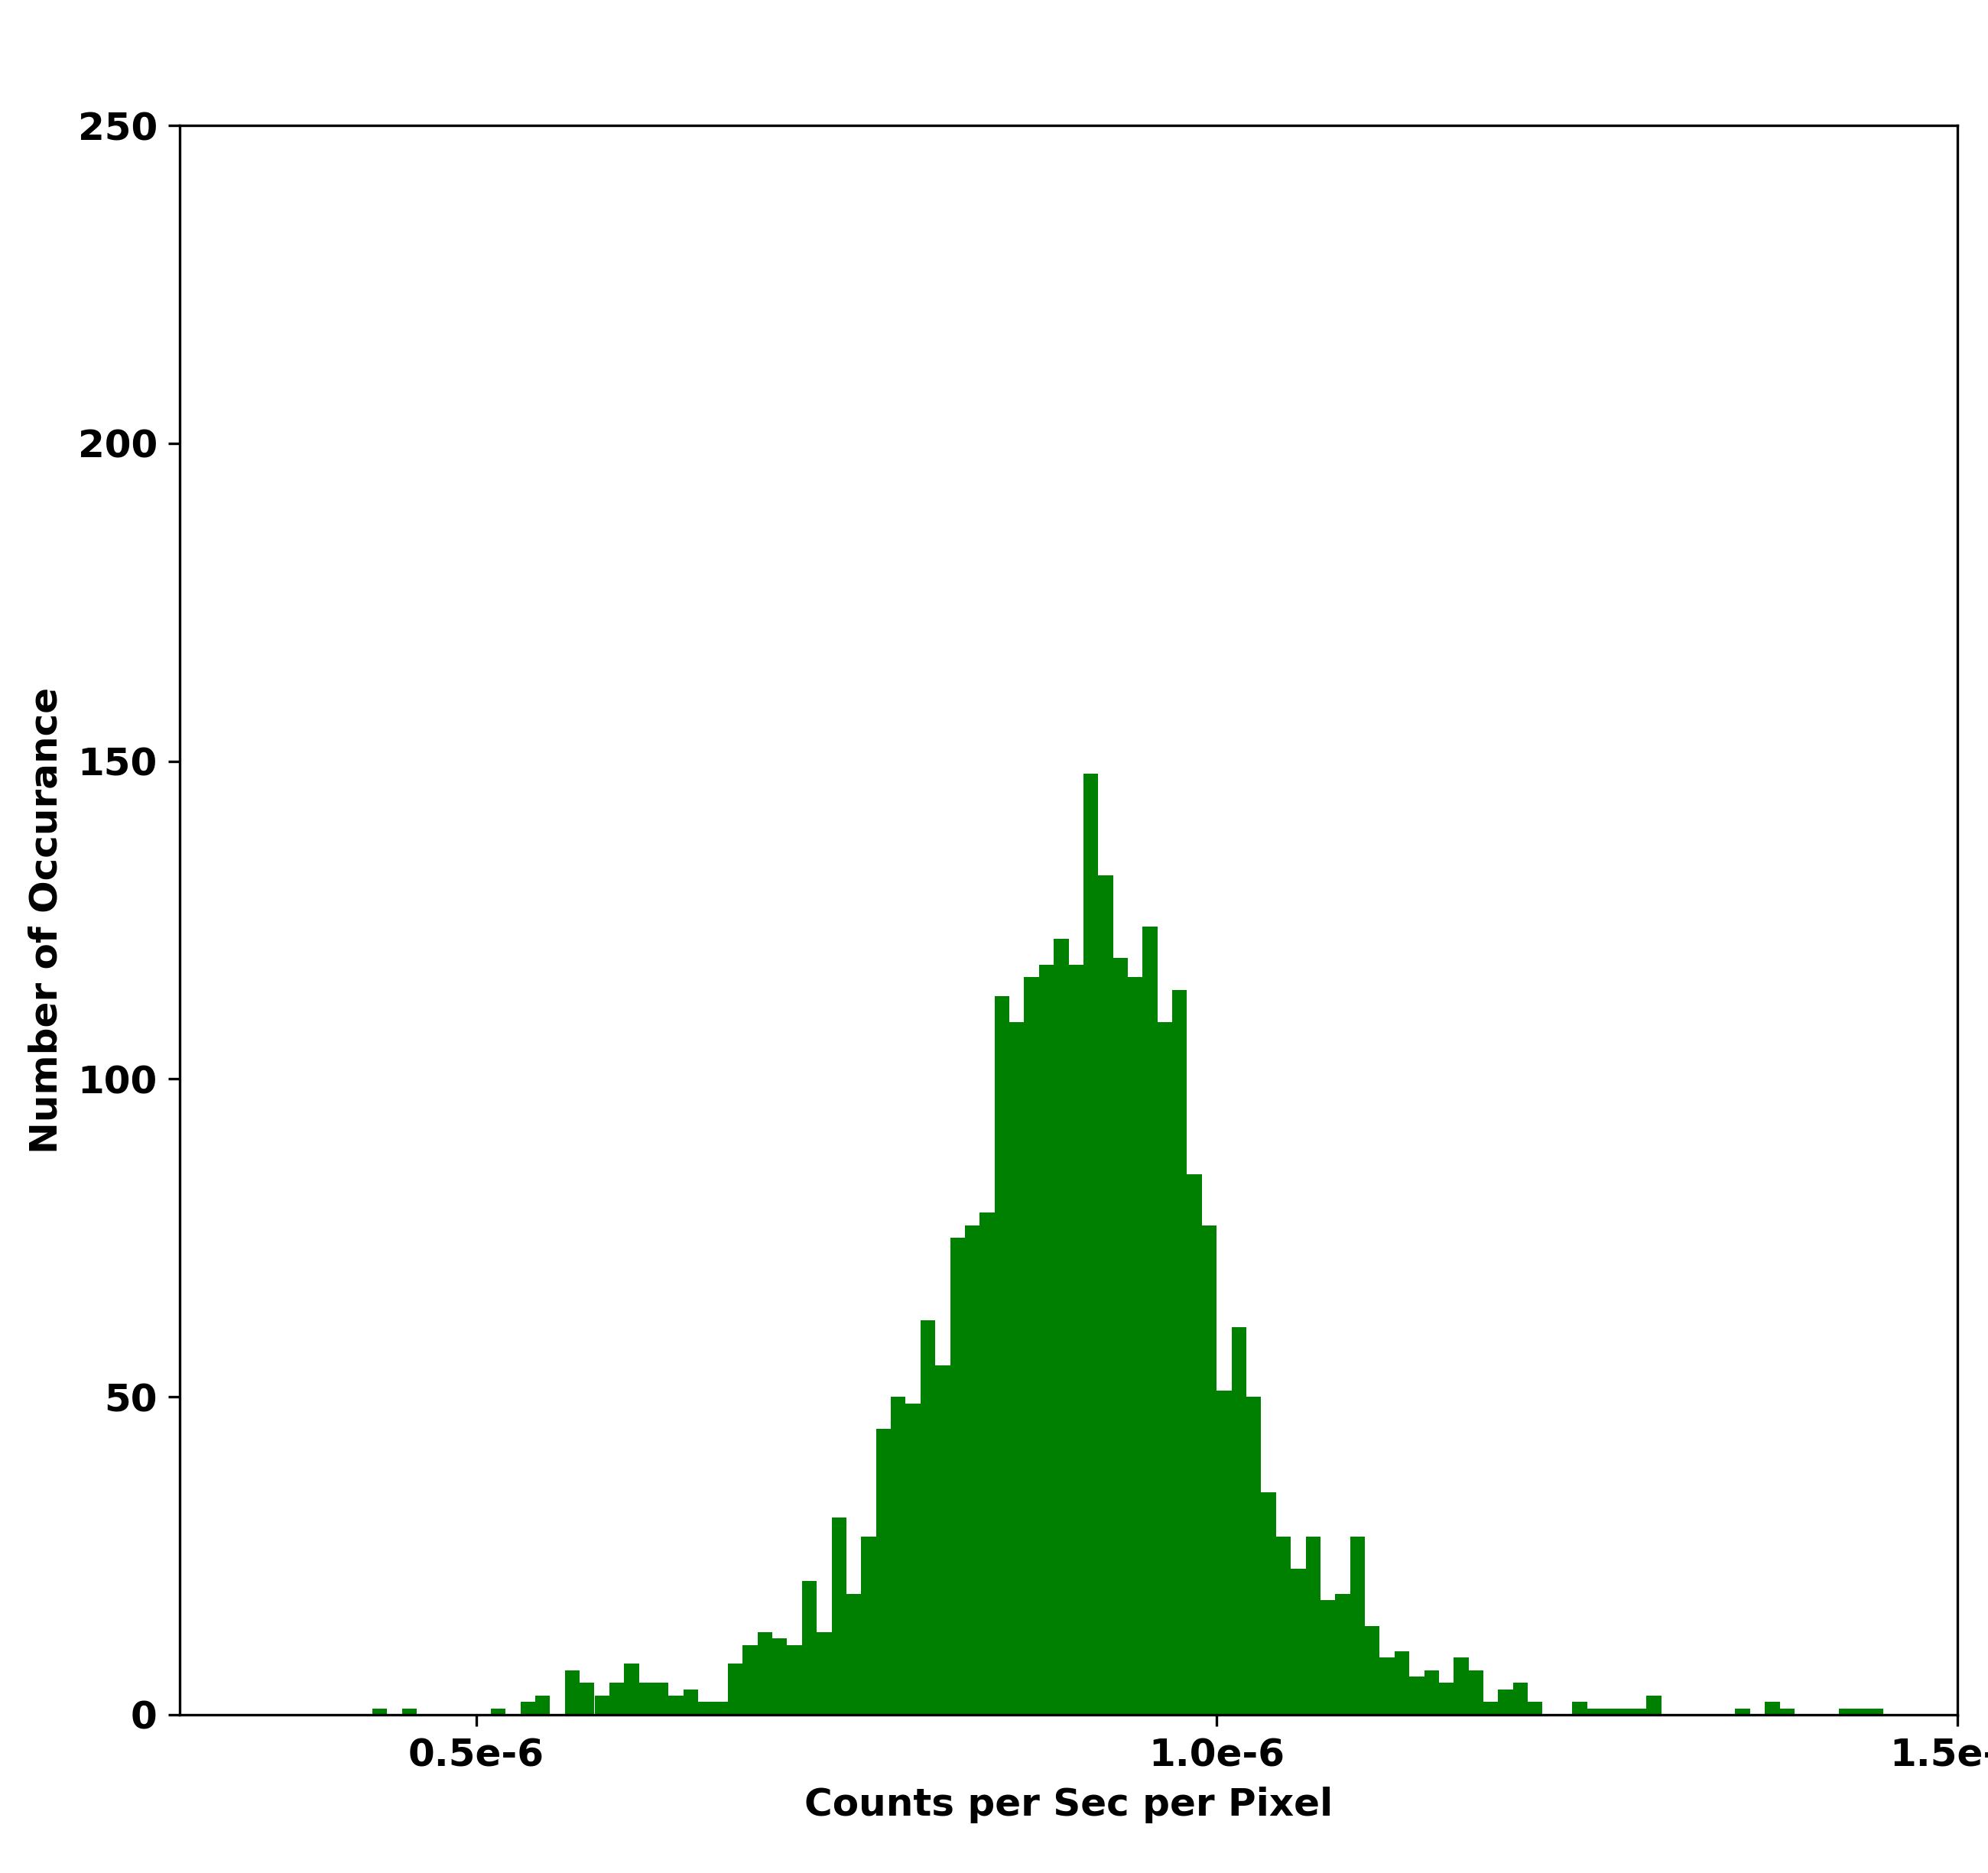
To create the maps, we first combined all the evt1 files for the individual time intervals (the resulting level event file for Hrc I). The data were binned by 256x256 pixels to create an image fits file. We apply a dead-time correction to the data to account for the effects of telemetry-saturation. The dead-time correction increases the count rates about 15 times of the telemetered count rates. The image is normalized to per sec per pixel. Figure 2 shows the HRC-I background map ( fits file ) and the distribution of count rate per sec per pixel area. The maps shown below had status bit filtering applied to their input event lists, which removes "bad" events from the data (for maps without the status bit filtering, please check Time Evolutions section). The red color indicates higher counts and the blue indicates lower counts. For this background map, we also corrected with an instrument map. For more details, please see instrument map correction page.
Please also check HRC I Cumulative Map Page.
Figure 2: HRC I Cumulative Background Map and Count Rate Histogram
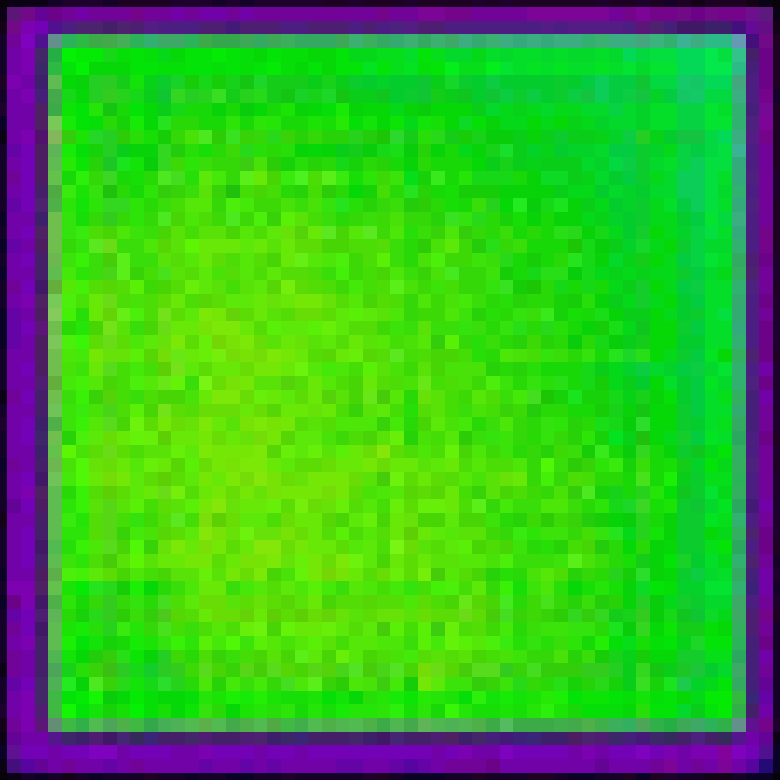
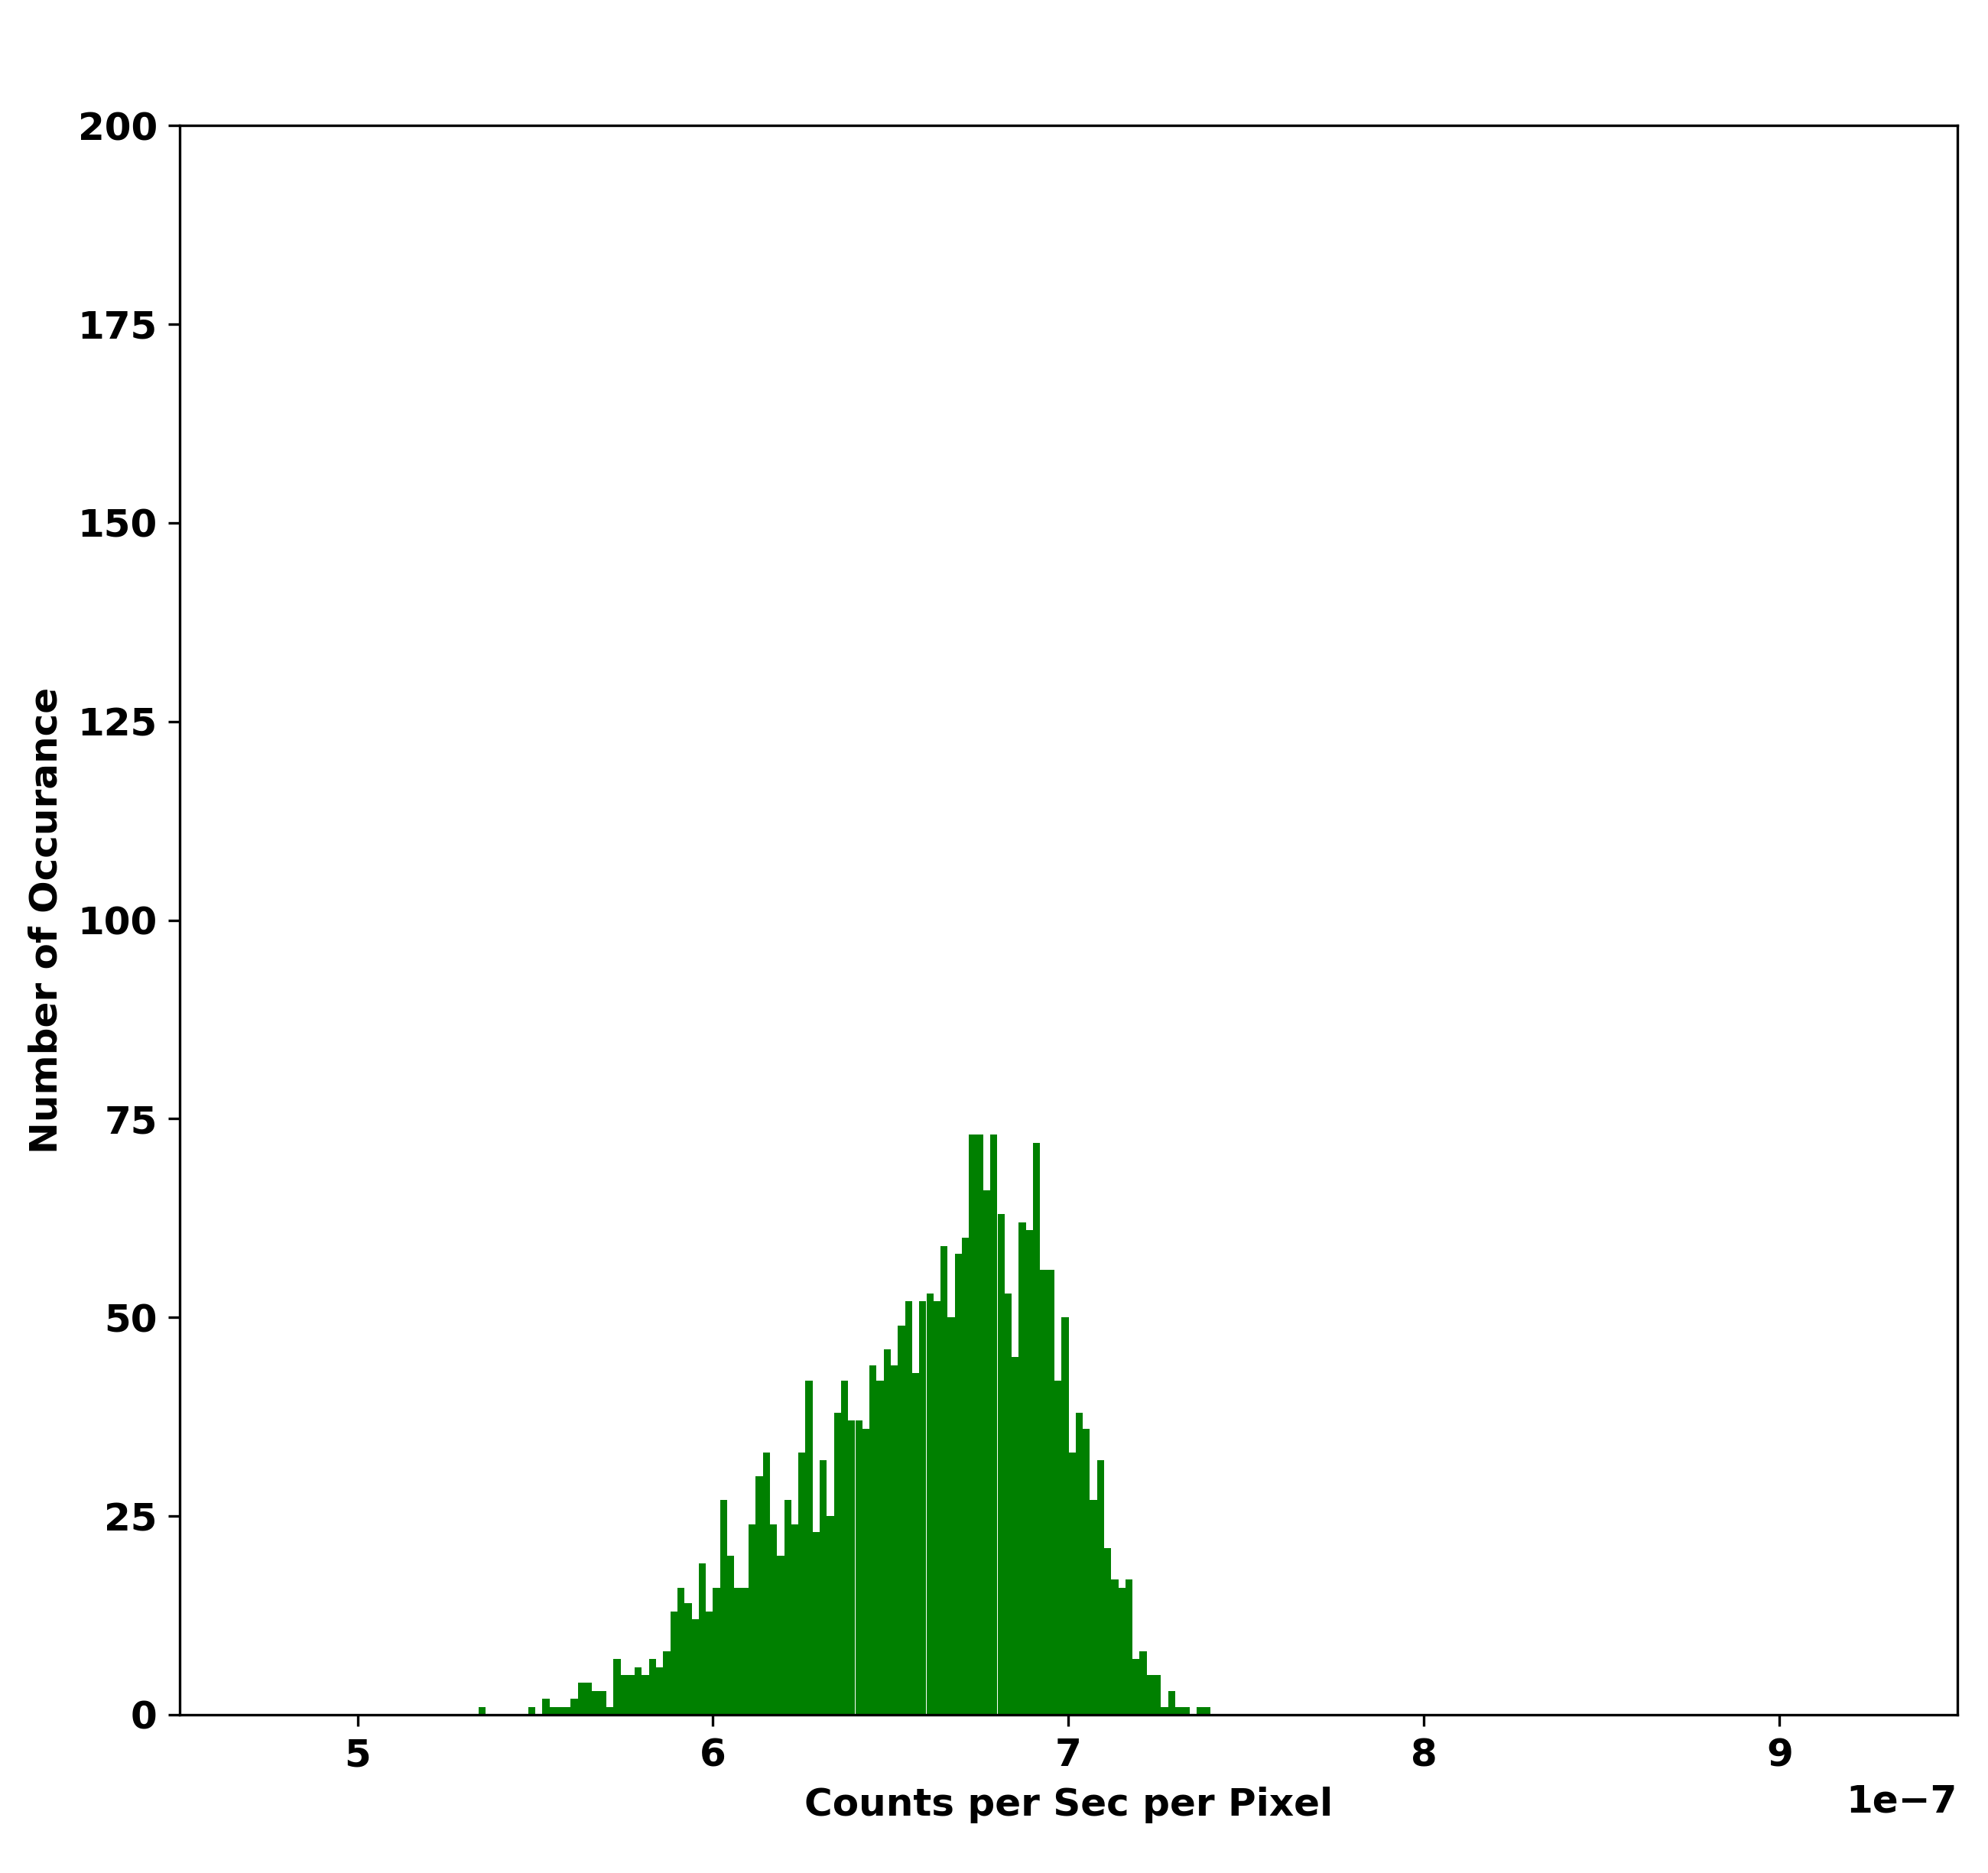
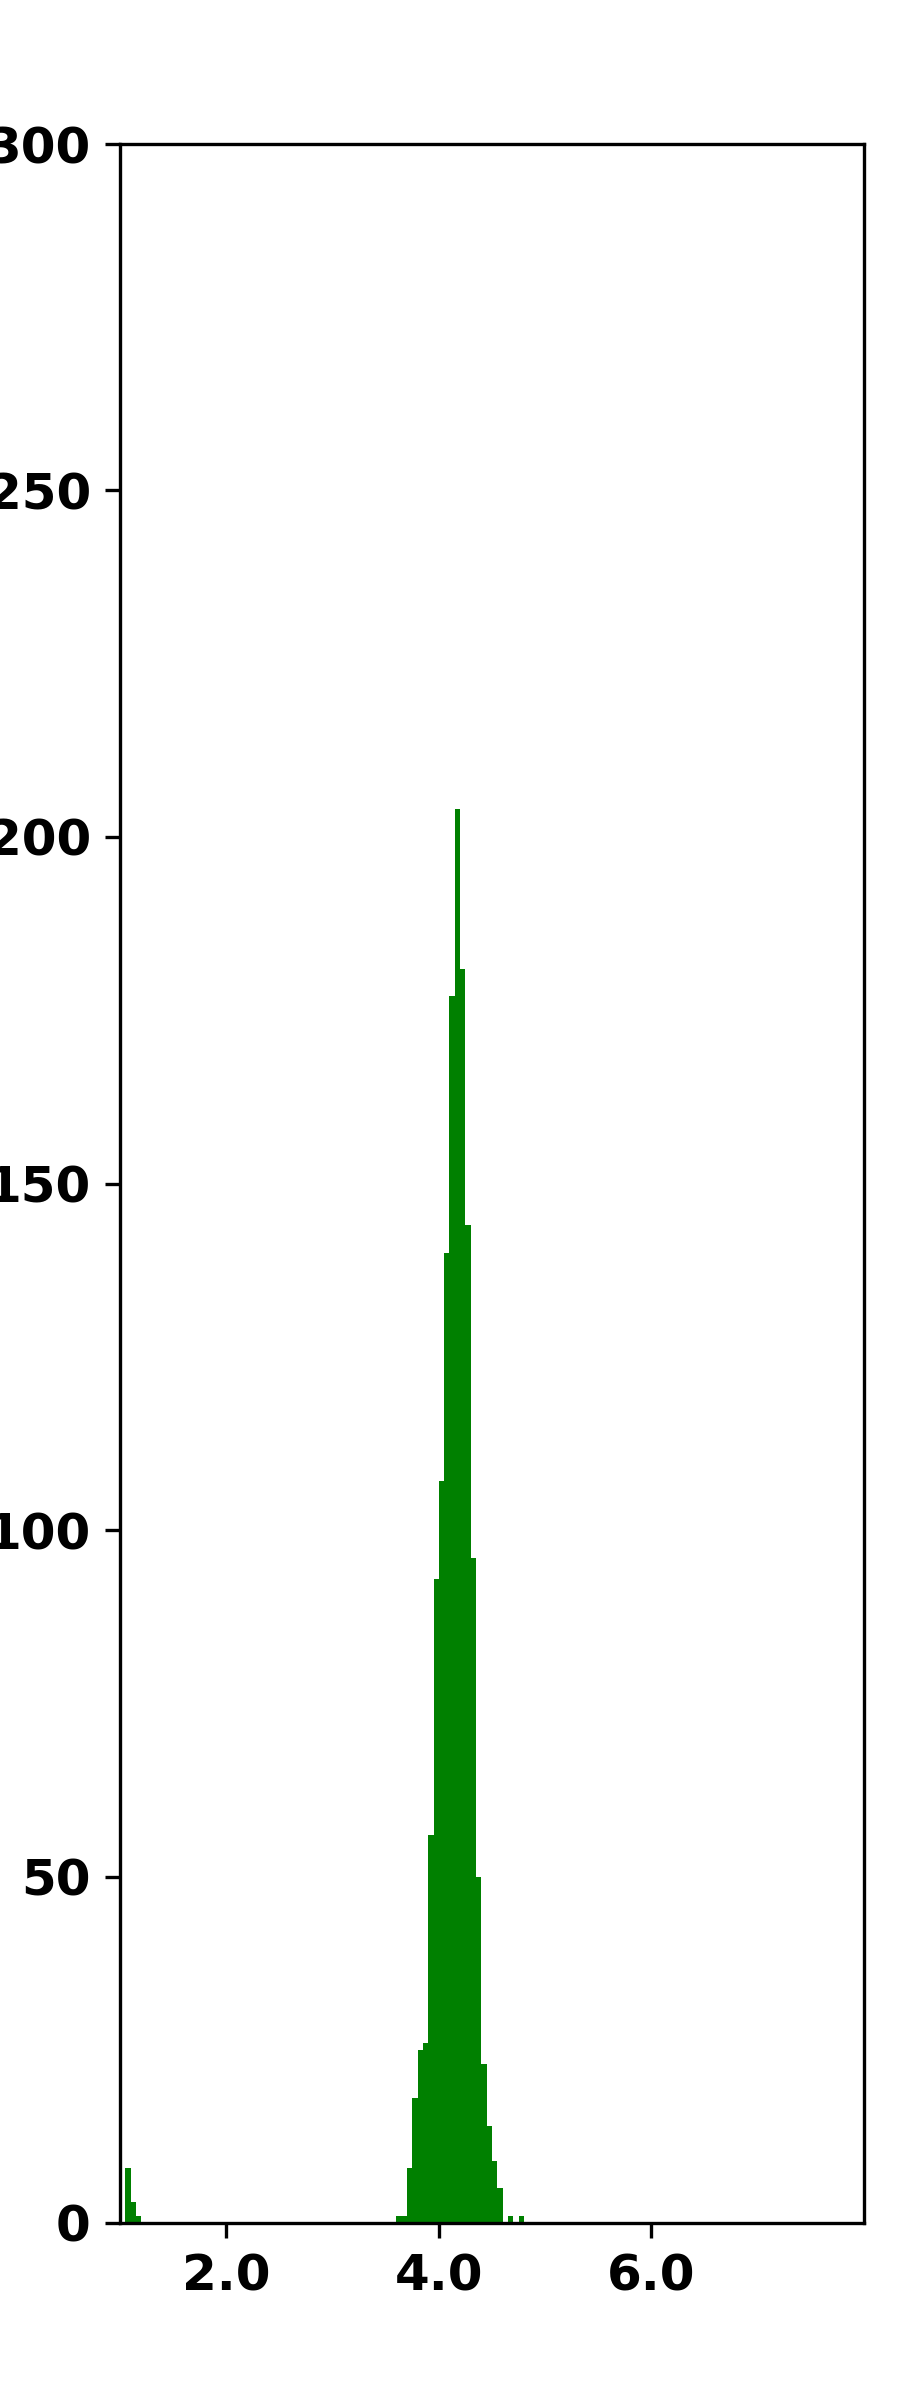
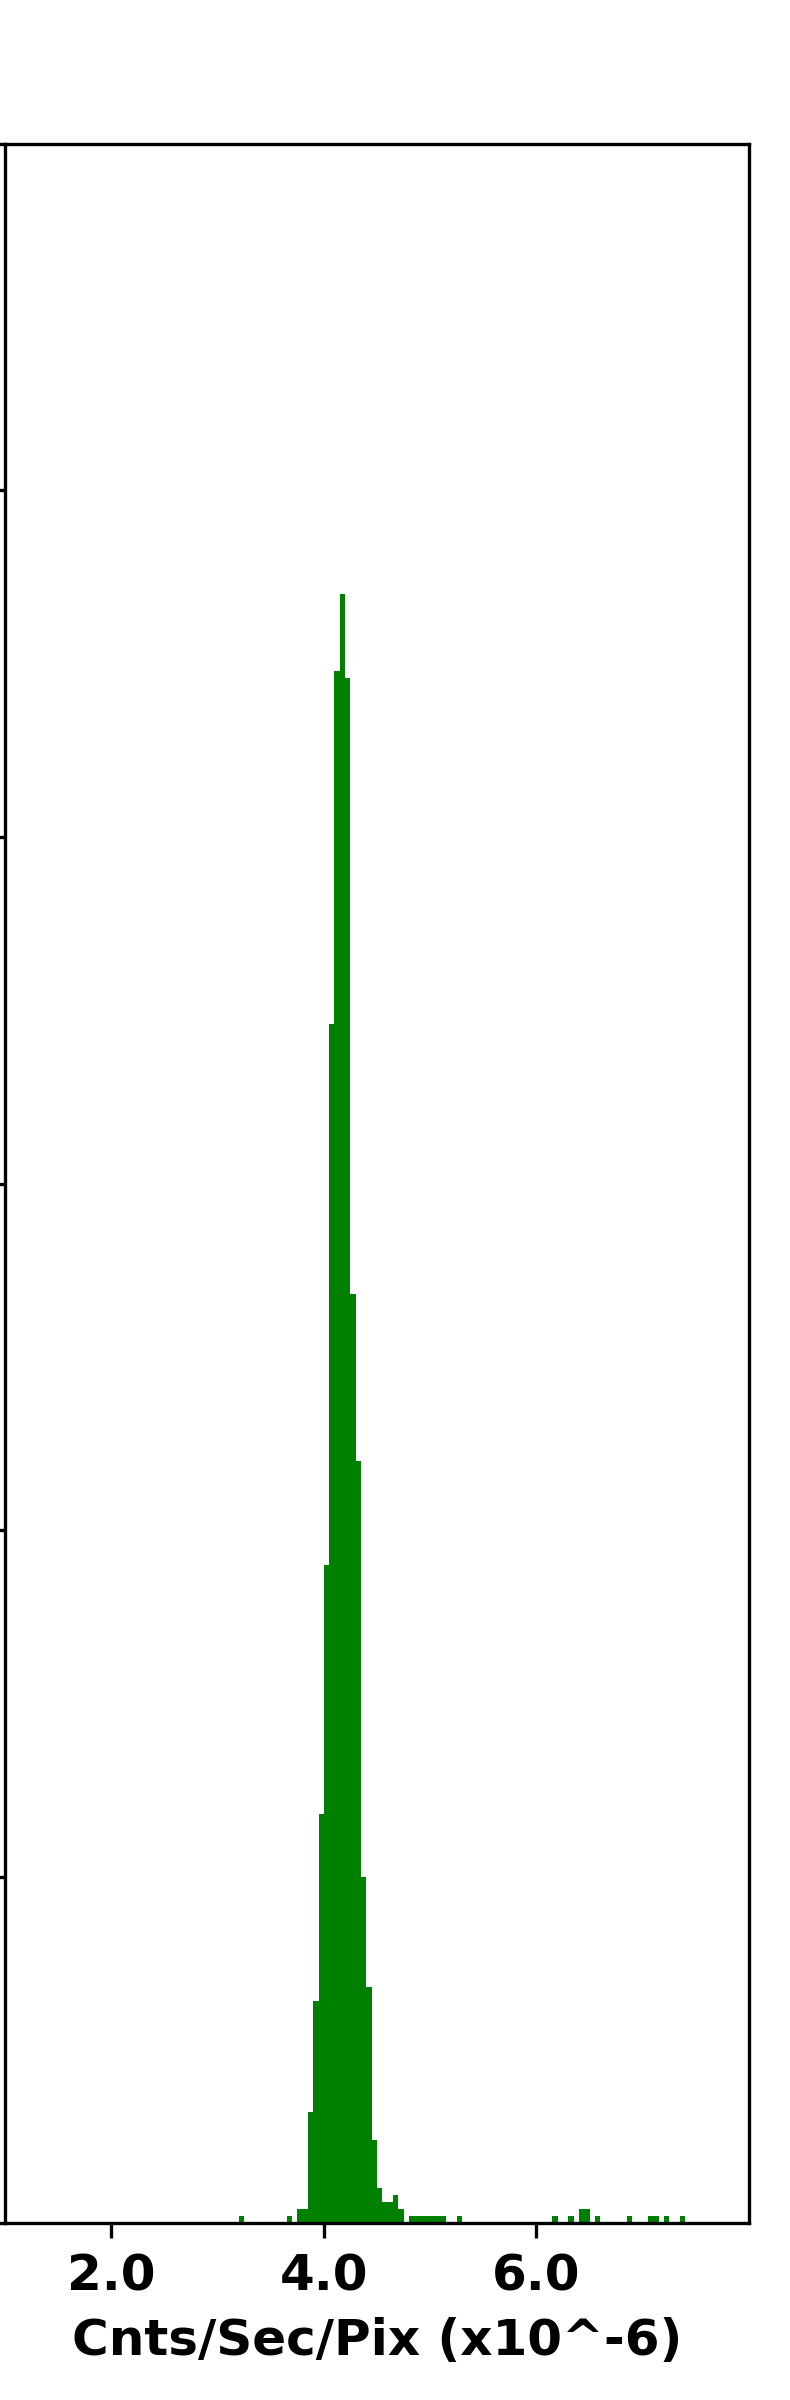
Figure 3 shows the background maps of HRC S ( fits file section 1, fits file section 2, fits file section 3 ), and the distribution of the count rate per sec per pixel. The right panel has the origin of the coordinates.
Please also check HRC S Cumulative Map Page.
Figure 3: HRC S Cumulative Background Maps and Count Rate Histograms


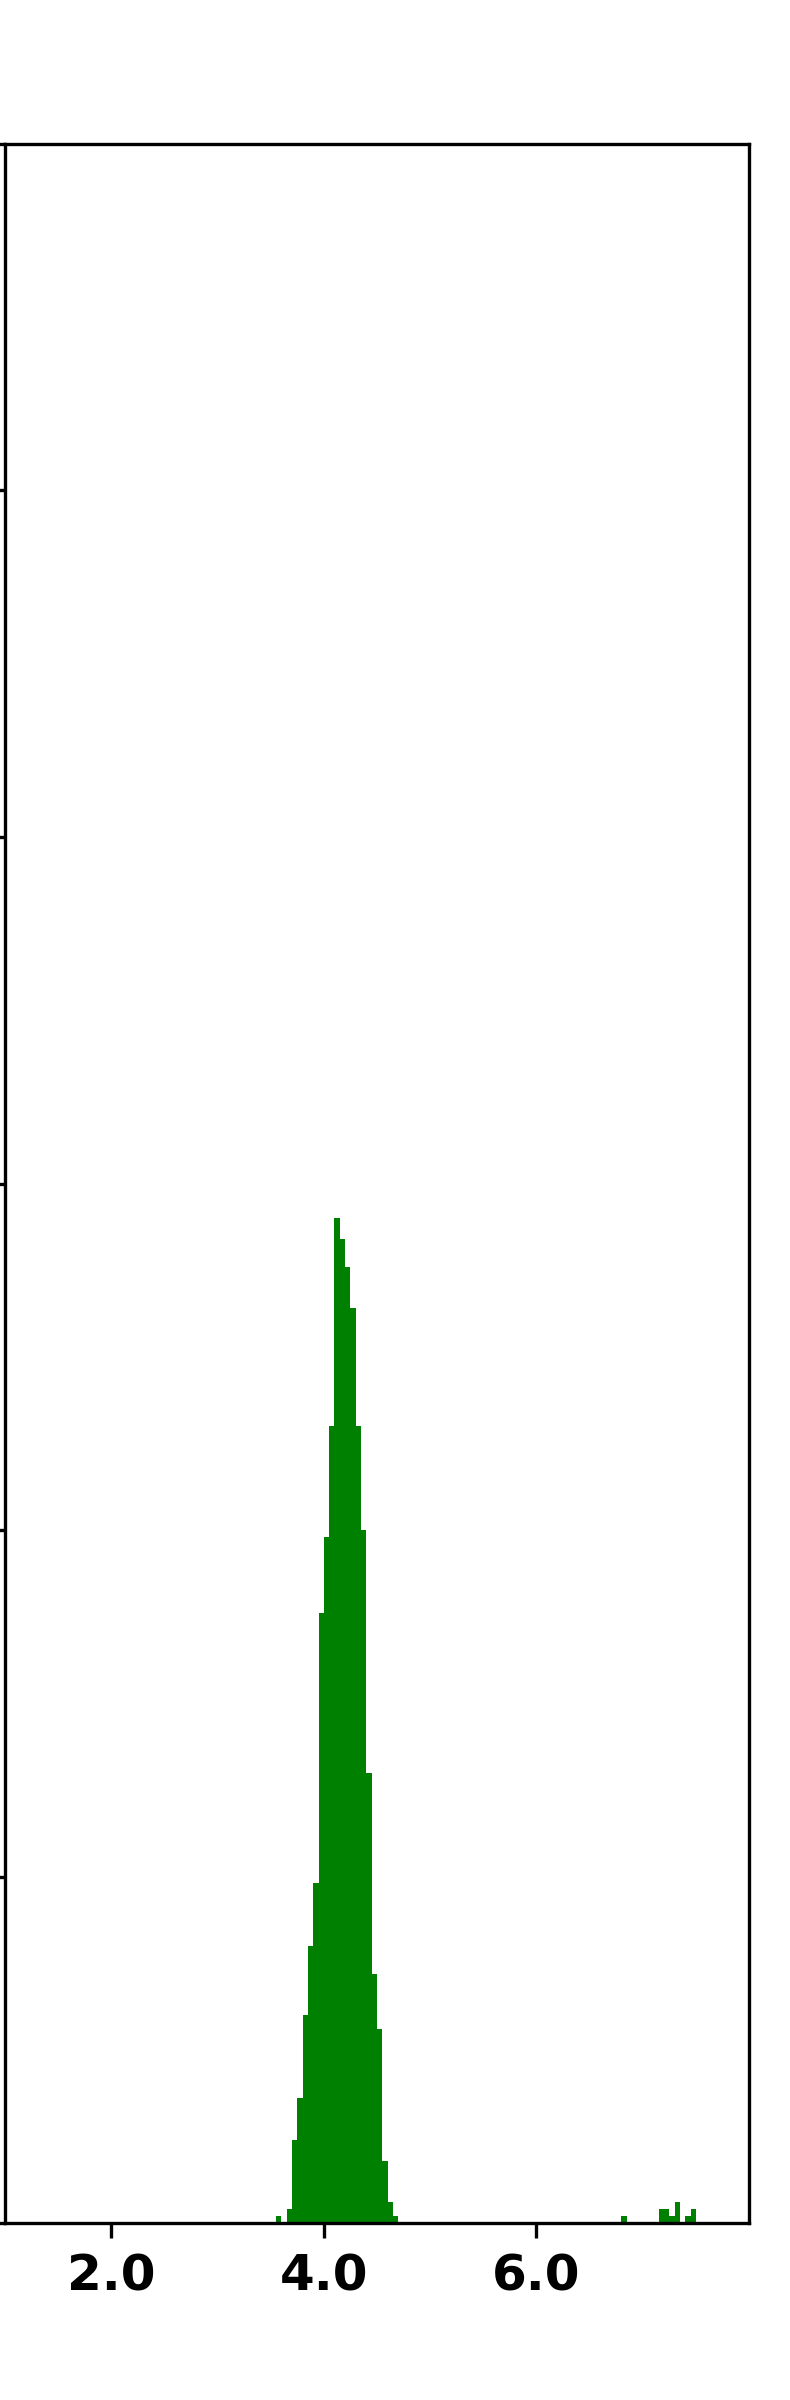
Please also check HRC S High Peecision Cumulative Map Page.
Figure 4: HRC S High Precision Timing Mode Cumulative Background Map and Count Rate Histogram
The following plots show yearly changes of HRC background maps. These maps are corrected with status bit filtering.
The background maps are created as follows:
HRC-I (status bit filtered) shows more counts at the lower left corner (e.g., see Year 2009). This is because the instrument opening is located in that direction and more particles could reach the detector. The change of the brightness of the maps is due to the change of amounts of cosmic rays seen in Figure 1.
HRC I Yearly BackGround Maps
For more details, please go to: HRC I Yearly Background Maps
HRC S Yearly BackGround Maps
For more details, please go to: HRC S Yearly Background Maps
HRC S High Precision Tuning Yearly BackGround Maps
For more details, please go to: HRC S High Precision Timing Mode Background Maps
The stowed background maps created each year can be used to correct HRC I observations. We show a step by step procedure in: How to Create a Background Map for an Observation page.
If you have any questions about this page, please contact: swolk@cfa.harvard.edu