Archive of all weekly reports
Archive of monthly reports
High Radiation caused SCS-107 to run at 158/152310z.
06/07/2011 04:45 PM EDT
A Radiation violation of P3 (130keV) scaled from P6 (761keV) has been observed by ACE
Observed = 1.2368e+08
(limit = fluence of 1.2e8 particles/cm2-ster-MeV within 2 hours)
Lost science time: 75 Ks
Although we have quoted CTI values of the cleanest data (FT <= -119.7 C, int time > 7000sec), the data fills these conditions are getting rare. We quote CTI temperature factor corrected ones. The values in the parentheses are CTI based on the cleanest data.
| Average of ACIS-I CCDs (MnKa) slope: | 1.930e-9 CTI/day | (1.274e-9 CTI/day) |
|---|---|---|
| Detrended slope: | 7.230e-9 CTI/day | (7.139e-9 CTI/day) |
We display all bad pixels showed up in past, and, if any, previously unknown bad pixels appeared in the last 14 days. We also list hot pixels (defined as 1000 above the average of bias background). Warm columns 509-514 are probably due to a computational artificial effect due to boundaries.
| CCD0 | CCD1 | CCD2 | CCD3 | CCD4 | CCD5 | CCD6 | CCD7 | CCD8 | CCD9 | |
|---|---|---|---|---|---|---|---|---|---|---|
| Previously Unknown Bad Pixels | ||||||||||
| Current Warm Pixels | (153,205) | (802,665) | (526,66) | (334,88) | (227,467) (247,364) (283,224) | (233,321) (233,322) (233,323) (233,324) (233,325) (233,326) (233,327) (258,797) (263,317) (352,544) (367,511) (369,376) (641,669) (669,577) | (843,420) | (335,412) | (139,109) (829,997) (881,53) | (636,819) |
| Flickering Warm Pixels | (692,141) | (427,125) (910,239) | (206,757) | (811,637) (703,739) | (280,313) (745,313) (233,315) (1023,166) (233,328) (792,313) | (884,31) | (199,678) (662,995) | (197,241) (666,165) (833,325) (587,544) (326,978) (356,902) (157,47) (182,474) | (40,49) | |
| Current Hot Pixels | ||||||||||
| Flickering Hot Pixels | ||||||||||
| Warm column candidates | ||||||||||
| Flickering Warm Column Candidates | 518 509 | 509 514 1021 | 509 | 509 | 514 1021 | 509 |
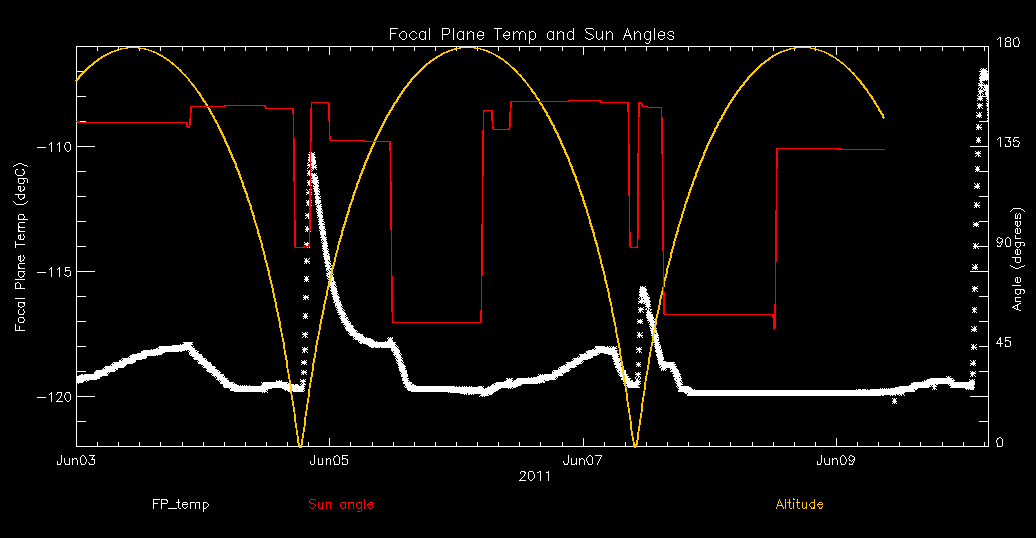
For this period, 5 peaks are observed.
| Day (DOY) | Temp (C) | Width (Days) | |
|---|---|---|---|
| 154.87 | -117.93 | 1.02 | |
| 155.85 | -110.33 | 0.81 | |
| 158.12 | -118.09 | 0.59 | |
| 158.47 | -115.70 | 0.32 | |
| 161.16 | -106.96 | 0.41 |
Weekly focal plane temperature with sun angle and altitude overplotted. Sun angle is the solar array angle, that is the angle between the sun and the optical axis (+X axis). Altitude varies from 34 kkm to 128 kkm.
11 TSC moves this period
| weekly average time/step | 0.00123 s |
|---|---|
| mission average time/step | 0.00134 s |
New violations or new extrema are shown in blue cells.
| MSID | 06/03/11 | 06/04/11 | 06/05/11 | 06/06/11 | 06/07/11 | 06/08/11 | 06/09/11 | yellow limits (lower) upper | red limits (lower) upper | Units | Description |
| HKFBIASLEAKI | 4.88 | 4.88 | (-100.0) 4.88 | (-200.0) 5.0 |
uA | EPHIN HOUSEKEEPING F-BIAS: LEAKAGE CURRENT (5EHSE900) | |||||
| LLDIALV | 138.00 | 138.00 | 138.00 | 138.00 | 138.00 | 138.00 | (130.0) 132.0 | (129.0) 133.0 |
(2LLDIALV) | Lower level disc setting | |
| 3TSMXSPT | 295.74 | 295.74 | (203.15) 294.15 | (148.15) 354.15 |
K | -X TURTLE SHELL NR ACIS SS | |||||
| ESAMYI | 42.74 | 42.74 | (7.0) 27.0 | (6.0) 33.0 |
AMP | S/A -Y CURRENT | |||||
| ESAPYI | 43.30 | 43.30 | (7.0) 27.0 | (6.0) 33.0 |
AMP | S/A +Y CURRENT | |||||
| ELBI | 85.74 | 87.12 | (16.0) 62.0 | (13.0) 66.0 |
AMP | LOAD BUS CURRENT (ELBI_LOW) | |||||
| OOBAPWR | 758.30 | 788.40 | (-1050) 370.0 | (-1100) 400.0 |
W | OBA COMPUTED TOTAL POWER | |||||
| OOBTHR56 | 295.17 | 295.08 | 295.71 | 297.32 | 297.41 | (281.04) 293.04 | (249.37) 307.15 |
K | RT 158: OBA CONE | ||
| OOBTHR60 | 290.62 | (281.04) 290.48 | (249.37) 307.15 |
K | RT 153: OBA CONE |
| OBSID | DETECTOR | GRATING | TARGET | ANALYSIS | ACA |
|---|---|---|---|---|---|
| 12448 | HRC-S | NONE | MAXI J1543-564 | OK | OK |
| 12461 | ACIS-67 | NONE | NGC 6652 | OK | OK |
| 13258 | ACIS-456789 | HETG | Mkn 841 | OK | OK |
| 12699 | ACIS-235678 | NONE | GRB 110422A | OK | OK |
| 12897 | ACIS-01236 | NONE | A2204_Field3 | OK | OK |
| 11329 | ACIS-456789 | NONE | SDSSJ150233.03+015608.3 | OK | OK |
| 12507 | ACIS-012367 | NONE | Norma Region | OK | OK |
| 12508 | ACIS-012367 | NONE | Norma Region | OK | OK |
| 12509 | ACIS-012367 | NONE | Norma Region | OK | OK |
| 12333 | HRC-I | NONE | Alpha Centauri | OK | OK |
| 12510 | ACIS-012367 | NONE | Norma Region | OK | OK |
This week's focus is Spacecraft Bus and Subsystem Trends.
Last reported on
Mar 17.
Only the most interesting or representative msids are shown below.
For a full listing choose the bulletted link.
Min/max envelopes in dark blue appear on the trending plots. The envelopes are 4th degree fits to the monthly minimum and maximum values for each MSID. The final polynomial form and binning are still being experimented with. We will soon add to the trending pages a report of the fits and predictions they give on future limit violations. The light blue curve is our original smoothing of all the data over 30 day moving boxcars. The green/yellow line is a linear fit to all the data; the break occurs at a limit change.
| MSID | MEAN | RMS | DELTA/YR | DELTA/YR/YR | UNITS | DESCRIPTION |
| EB1CI | 0.35 | 3.266e-02 | -6.299e-03 | -3.188e-04 | AMP | BATT 1 CHARGE CURRENT |
| EB1V | 32.63 | 0.17 | -3.745e-02 | -1.705e-02 | V | BATT 1 VOLTAGE |
| EB2CI | 0.36 | 3.718e-02 | -7.380e-03 | -4.042e-05 | AMP | BATT 2 CHARGE CURRENT |
| EB2V | 32.61 | 0.18 | -3.908e-02 | -1.859e-02 | V | BATT 2 VOLTAGE |
| EB3CI | 0.35 | 4.713e-02 | -8.753e-03 | -4.561e-04 | AMP | BATT 3 CHARGE CURRENT |
| EB3V | 32.32 | 0.17 | -4.053e-02 | -1.652e-02 | V | BATT 3 VOLTAGE |
| ECNV1V | 14.89 | 7.006e-03 | 3.090e-04 | 6.082e-04 | V | CONV 1 +15V OUTPUT |
| ECNV2V | 14.84 | 1.412e-02 | 1.303e-03 | 1.656e-03 | V | CONV 2 +15V OUTPUT |
| ECNV3V | 15.31 | 6.168e-03 | -1.247e-03 | 9.772e-05 | V | CONV 3 +15V OUTPUT |
| EEPA5V | 5.24 | 6.880e-05 | 4.193e-06 | 5.731e-06 | V | +5V RCTU_EP A |
| EEPB5V | 0.04 | 2.769e-04 | -1.370e-07 | 3.947e-06 | V | +5V RCTU_EP B |
| EOCHRGB1 | 1.00 | 3.772e-03 | -2.143e-05 | 0.000e+00 | ) | +Y SOLAR ARRAY CURRENT - COUNTS |
| Previous Quarter | ||||||
| MSID | MEAN | RMS | DELTA/YR | DELTA/YR/YR | UNITS | DESCRIPTION |
| EB1CI | 0.35 | 7.394e-02 | -9.643e-03 | 8.620e-01 | AMP | BATT 1 CHARGE CURRENT |
| EB1V | 32.45 | 0.14 | -1.359e+00 | 1.274e+00 | V | BATT 1 VOLTAGE |
| EB2CI | 0.35 | 7.457e-02 | 5.936e-03 | 6.836e-01 | AMP | BATT 2 CHARGE CURRENT |
| EB2V | 32.40 | 9.247e-02 | -8.302e-01 | 5.426e-01 | V | BATT 2 VOLTAGE |
| EB3CI | 0.33 | 7.446e-02 | -2.389e-02 | 6.792e-01 | AMP | BATT 3 CHARGE CURRENT |
| EB3V | 32.12 | 9.320e-02 | -8.408e-01 | 1.139e+00 | V | BATT 3 VOLTAGE |
| ECNV1V | 14.89 | 4.604e-03 | 4.339e-03 | 1.359e-02 | V | CONV 1 +15V OUTPUT |
| ECNV2V | 14.83 | 8.529e-03 | 4.293e-03 | -9.490e-02 | V | CONV 2 +15V OUTPUT |
| ECNV3V | 15.31 | 3.788e-03 | 3.768e-03 | 4.441e-03 | V | CONV 3 +15V OUTPUT |
| EEPA5V | 5.24 | 2.323e-04 | 3.430e-04 | 1.258e-03 | V | +5V RCTU_EP A |
| EEPB5V | 0.04 | 6.733e-05 | -2.389e-05 | 0.000e+00 | V | +5V RCTU_EP B |
| MSID | MEAN | RMS | DELTA/YR | DELTA/YR/YR | UNITS | DESCRIPTION |
| TCYLAFT1 | 292.58 | 4.67 | 1.034e+00 | -7.392e-01 | K | CNT CYL TEMP:16-IN FWD OF SC-TS FIT-1 |
| TCYLAFT2 | 275.18 | 2.12 | 3.982e-01 | -2.231e-01 | K | CNT CYL TEMP:16-IN FWD OF SC-TS FIT-2 |
| TCYLAFT3 | 263.29 | 1.36 | 1.314e-01 | -9.072e-02 | K | CNT CYL TEMP:16-IN FWD OF SC-TS FIT-3 |
| TCYLAFT4 | 266.48 | 1.96 | 1.814e-01 | -1.663e-01 | K | CNT CYL TEMP:16-IN FWD OF SC-TS FIT-4 |
| TCYLAFT5 | 277.66 | 3.72 | 6.226e-01 | -4.076e-01 | K | CNT CYL TEMP:16-IN FWD OF SC-TS FIT-5 |
| TCYLAFT6 | 291.77 | 5.33 | 1.223e+00 | -7.672e-01 | K | CNT CYL TEMP:16-IN FWD OF SC-TS FIT-6 |
| TMZLGABM | 313.34 | 8.16 | 1.343e+00 | 1.068e+00 | K | -Z LOW-GAIN ANTENNA BOOM TEMP |
| TMZP_MY | 297.43 | 8.60 | 1.410e+00 | -5.425e-01 | K | -Z PNL TEMP:-Y SIDE |
| TMZP_PY | 297.06 | 7.15 | 1.065e+00 | -6.363e-01 | K | -Z PNL TEMP:+Y SIDE |
| MSID | MEAN | RMS | DELTA/YR | DELTA/YR/YR | UNITS | DESCRIPTION |
| ELBI | 60.07 | 2.06 | -3.950e-01 | 4.912e-02 | AMP | LOAD BUS CURRENT |
| ELBV | 29.72 | 0.34 | -5.313e-02 | 2.791e-02 | V | LOAD BUS VOLTAGE |
| ESAMYI | 13.65 | 1.11 | -2.288e-01 | 1.148e-02 | AMP | S/A -Y CURRENT |
| ESAPYI | 13.23 | 0.95 | -1.516e-01 | 1.113e-02 | AMP | S/A +Y CURRENT |
| OHRMAPWR | 61.14 | 1.84 | -1.391e-01 | -7.207e-02 | W | HRMA COMPUTED TOTAL POWER |
| OOBAPWR | 73.08 | 16.98 | -4.632e+00 | 2.020e-01 | W | OBA COMPUTED TOTAL POWER |
| Previous Quarter | ||||||
| MSID | MEAN | RMS | DELTA/YR | DELTA/YR/YR | UNITS | DESCRIPTION |
| ELBI | 58.09 | 1.35 | 2.186e+00 | 1.040e+01 | AMP | LOAD BUS CURRENT |
| ELBV | 29.57 | 0.17 | 1.779e+00 | -4.097e+00 | V | LOAD BUS VOLTAGE |
If you have any questions, please contact: swolk@head.cfa.harvard.edu
)
)
)
)
)
)
)
)
)
)
)
)
)
)
)
)
)
)
)
)
)
)
)
)
)
)
)
)
)
)
)
)
)
)
)
)
)
)
)
)