- Nancy Remage Evans
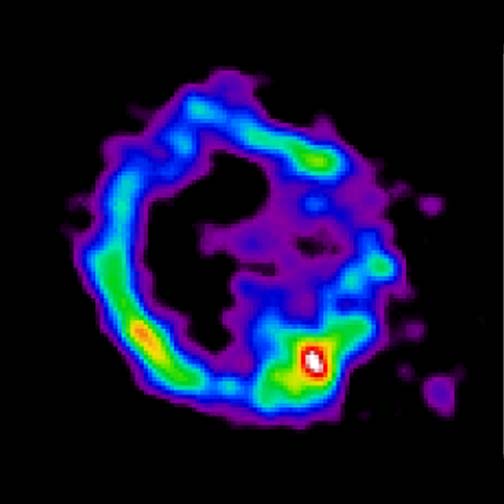
By using the High Energy Transmission Grating Spectrometer (HETG) on the Chandra X-ray Observatory, an image has been created of E0102-72 shining with the light of a single X-ray line of oxygen. E0102-72 is a supernova remnant in a nearby galaxy, the Small Magellanic Cloud. Shock waves heat the gas of the remnant to temperatures of nearly 10 million degrees, so it glows with X-rays that are detected by Chandra's instruments.
The HETG spectrometer separates the X-rays into their distinct X-ray emission lines, forming separate images of the remnant with the X-ray light of each line. This allows the distribution of each chemical element to be pinpointed individually, and the velocities of different parts of the expanding ring to be measured. The image shows the shock wave in a kind of ``freeze-frame", revealing the progressive heating of the stellar ejecta as it plows into the surrounding gas. By measuring the expansion velocity of the ring, the team can estimate the amount of energy liberated in the explosion.
The supernova remnant also provides a laboratory for atomic physics. The observations show how the atoms in the matter ejected by the supernova explosion behave when heated to such high temperatures. The images reveal the progressive stripping of electrons from the atoms after the supersonic shock wave has passed.
This is the first time such a high-resolution X-ray spectrum has been obtained for a whole supernova remnant, and should provide critical clues to the nature of supernovae.
- Claude Canizares, Kathryn Flanagan, David Davis, and John Houck
|
|
Full Size Postscript Image |
Chandra has discovered an X-ray jet in the radio loud quasar PKS 0637-752
which extends to at least 100 kpc from the quasar nucleus. The jet has an
X-ray luminosity of
![]() ergs s-1, about 5% of the luminosity
of the quasar. This is the largest and most luminous X-ray jet detected
to date.
ergs s-1, about 5% of the luminosity
of the quasar. This is the largest and most luminous X-ray jet detected
to date.
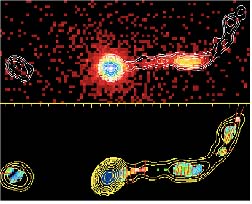
PKS0637-752 was the first celestial X-ray target at which the Chandra X-ray Observatory was deliberately pointed. Because of its moderate strength, and because almost all quasars were assumed to be X-ray point sources, it was used to locate the optical axis and focus of the X-ray mirror assembly. Surprisingly, even the first short, out-of-focus image clearly revealed an X-ray jet, coincident with a portion of a previously known radio jet. ATCA (Australian Telescope Compact Array) and VSOP (VLBI Space Observatory Program) observations were made at 4.8 and 8.6 GHz, in coordination with the anticipated Chandra observations, and as followup when the existence of the X-ray jet was known.
Figure 2 shows the X-ray image, overlaid with the 4.8 GHz radio contours. From about 4 to 10 arcsec west of the nucleus, the X-ray intensity is closely correlated with the radio, with a ratio of X-ray to radio flux constant within a factor of 2. West of 10 arcsec, the X-ray flux drops much faster than the radio, and disappears 12 arcsec west of the quasar, where the radio jet appears to change direction. The X-ray intensity at the local radio knot northwest of the bend, or at radio emission 11 arcsec east of the nucleus, is down by at least a factor of 100. In the lower panel, Fig 2b, we see the total radio intensity contours at 8.6 GHz, with the radio polarization fraction of 10 to 20% given by the color scale, and the direction of the electric vector marked by the red lines. At the redshift 0.653 of this source, the 1 arcsec scale marks represent 9.2 kpc, in the plane of the sky.
The high degree of radio polarization shows that it is synchrotron
emission. However, the X-rays cannot be an extension of that
synchrotron spectrum, because HST observations show that the optical
flux is at least a factor of 10 times below what would be predicted
from such a mechanism. A thermal bremsstrahlung origin of the X-rays
is unlikely, requiring more than 1010 solar mass. This should be
optically visible, and produce Faraday rotation and depolarization,
none of which is observed. So we look to an inverse Compton mechanism. The
energy density of radio photons could lead to detectable synchrotron
self-Compton emission only if the magnetic field were at least 30
times less than the equipartion value. Clearly something dramatic is
happening ![]() 11.5 arcsec west of the quasar. Besides a large change in
direction, the magnetic field is becoming chaotic as shown by the drop
in polarization fraction and the change in direction. So perhaps
acceleration of electrons, and non-equipartition or inhomogeneous
magnetic field configurations, are reasonable to assume for this region.
11.5 arcsec west of the quasar. Besides a large change in
direction, the magnetic field is becoming chaotic as shown by the drop
in polarization fraction and the change in direction. So perhaps
acceleration of electrons, and non-equipartition or inhomogeneous
magnetic field configurations, are reasonable to assume for this region.
VSOP observations of the quasar core shows superluminal
components with v/c ![]() 11, implying an angle to the line of sight less
than
11, implying an angle to the line of sight less
than
![]() .
The milliarcsec components are aligned with the 12
arcsec extension to the west. Unless the mas scale jet bends about an
axis which is in the plane of the sky,
the X-ray and radio jets we observe
on arcsec scales have intrinsic lengths more than 0.5 Mpc!
.
The milliarcsec components are aligned with the 12
arcsec extension to the west. Unless the mas scale jet bends about an
axis which is in the plane of the sky,
the X-ray and radio jets we observe
on arcsec scales have intrinsic lengths more than 0.5 Mpc!
Discovery of this remarkable X-ray jet in the very first celestial X-ray target of Chandra has proven to be extremely exciting. The image shows the power of Chandra's two dimensional angular resolution, which is a factor of 100 better than previous missions. We hope it is a portent of many more detections of jets and other features in AGN, previously assumed to be simple point sources. Attempts to model the radio, optical, and X-ray data in terms of simple, standard models, do not allow the usual assumptions of homogeneous structures with conditions of energy equipartition. Thus we expect to derive important astrophysical consequences for understanding regions of particle acceleration, inhomogeneities of magnetic field structures, and extreme departures from equipartition conditions.
- Dan Schwartz for the PKS 0637-752 Consortium
|
Full Size Postscript Image |
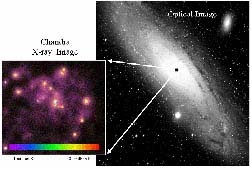
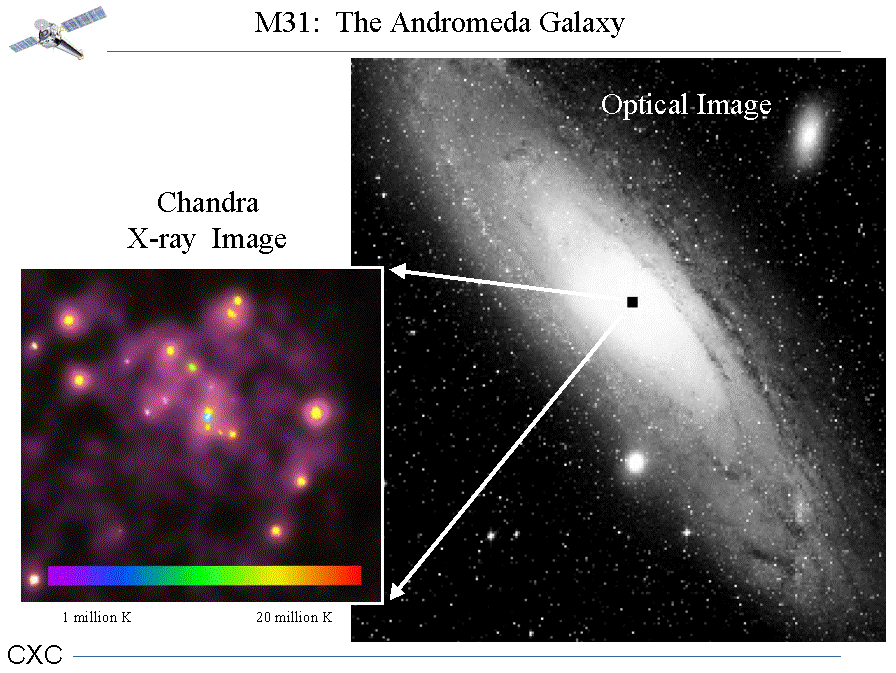
This black and white image is an optical image of the Andromeda Galaxy (M31). The black square in the center shows the size of the nuclear region imaged by Chandra. (Fig. 3)
The color image is the Chandra X-ray ACIS-I X-ray image taken as part of the HRC GTO M31 Monitoring Program (PI S. Murray). The image shown covers the central approximately 1 arc min surrounding the nucleus. An approximate temperature scale is also shown for the X-ray image. These data were analyzed by Garcia, et al. (2000, ApJ, submitted). Numerous hot X-ray sources are apparent. Most of these are probably due to X-ray binary systems, in which a neutron star or black hole is in a close orbit around a normal star. The X-rays are produced by matter funneling toward the black hole.
In contrast, the blue dot in the center of the image is a ``cool" million degree X-ray source where a supermassive black hole with the mass of 30 solar is located.
- Steve Murray and Mike Garcia
|
Full Size JPEG Image |
X-ray image of the Crab Nebula. (Fig 4) On 1999 August 29, during the orbital activation and calibration, Chandra obtained a 2.7 ksec observation of the Crab Nebula, using the High-Energy Transmission Grating (HETG) and the Advanced CCD Imaging Spectrometer spectroscopy array (ACIS-S). The data shown are from S3 and include events in both zero and higher spectral orders, the latter being dispersed along two crossed tracks, owing to the slightly different orientation of the High-Energy Grating (HEG) facets from the Medium-Energy Grating (MEG) facets. The image shows a striking richness of X-ray structure, at a resolution comparable to that of the best ground-based visible-light observations. For the first time one sees an X-ray inner ring within the X-ray torus, the suggestion of a hollow-tube structure for the torus, and X-ray knots along the inner ring and (perhaps) along the inward extension of the X-ray jet. M.C. Weisskopf and colleagues present and discuss these data in an upcoming issue of the Astrophysical Journal Letters. (Picture courtesy of M. C. Weisskopf)
- Martin Weisskopf
|
Full Size Postscript Image |
A cluster of embedded stars, including the Lbol ![]() 104 L
104 L![]() Becklin-Negebauer (BN) object lie near the density peak of the massive OMC-1
molecular cloud about 1
Becklin-Negebauer (BN) object lie near the density peak of the massive OMC-1
molecular cloud about 1![]() northwest of the Orion Trapezium. BN lies in a
group of several massive stars with Lbol
northwest of the Orion Trapezium. BN lies in a
group of several massive stars with Lbol ![]() 103 L
103 L![]() ,
three of which (BN, IRc2, and infrared Source n) produce compact thermal
sources (ultracompact HII regions and/or stellar winds) and/or maser
outflows. BN illuminates the infrared Kleinman-Low (KL) nebula, and either
BN or one of the other luminous stars in the region powers strong shocked
molecular outflows in the region. BN/KL lies in the densest and most
chemically rich region in the entire Orion giant molecular cloud complex, and
is the nearest and best studied example of
,
three of which (BN, IRc2, and infrared Source n) produce compact thermal
sources (ultracompact HII regions and/or stellar winds) and/or maser
outflows. BN illuminates the infrared Kleinman-Low (KL) nebula, and either
BN or one of the other luminous stars in the region powers strong shocked
molecular outflows in the region. BN/KL lies in the densest and most
chemically rich region in the entire Orion giant molecular cloud complex, and
is the nearest and best studied example of ![]() 20 known molecular hot
cores which are the most likely sites of current massive star formation. The
region is extremely complex and not fully understood after decades of
intensive multiwavelength investigation.
20 known molecular hot
cores which are the most likely sites of current massive star formation. The
region is extremely complex and not fully understood after decades of
intensive multiwavelength investigation.
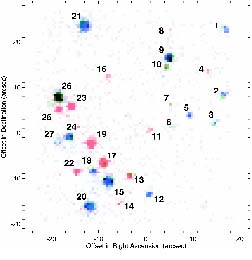
Fig. 5 shows the Chandra ACIS image of the BN/KL region, color
coded for source hardness. A source which is nearly entirely red
has only hard photons. The sources are aligned to the
2MASS/Hipparcos astrometric frame to ![]()
![]() accuracy.
accuracy.
A close examination of X-ray sources in the BN/KL region shows a diversity of
stellar sources: foreground and embedded ONC members; the luminous embedded
infrared Source n (number 11 in Fig. 5); several sources not appearing in
sensitive optical and K-band surveys; and a faint, heavily absorbed source
apparently displaced 1
![]() from BN itself. The ACIS source associated with
Source n may be the first unambiguous (i.e. spatially resolved from other
young stars) X-ray detection of a massive young stellar object. The X-ray
spectra indicate line of sight absorption ranging from 21
from BN itself. The ACIS source associated with
Source n may be the first unambiguous (i.e. spatially resolved from other
young stars) X-ray detection of a massive young stellar object. The X-ray
spectra indicate line of sight absorption ranging from 21 ![]() log NH to
log NH to
![]() 23 cm-2 and one-fourth of the sources are variable within the
observation. A considerable fraction of the sources are associated with
faint radio sources; this likely arises from nonthermal gyrosynchrotron
radiation that accompanies X-ray flaring induced by magnetic reconnection.
Source 11 near the BN object is quite enigmatic.
It is unclear whether it is a separate
star or whether the X-rays are produced in the outflow from this massive young
star. The several sources without any photospheric optical or infrared
counterpart are likely new embedded, magnetically active stars in OMC-1. The
presence of deeply embedded X-ray sources in the BN/Kl region support the idea
that ionizing X-rays produced by young stars will be present within dense
star-forming molecular cloud cores.
23 cm-2 and one-fourth of the sources are variable within the
observation. A considerable fraction of the sources are associated with
faint radio sources; this likely arises from nonthermal gyrosynchrotron
radiation that accompanies X-ray flaring induced by magnetic reconnection.
Source 11 near the BN object is quite enigmatic.
It is unclear whether it is a separate
star or whether the X-rays are produced in the outflow from this massive young
star. The several sources without any photospheric optical or infrared
counterpart are likely new embedded, magnetically active stars in OMC-1. The
presence of deeply embedded X-ray sources in the BN/Kl region support the idea
that ionizing X-rays produced by young stars will be present within dense
star-forming molecular cloud cores.
- Gordon Garmire, Eric Feigelson, Patrick Broos, Lynne Hillenbrand, Steven Pravdo, Leisa Townsley, and Yohko Tsuboi
|
Full Size Postscript Image |
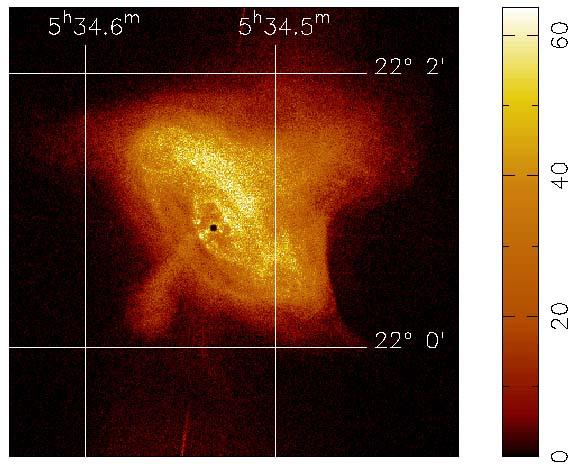
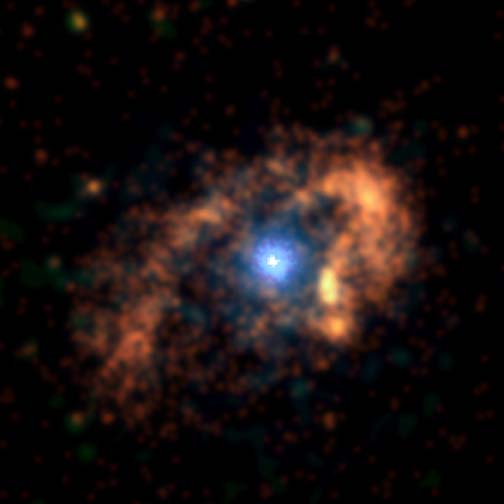
NASA's Chandra X-ray Observatory has imaged Eta Carinae and revealed a hot inner core around this mysterious superstar (Fig. 6). The new X-ray observation shows two distinct structures: an outer, horseshoe shaped ring about 0.6 pc in diameter, and a hot central source less than 0.03 pc in diameter which may contain the superstar. These structures are thought to represent shock waves produced by matter rushing away from the superstar at supersonic speeds. The temperature of the shock-heated gas ranges from 108 K in the central regions to 107 K on the outer structure.
An earlier image of Eta Carinae by the Hubble Space Telescope revealed two spectacular bubbles of gas expanding in opposite directions away from a central bright region at speeds in excess of a million miles per hour. The inner region visible in the Chandra image, never resolved before, appears to coincide with a strong point source at the center of the bipolar optical nebula.
Eta Carinae is one of the most enigmatic and intriguing objects in our galaxy. Between 1837 and 1856 it increased dramatically in brightness to become the brightest star in the sky except for Sirius, even though it is 2.3 Kpc away. This ``Great Eruption," as it is called, had an energy comparable to a supernova, yet did not destroy the star, which faded to become a dim star, invisible to the naked eye. Since 1940, Eta Carinae has begun to brighten, becoming almost visible to the naked eye again.
Modern day observations of Eta Carinae have shown it to
be one of the most luminous objects in our galaxy. It
radiates at the rate of several million L![]() .
Most of the radiation is at infrared wavelengths, from
dust in the bipolar nebula. Astronomers still do not know
what lies at the heart of Eta Carinae. Most believe that it is
powered by an extremely massive star that may contain a
100 M
.
Most of the radiation is at infrared wavelengths, from
dust in the bipolar nebula. Astronomers still do not know
what lies at the heart of Eta Carinae. Most believe that it is
powered by an extremely massive star that may contain a
100 M![]() .
Such stars produce
intense amounts of radiation that cause violent
instabilities before they explode as a supernova.
.
Such stars produce
intense amounts of radiation that cause violent
instabilities before they explode as a supernova.
- Fred Seward
|
Full Size Postscript Image |
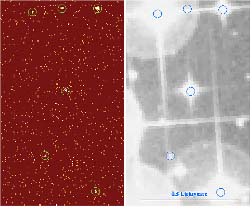
An early Chandra target was the young cluster NGC 2516 (Fig. 7). This cluster of young stars, also known as the southern Pleiades, is about 400 parsecs away. Young stars have highly turbulent interiors which give rise to strong magnetic fields. These magnetic fields, in turn, heat the upper atmospheres of stars to millions of degrees which we see as X-rays. We have identified over 150 X-ray sources in the HRC-I, ACIS-I and ACIS-S observations of NGC 2516. The high absolute positional accuracy allows for easy identification of optical counterparts. While many of these detections recover previously known sources, some are new, including one source which was only detected during a flare. At its peak, this flaring star was as bright (in X-rays) as the rest of the cluster.
High spatial resolution permits unconfused source detection and provides high sensitivity in this dense young star cluster. This enables us to probe deeper into the population of cluster members and for the first time explore x-ray emission from K- and later-type stars in this cluster. Fig. 7 shows a portion of an HRC image compared with an optical POSS image. CCD-spectral resolution permits accurate determination of luminosity functions and enables us to explore the effects of metallicity and binarity on X-ray luminosity.
- Rick Harnden and Scott Wolk
|
Full Size Postscript Image |
The radio galaxy Centaurus A (NGC 5128) is the
nearest active galaxy (3.5 Mpc) and has been well
studied because of it's proximity and it's complex spatial
structure at radio, optical, and X-ray wavelengths.
Optically Cen A appears to be an elliptical galaxy
bisected by an opaque dust lane which is believed
to be due to a merger with a spiral galaxy. In the radio,
Cen A exhibits a strong, well collimated one-sided jet to the NE
extending about 6![]() from the nucleus. The jet opens into
a radio lobe several arcminutes from the nucleus.
A second radio lobe extends several arcminutes from
the nucleus in the SW direction. Giant outer lobes
extend to several degrees on the sky.
Cen A is often considered to be the prototypical
Fanaroff-Riley type I low-luminosity radio galaxy.
Previous X-ray observations of Cen A have revealed
several sources of X-ray emission including a bright
nucleus, a one-sided X-ray jet, complex diffuse emission,
and numerous point sources.
The spatial morphology of the X-ray emission from the
jet is similar to that seen
in the radio and suggests synchrotron radiation
from ultra-relativistic electrons as its origin, although
other models have not be definitively ruled out.
from the nucleus. The jet opens into
a radio lobe several arcminutes from the nucleus.
A second radio lobe extends several arcminutes from
the nucleus in the SW direction. Giant outer lobes
extend to several degrees on the sky.
Cen A is often considered to be the prototypical
Fanaroff-Riley type I low-luminosity radio galaxy.
Previous X-ray observations of Cen A have revealed
several sources of X-ray emission including a bright
nucleus, a one-sided X-ray jet, complex diffuse emission,
and numerous point sources.
The spatial morphology of the X-ray emission from the
jet is similar to that seen
in the radio and suggests synchrotron radiation
from ultra-relativistic electrons as its origin, although
other models have not be definitively ruled out.
Cen A has been observed several times with the Chandra X-ray Observatory, twice with the HRC-I as part of the OAC phase (total observing time 40 ks) and once with the ACIS-I instrument (37 ks) as part of the HRC GTO program (PI: Steve Murray). A second HRC GTO observation (37 ks) with the ACIS instrument is scheduled for May 2000. A few of the issues that we hope to address with these data include the following. What is the relationship between the X-ray and radio emission in the jet? What does this imply regarding the nature of the jet? Is there any evidence for extended nuclear emission at the sub-arcsecond resolution of the observatory? What is the distribution and luminosity function of point sources (X-ray binaries) in Cen A? How does it compare with those found in spiral galaxies like the Milky Way and M31? Is there any evidence of X-ray emission from the radio lobes? What is the temperature and spatial distribution of the hot ISM? Preliminary results from the HRC observations have already been published (Kraft, et al. 2000, Ap. J., 531, L9). We are in the process of analyzing the ACIS data, but describe some preliminary results here.
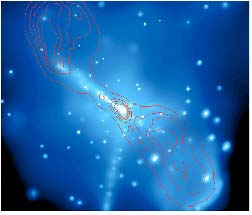
An adaptively smoothed image of Cen A in the 1-3 keV bandpass taken
with the ACIS-I is shown in Figure 8 (north
is up and east is to the left) with 13 cm radio contours
overlaid. The bright active nucleus at
the center of the image can clearly be seen, as well as the
jet to the NE, many point sources, complex diffuse emission
centered on the nucleus, excess diffuse emission in
the SW radio lobe, and a bright arc at the edge of this
lobe. Knots in the jet and diffuse emission between
between them can be separated.
The streak extending to the SSE of the nucleus
is an instrumental artifact and is caused by events from
the extremely bright nucleus being detected during a
frame transfer. Below 1 keV, there is a clear
anticorrelation of the diffuse X-ray emission with the
thickest regions of the dust lanes.
Above 3 keV, only the knots and diffuse
emission in the inner 1![]() of the jet, the
nucleus, a few of the point sources, and the ISM can
be seen. The greatly improved spatial resolution of the
CXO over previous missions has allowed us to make
a comparison between the radio and X-ray structures of
the inner jet region. We find that although the X-ray
and radio structures are similar, they are not exactly
the same, perhaps implying different emission mechanisms
in the two bands. Analysis of this data is ongoing and
more definitive results will be published in the near future.
of the jet, the
nucleus, a few of the point sources, and the ISM can
be seen. The greatly improved spatial resolution of the
CXO over previous missions has allowed us to make
a comparison between the radio and X-ray structures of
the inner jet region. We find that although the X-ray
and radio structures are similar, they are not exactly
the same, perhaps implying different emission mechanisms
in the two bands. Analysis of this data is ongoing and
more definitive results will be published in the near future.
- Ralph P. Kraft
|
Full Size Postscript Image |