HETG Update
Melania Nynka, on behalf of the HETG Team
Performance and Software
The HETGS configuration of Chandra remains a popular and well-utilized instrument for the observatory. Throughout Cycle 23 and early Cycle 24, HETG gratings were used to observe fine spectral features of 23 unique sources from stars, diffuse galaxies, supernova remnants, and binaries of all flavors. Targets such as M15 X-2 used the sub-arcsecond resolution of Chandra to detangle its spectra from nearby sources. The March 2022 to March 2023 period was a dynamic one for HETG—amongst the scheduled GO targets, three unique DDT and two TOO observations were triggered, including the unexpected jetted tidal disruption event AT 2022cmc and the outbursting stellar mass black hole IGRJ17091–3624. Calibration sources GX 3+1 and 3C273 were observed for continued monitoring of the contamination affecting the <2 keV bandpass (see the Chandra Proposers' Observatory Guide for more details). Due to observatory thermal constraints, most sources required multiple observations of ~10–30 ks. In total, over 1Ms of exposure were collected.
RS Oph CV Eruptions
RS Oph is a recurring symbiotic nova, constructed of a very massive 1.2–1.4 M☉ white dwarf (WD) and an M0-2 III red giant located 2.45±0.37 kpc away (Rupen et al. 2008). When a critical amount of material is accreted onto the white dwarf from the binary companion, a thermonuclear runaway (TNR) outburst occurs followed by a radiation-driven wind. Seven outbursts from RS Oph have been detected since 1898 across wavelengths from γ-rays to radio making this one of the most well-studied novae to date (e.g. Nelson et al. 2008, Ness et al. 2009). The most recent 2021 outburst was captured with Chandra HETG 18 days after the optical maxima and with XMM-Newton Reflection Gratings Spectrometer (RGS) on day 21 (Orio et al. 2022).
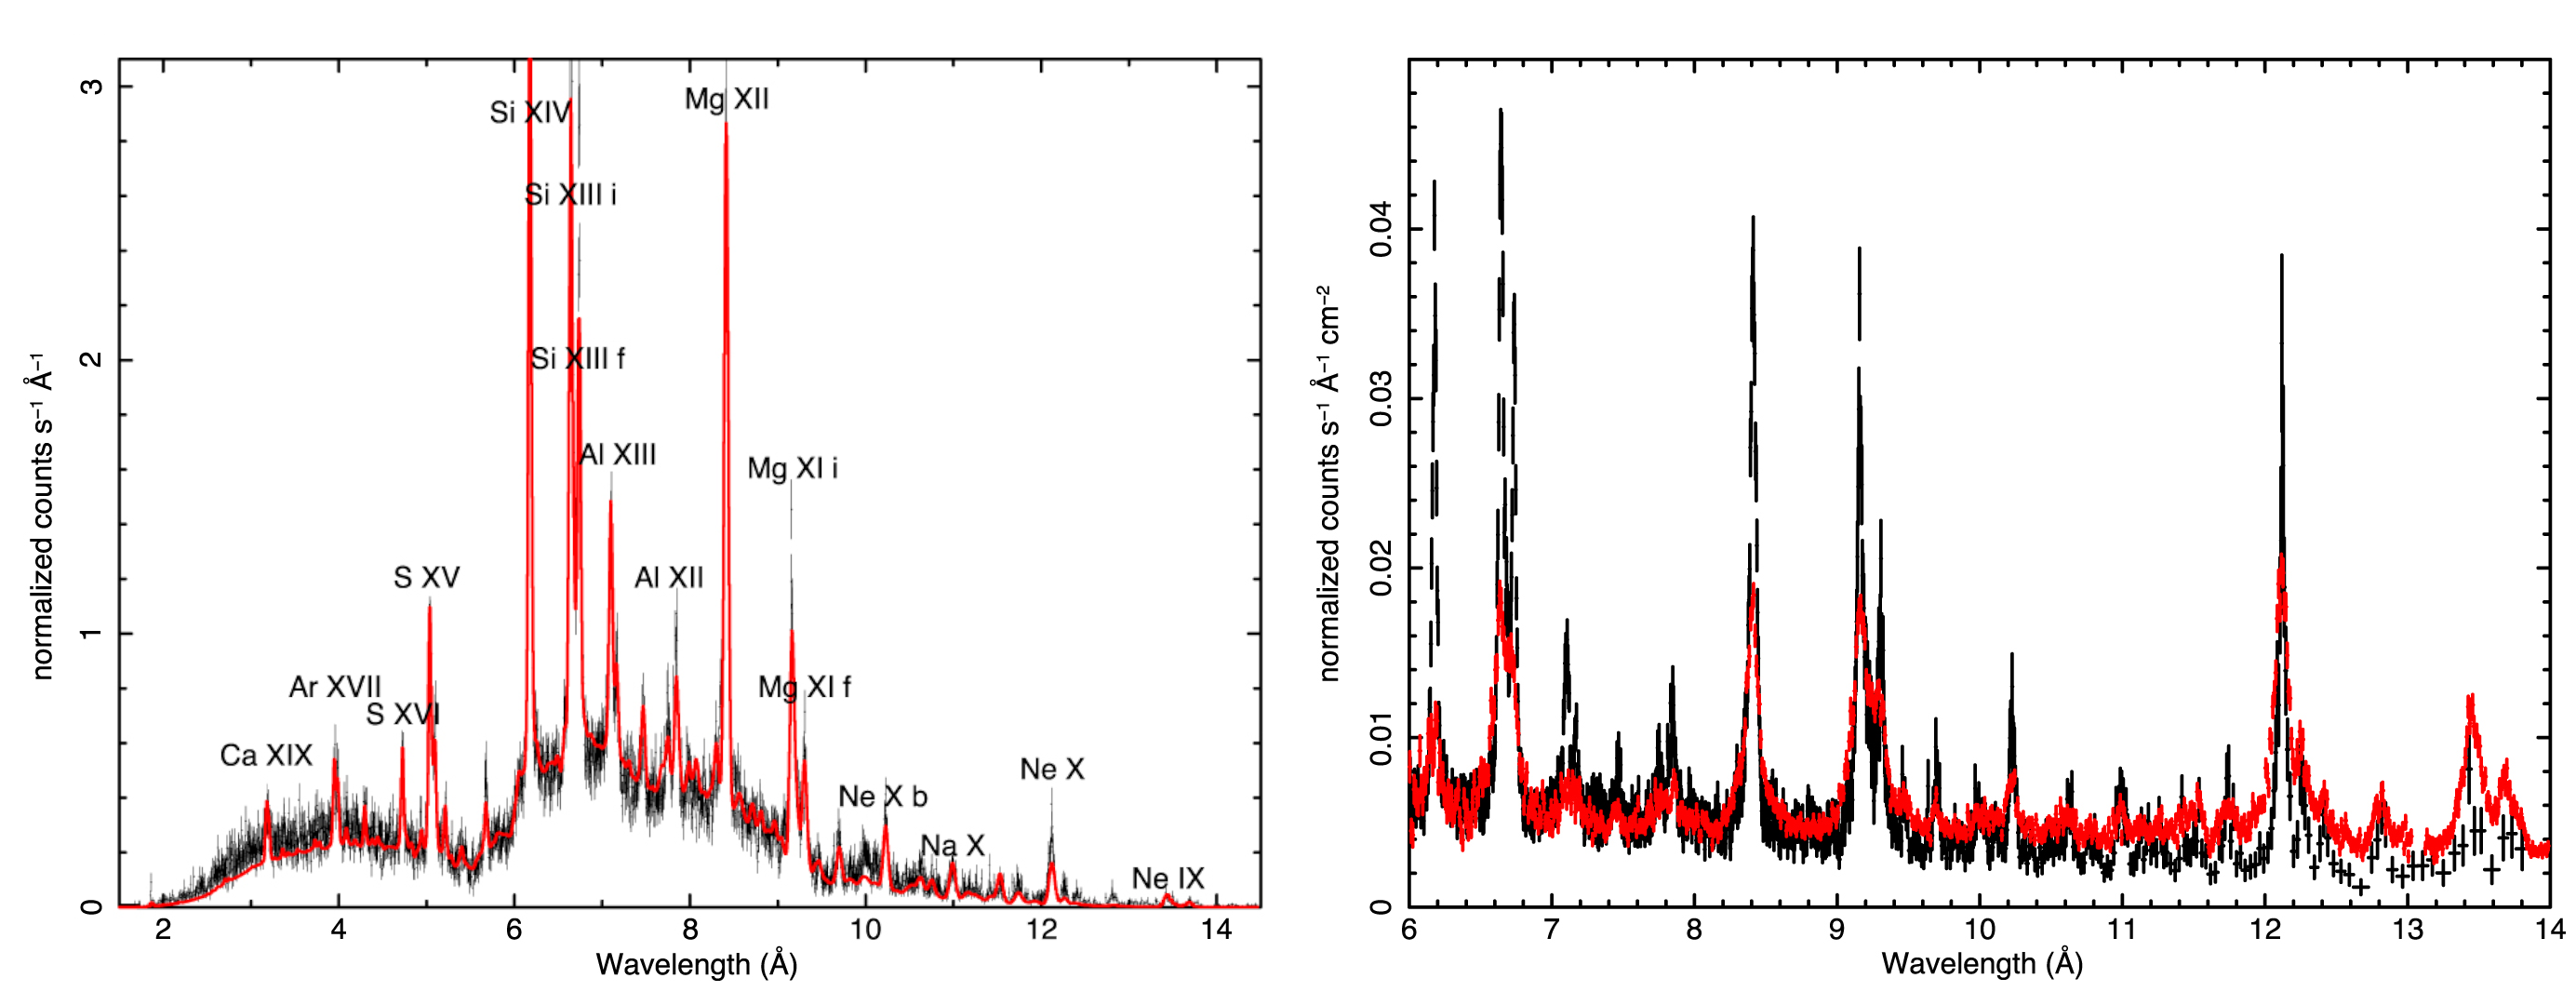
Figure 1: Left: The spectrum of RS Oph as seen by the Chandra MEG grating 18 days after optical maximum. The H-like and He-like emission lines from the double APEC model are listed. Right: The 18 day Chandra MEG spectrum in black is overlaid with the 21 day XMM-Newton RGS spectrum in red. Slight differences can be seen from the addition of a third supersoft kT≈100 ev thermal component. Both panels are reproduced from Orio et al. (2022).
The HETG day 18 spectra were well fitted with two thermal APEC components, one with a temperature of 0.75 keV and the other in the range of 2.5–3.4 keV. This hotter temperature gas is seen to be almost fully ionized, as it contributes to the H-like emission lines. The RGS day 21 spectra were fitted with three thermal components, with plasma temperatures of approximately 70–150 eV, 0.64 keV, and 2.4 keV (see Figure 1). Coincident NICER spectra on day 19 confirmed that this third supersoft thermal component was not initially present but rather emerged as the outburst evolved.
A well-measured intrinsic column density value of N(H)=5.2×1021 cm−2 was also obtained from the jointly fit NICER and HETG spectra. Line profiles show broadening with v~667 ± 14 km s−1 and a blue-shift velocity of v~263 ± 13 km s−1, which can be interpreted as asymmetric photoelectric absorption by the outflowing material.
An earlier outburst in 2006, measured on day 26 with XMM-Newton RGS, showed additional emission lines and a stronger supersoft thermal component. The comparison between these two outbursts—the only two with significant high resolution spectral data—sheds light on the variations in the X-ray emission of recurrent novae and provides insight into the underlying physical processes. Additional analysis can be found in Orio et al. (2023).
AGN analysis today and in the future
Archival data are a rich resource from which to pull information, and Chandra's incredible ~24 years of operation make it a powerful tool for multi-epoch analysis. Using the past 20 years of Chandra HETG data, Keshet et al. (2022) analyzed an array of Active Galactic Nuclei (AGN) to not only probe the underlying physics governing AGN outflow ionization structures but to also turn an eye to the future of high resolution spectroscopy.
The slow ~100 km s−1 outflows from Seyfert AGNs can be described by their ionization parameter ξ and the column density NH, both of which can be well measured by Chandra HETG spectra. The relationship between the two yields the Absorption Measure Distribution (AMD), parameterized by a power law in ξ with slope α.
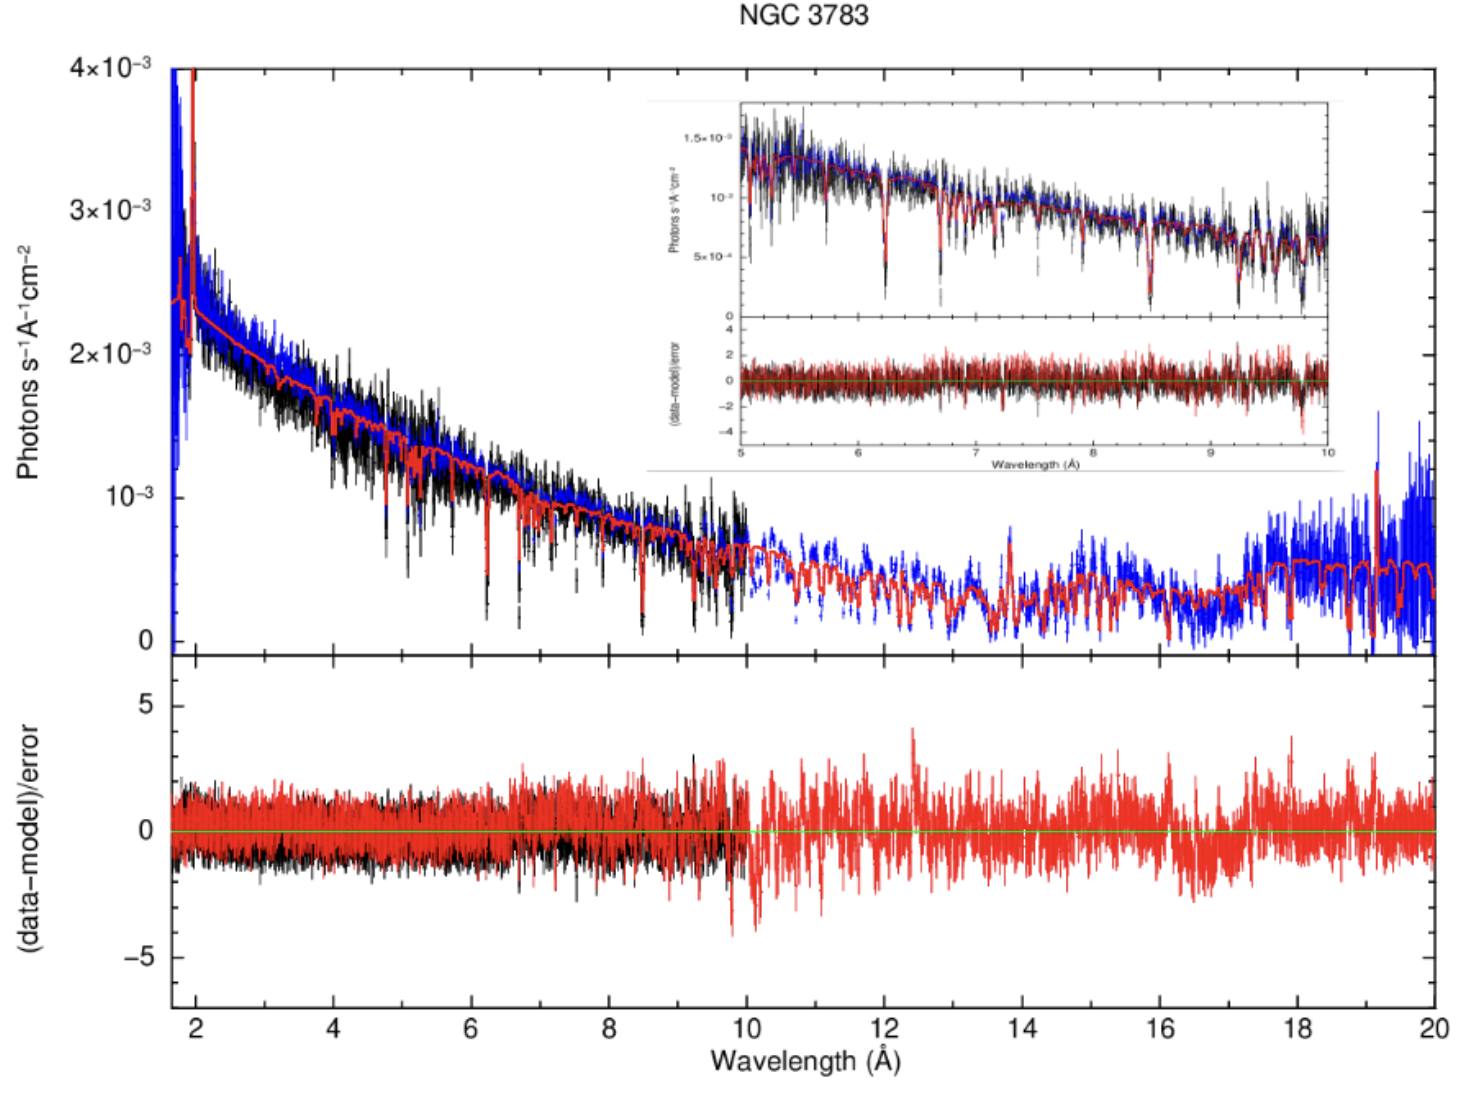
Figure 2: The 800 ks stacked HETG spectrum of NGC 3783, one of the nine Seyfert AGN studied by Keshet et al. (2022). The data from HEG (black) and MEG (blue) are overplotted with the fitted model in red. Residuals are shown in the bottom panel. The model contains eight ionizing components and a turbulent velocity. The inset shows the 5 to 10 Angstrom range to highlight narrow absorption lines. This figure is adapted from Keshet et al. (2022).
Nine Seyfert AGN were chosen for study, each having multiple Chandra HETGS archival observations that totalled at least 190 ks. The stacked spectra were fitted with a complex model that included an absorbed power law continuum, a soft black body excess (if needed), six ionizing components (ξi=−1, 0, 1, 2, 3, 4), and an outflow velocity v=100 km s−1. Figure 2 shows the spectra and model fit of NGC 3783, which required two additional components ξi=−0.5, 2.5. The resultant AMD plots (log NH vs log ξi) have slopes a=0.00–0.72 among the AGN, indicating a broad ionization distribution in the outflows. However, the exact process that drives the outflow properties remains to be understood.
To further explore the ionization structure of AGN outflows, Keshet et al. (2022) simulated spectra using the anticipated response of the XRISM/Resolve spectrometer, which has improved spectral resolution and effective area. Resolve will expand on the results obtained by Chandra/HETG; the new instrument can constrain the column density measurements as well as the HETG, but it can do so with much shorter observations, on the order of 100–200 ks. This suggests that Resolve has the potential to improve diagnostics of AGN outflows.
A dusty galactic bulge
Absorption from dust can provide valuable information about the material along the observer’s line of sight. Prior studies focused on O K, Ne K, and Fe L absorption to measure X-ray absorption of interstellar dust and its compositions in the Galactic Bulge, but recently attention has turned to the complex Si or Mg K-edge features (Schulz et al. 2016, Rogantini et al. 2020). Yang et al. (2022) use the Chandra HETG spectrometer and a judicious choice of nine low-mass X-ray binaries (LMXBs) to determine X-ray absorption gas and dust optical depths at Si K with great precision.
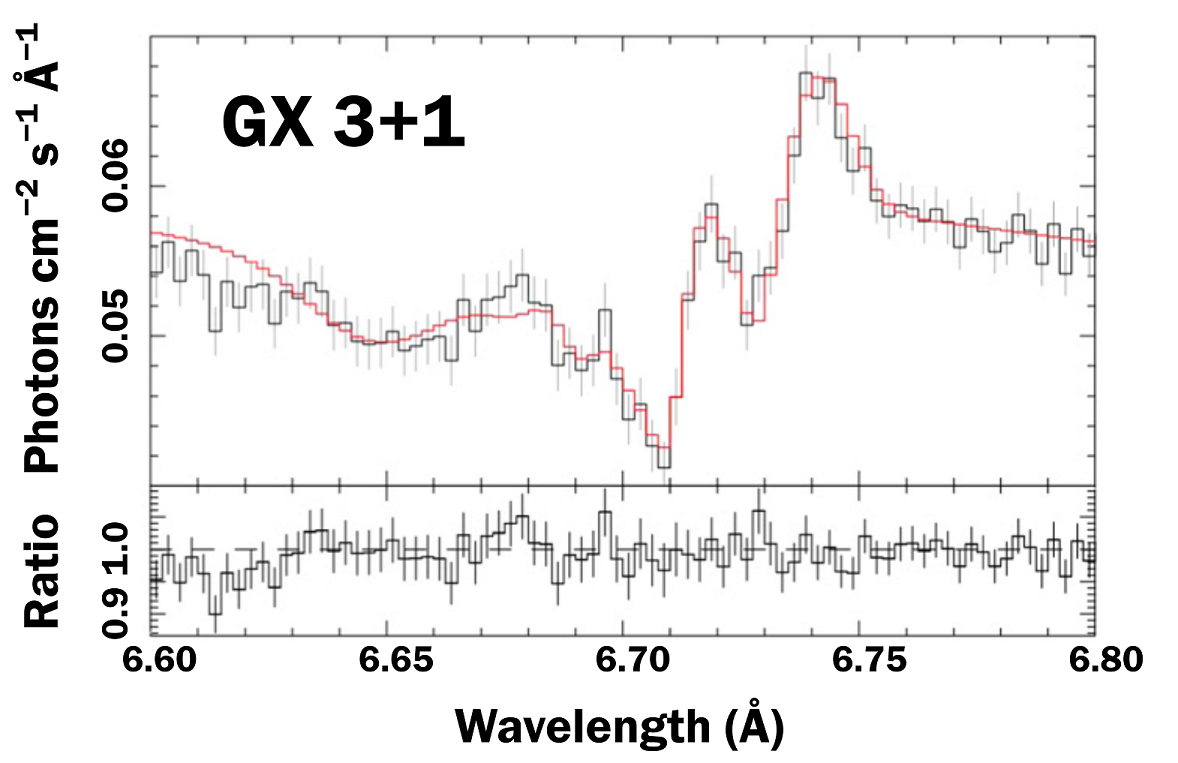
Figure 3: The HETG spectrum from GX 3+1, one of the nine LMXBs observed by Yang et al. (2022). The unfolded spectrum is shown in black while the complete model is in red. The shown energy band highlights the Si complex, which is best fit by a model containing edges from both silica dust and gas. This figure is adapted from Yang et al. (2022).
The Si K-edge structure contains signatures of the Si gas—composed of neutral and ionized atomic silicon—and Si dust, where Si is bound into silicates. The two phases produce two absorption edge features at 6.742 Å and 6.717 Å, respectively. Combined with Si absorption lines and instrumental effects modeled as unresolved Gaussian emission lines, the Si K-edge requires 27 parameters to fully describe the data, as seen in Fig. 3.
Chandra HETG spectra allow for the separate analysis of Si gas and dust, which is important as they have varying behaviors. While gas optical depths increase consistently with hydrogen-equivalent columns (NH), indicating a homogeneous distribution of Si gas, the dust optical depths varied significantly. There is no correlation between dust optical depths and either broadband columns or molecular hydrogen. When including a self-shielding formula (Wilms et al. 2000), three regimes of dust grain columns could fit the measured values.
The findings indicate that dust grain size distributions and varying dust densities are more relevant factors than abundance variations in determining the dust optical depths. It also highlights the importance of considering both gas and dust components in the analysis of the Si K edge structure and suggests further research to explore variability and long-term trends in the observations.
Outflow absorbers from NGC 4051
AGN and their host galaxies have an interdependent relationship. SMBHs can have strong winds and outflows that impact the star forming rates and galaxy evolution. Ogorzalek et al. (2022) have used two deep HETG observations of Seyfert galaxy AGN NGC 4051 from 2008 and 2016 (315 ks and 700 ks, respectively) and developed a Bayesian framework to compare different models and extract physical properties of the outflow.
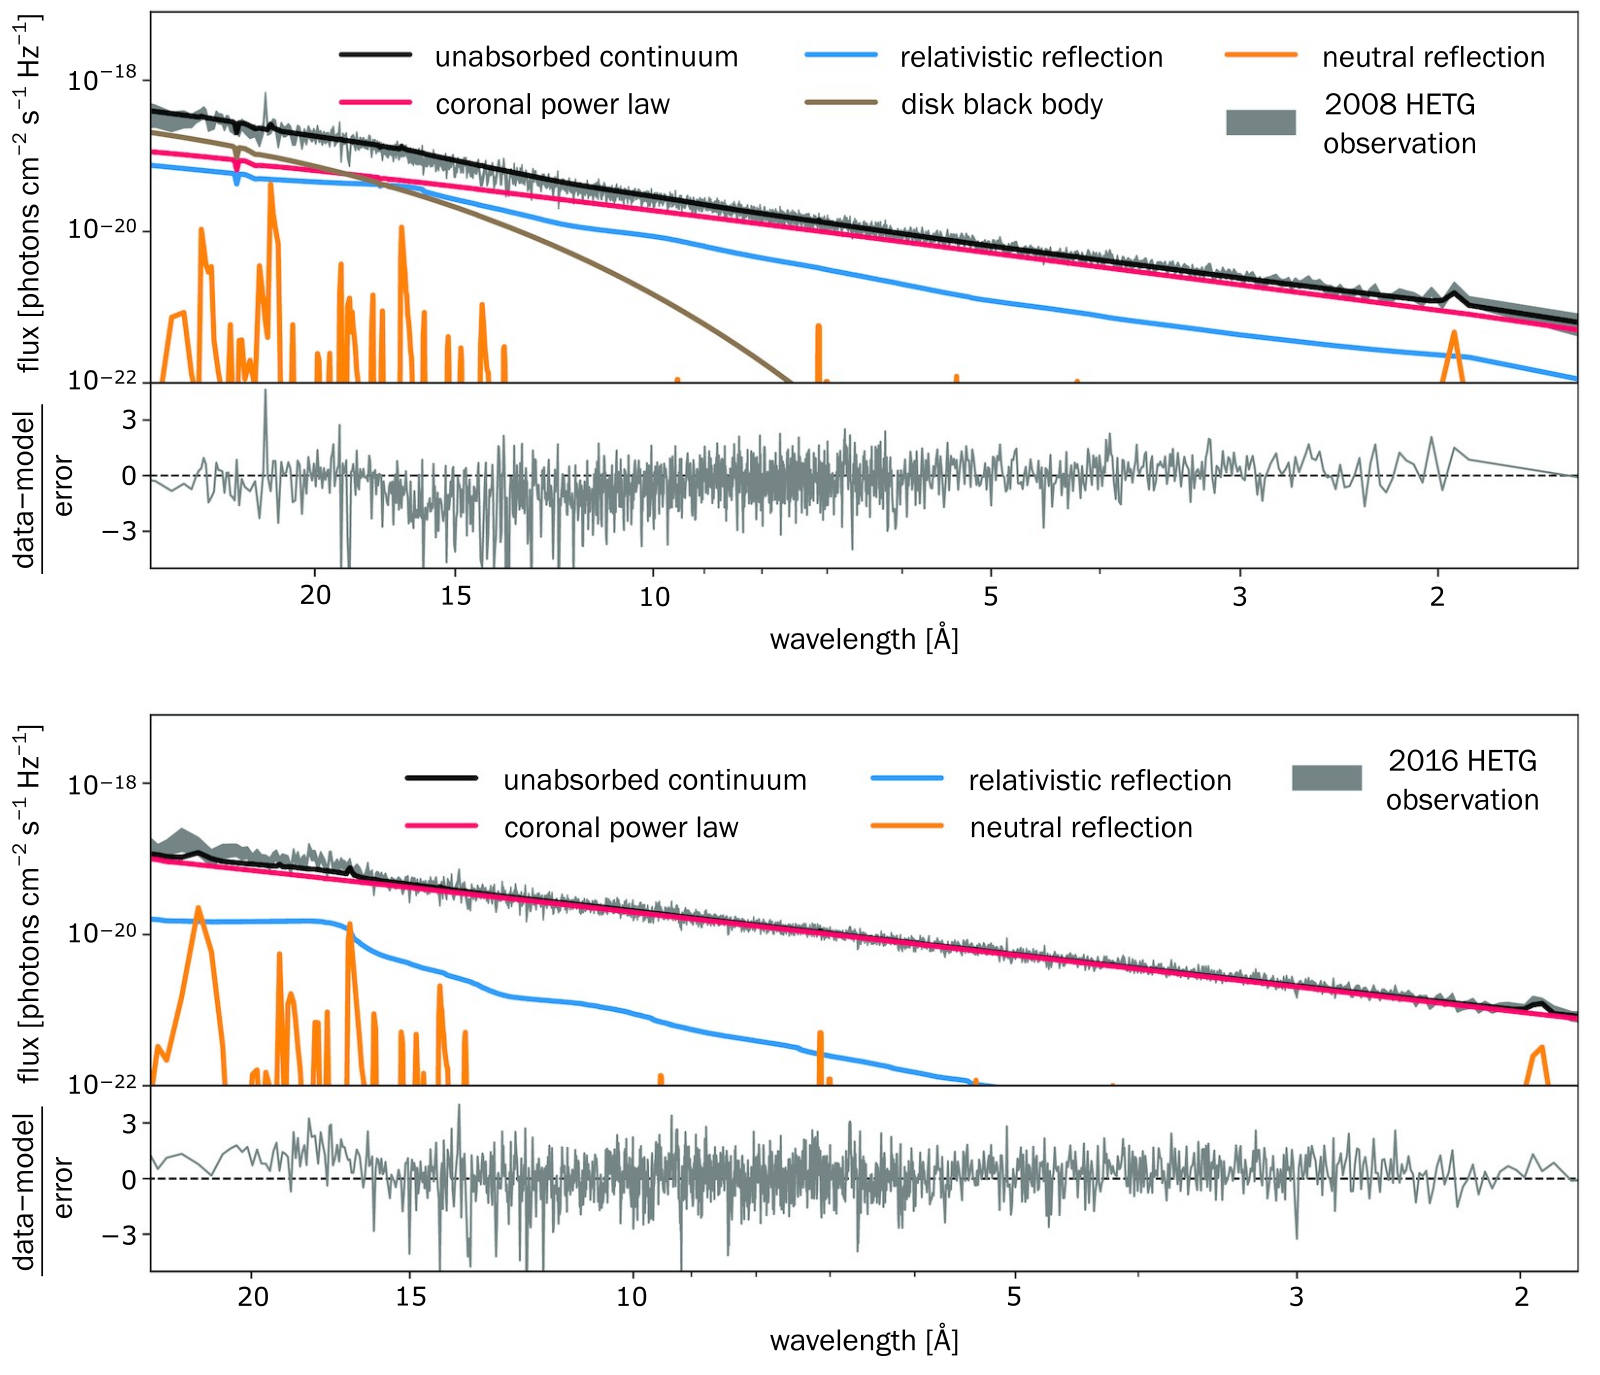
Figure 4: The unabsorbed spectrum of NGC 4051 at two different epochs. The Chandra HETG spectra from 2008 (top) and 2016 (bottom) are shown in gray. The spectral components are also indicated: the coronal power-law (red), relativistic reflection (blue), and neutral reflection (orange). The soft excess in 2008 data could not be explained with relativistic reflection only, and thus an addition of a phenomenological model—disk black body (brown)—was necessary. This figure is adapted from Ogorzalek et al. (2022).
Six absorbers intrinsic to NGC 4051 were identified and categorized as SLOW, FAST, and VFAST based on their velocities. Five of these absorbers were present in both epochs, with the physical properties of the slow absorbers remaining consistent over time. In contrast, however, the faster components showed signs of variability.
One notable finding is the detection of a purely collisionally ionized absorber with a temperature of 107 K and a velocity of 880 km s−1. This is the first time such an AGN wind in absorption has been detected. A second notable result was the detection of a relativistic absorber located approximately 240 gravitational radii from the black hole. The density of this component was measured to be log(n/cm3)=13.0+0.01−0.02, which is close to typical accretion disk densities.
References
- Keshet, N. & Behar, E. 2022, ApJ, 934, 124
- Nelson, T., Orio, M., Cassinelli, J. P., et al. 2008, ApJ, 673, 1067
- Ness, J.-U., Drake, J. J., Starrfield, S., et al. 2009, AJ, 137, 3414
- Ogorzalek, A., King, A. L., Allen, S. W., et al. 2022, MNRAS, 516, 5027
- Orio, M., Behar, E., Luna, G. J. M., et al. 2022, ApJ, 938, 34
- Orio, M., Gendreau, K., Giese, M., et al. 2023, ApJ, 955, 37
- Rogantini, D., Costantini, E., Zeegers, S. T., et al. 2020, A&AP, 641, A149
- Rupen, M. P., Mioduszewski, A. J., & Sokoloski, J. L. 2008, ApJ, 688, 559
- Schulz, N. S., Corrales, L., & Canizares, C. R. 2016, ApJ, 827, 49
- Wilms, J., Allen, A., & McCray, R. 2000, ApJ, 542, 914
- Yang, J., Schulz, N. S., Rogantini, D., et al. 2022, AJ, 164, 182