Cycle 25 Peer Review
Rodolfo Montez Jr. and the Chandra Director’s Office
This past June, 94 reviewers met online in 11 Topical Panels, 2 Target of Opportunity (TOO) Panels, and one Big Project Panel to discuss the 408 proposals submitted to Chandra's 25th call for proposals. The dual-anonymous Cycle 25 remote peer review was held June 20–29, 2023. The topical and TOO panels met for the first week (June 20–23) and the Big Project Panel the following week (June 26–29).
General Cycle 25 Proposal Statistics
Cycle 25 proposal statistics can be found in Figures 1–4 and on the CXC website.
The total amount of time allocated in Cycle 25 was 17.0 Ms. Of that, 3 Ms were awarded to 8 LPs and 2.1 Ms were awarded to a Very Large Proposal (VLP), a category of proposal requiring at least 1 Ms of observing time.
The Cycle 26 Call for Proposals (CfP) will be released on December 14, 2023 and the proposal deadline is March 14, 2024.
Target of Opportunity Proposals
In addition to the usual topical panels—on stars, supernovae and supernovae remnants, binaries, galaxy clusters, and AGN—this peer review hosted two target of opportunity (TOO) panels. TOO proposals request timely observations of variable phenomena (targets may be known or unknown at the time of proposing), which are triggered by criteria described in the proposal. Proposers estimate the probability of the proposal trigger and specify the response time required to secure the observations. Since TOO observations can be quite disruptive to spacecraft operations and the completion of other scheduled observations, the number of TOO triggers is limited based on the response time, with very fast triggers (requiring less than 5 day response time) limited to only 10 per cycle. In previous peer reviews, the TOO proposals were evaluated by the topical panels. From Cycle 25 onward, the TOO proposals will be evaluated together in TOO-specific panels. As a result, the TOO panels consider a broader range of scientific topics (see Figure 5), and proposers were asked to keep that in mind when writing their scientific justifications.
At the peer review, panels can award up to 10 very fast triggers (a response time from zero to less than 5 days), 20 fast triggers (from 5 to less than 20 days), 30 medium triggers (from 20 to less than 40 days), and 40 slow triggers (greater than or equal to 40 day response time). As shown in Figure 6, the number of very fast triggers had a similar demand to the previous three cycles, whereas the fast, medium, and slow triggers had a slight decline in the number of requests. The number of awarded triggers is comparable to the previous three cycles except for the slow category, which had fewer requests and therefore fewer awards.
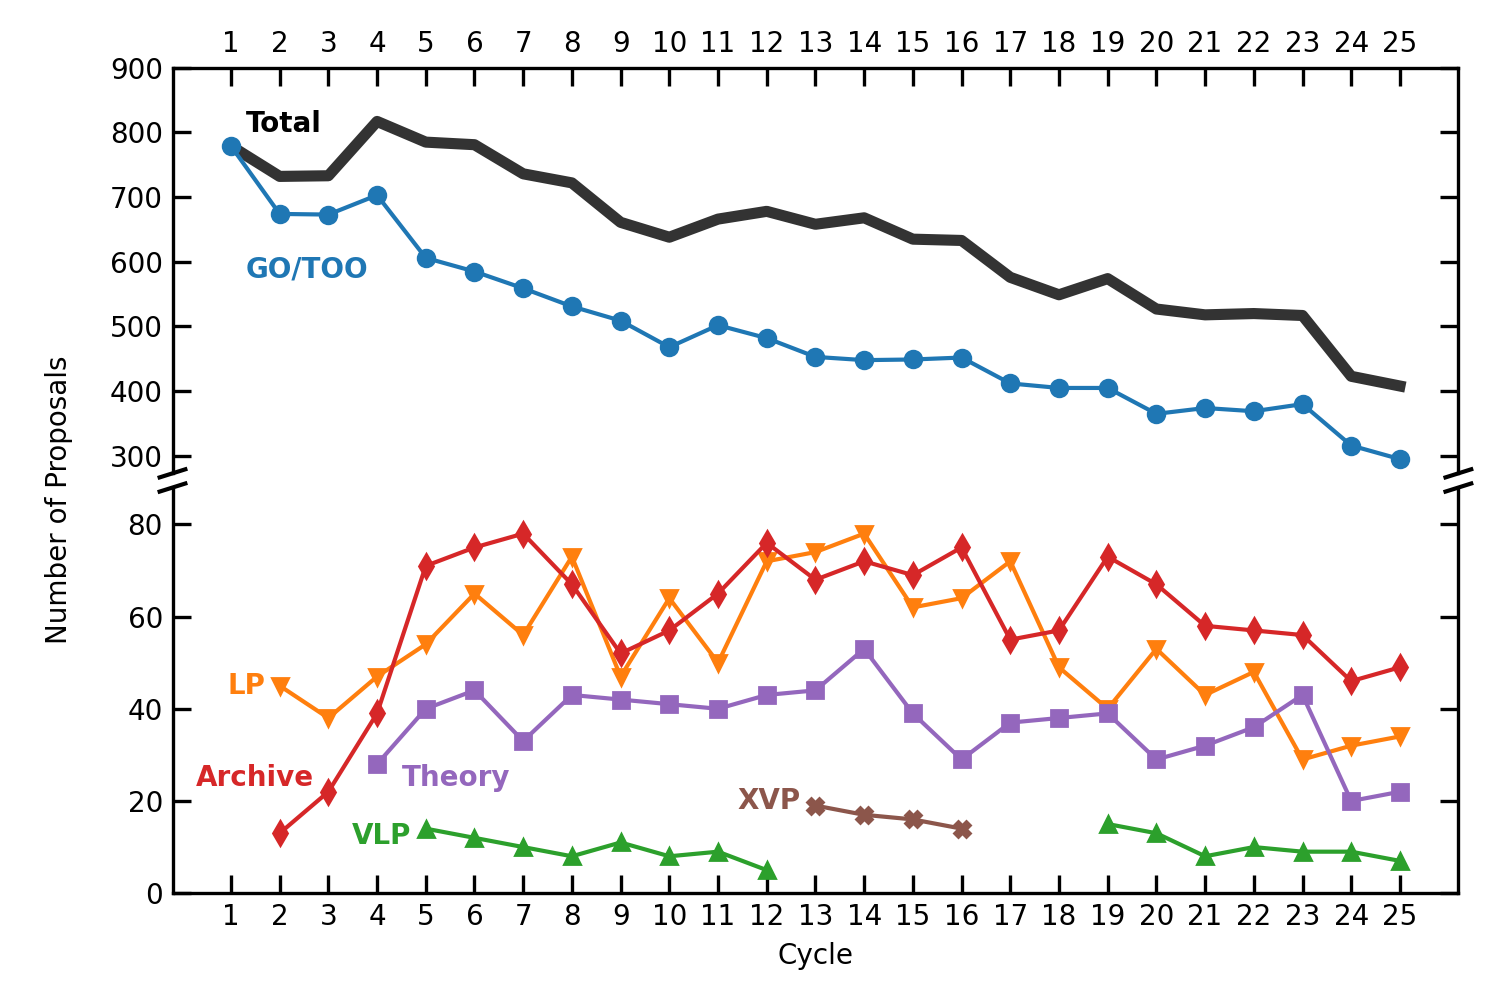
Figure 1: The number of proposals submitted in each proposal category (e.g., GO, LP, Archive) as a function of cycle. The y-axis is broken to indicate the entire range. Since more proposal categories have become available in each cycle, the number classified as GO has decreased as others increased.
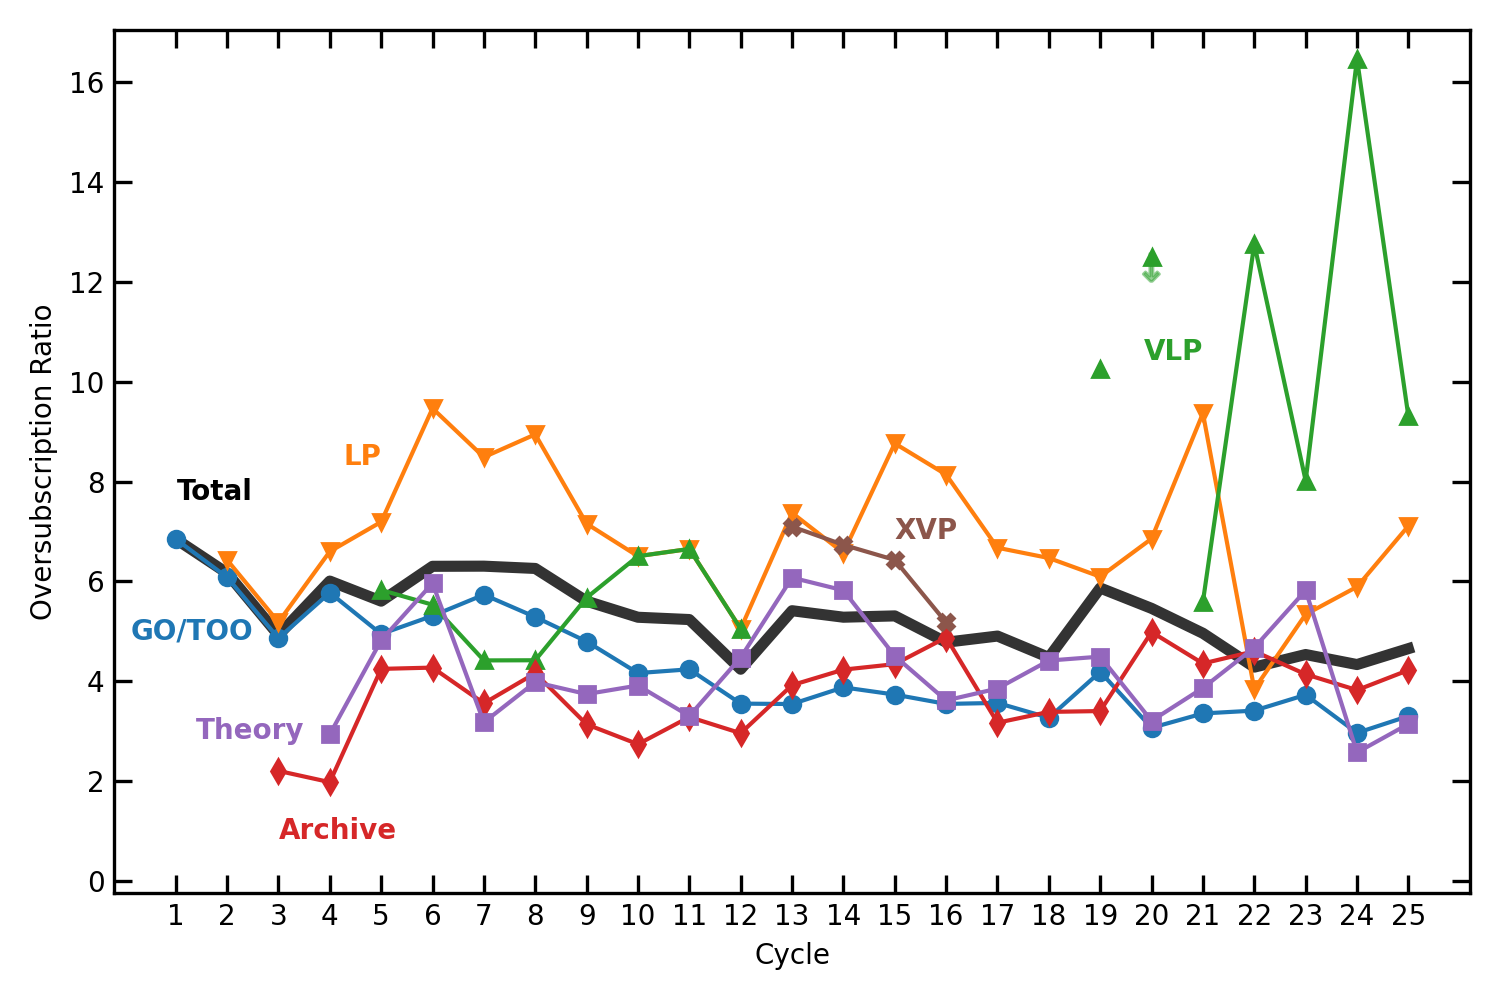
Figure 2: The effective oversubscription ratio in terms of observing time or money available for each proposal category as a function of cycle. Total oversubscription ratio is shown as the black solid line. Note that some of the fluctuations are due to small number statistics (e.g., Theory proposals). In Cycle 20, none of the submitted VLP proposals were selected by the peer review.
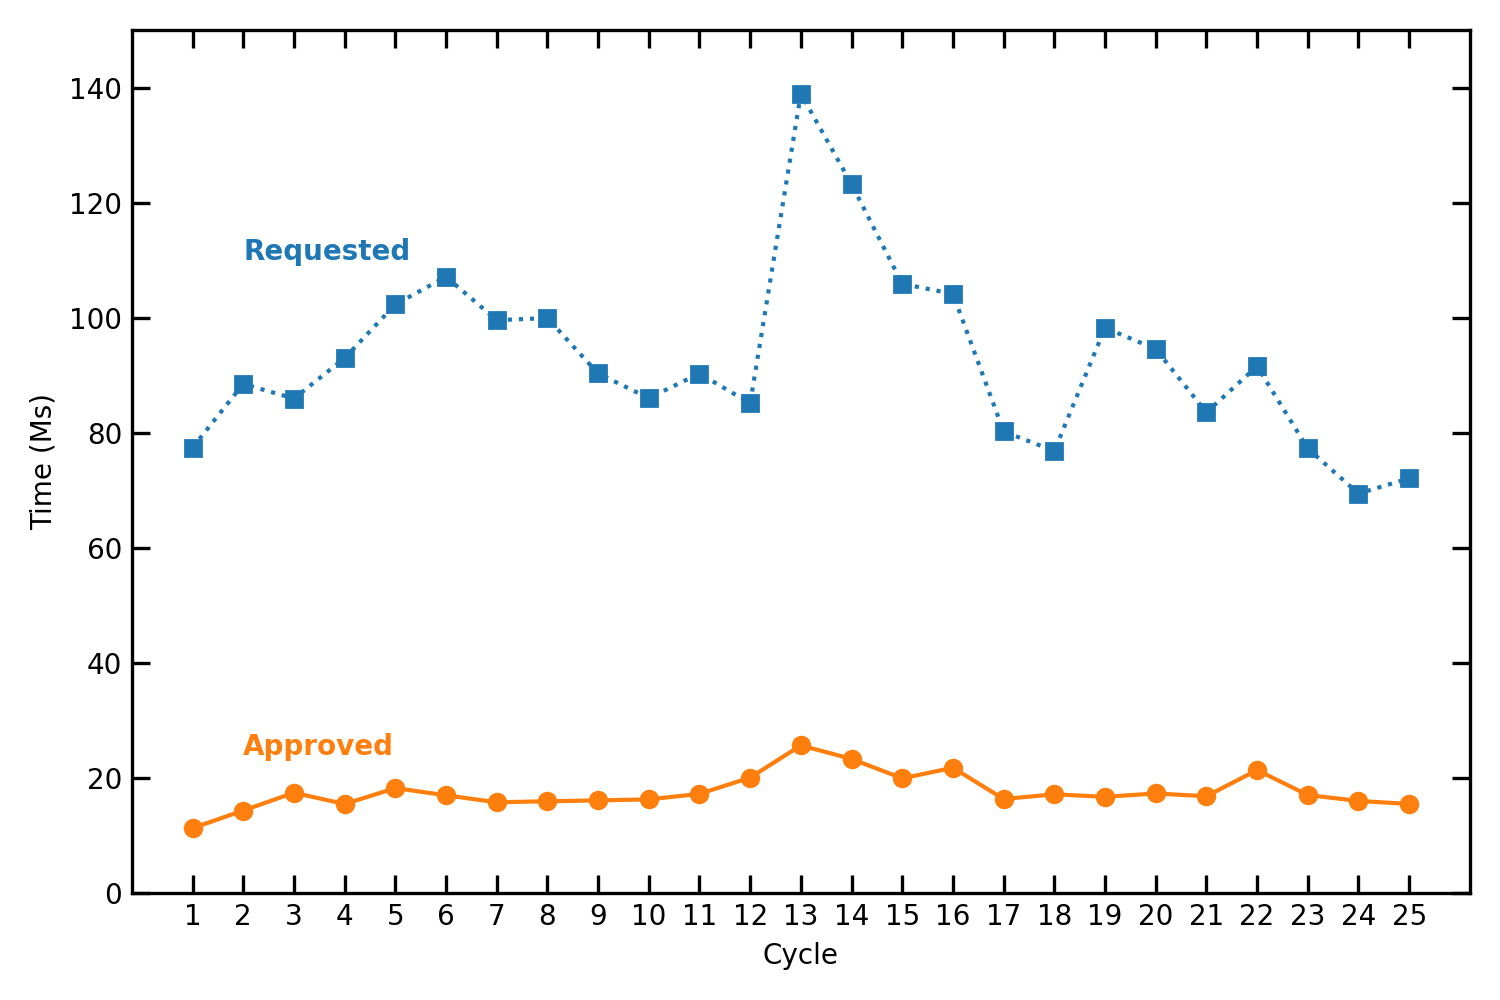
Figure 3: The requested and approved time as a function of cycle in ks including allowance for the probability of triggering each TOO. The available time increased both over the first three cycles and in Cycle 5 with the introduction of Very Large Projects (VLPs). A clear spike in the requested time is seen in Cycles 13–16 in response to the calls for X-ray Visionary Projects (XVPs). Additional increases in awarded time are due to the increases in observing efficiency.
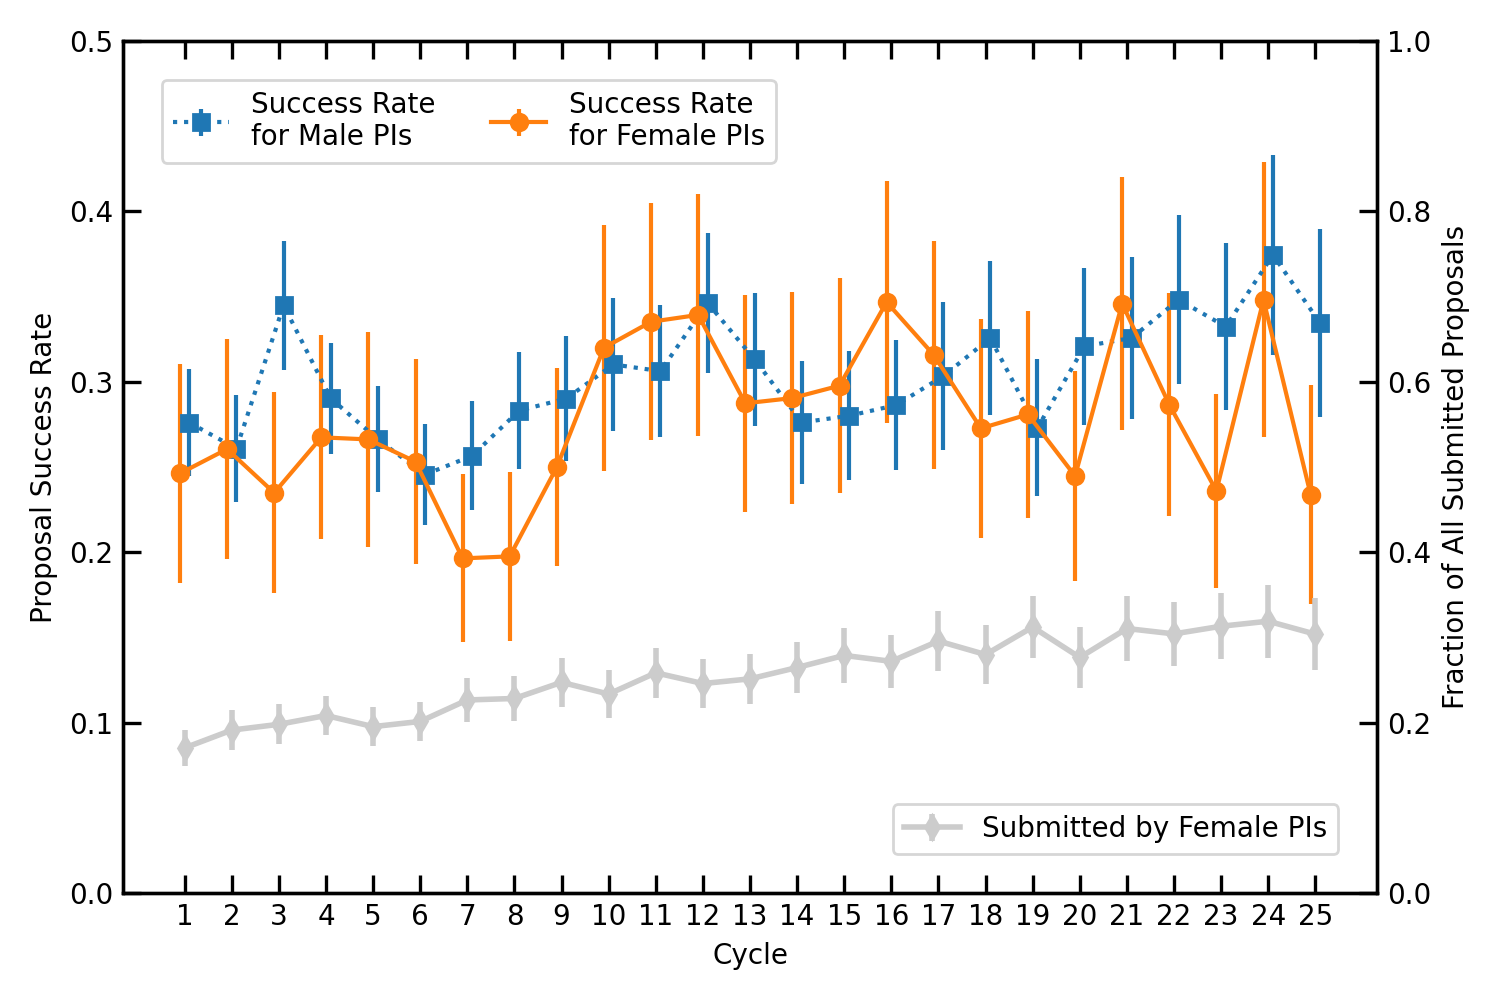
Figure 4: The success rate of male (orange) and female (green) PIs as a function of cycle, and the overall fraction of female PIs (gray). Since Cycle 10, the success rate for female and male PIs has been statistically indistinguishable.
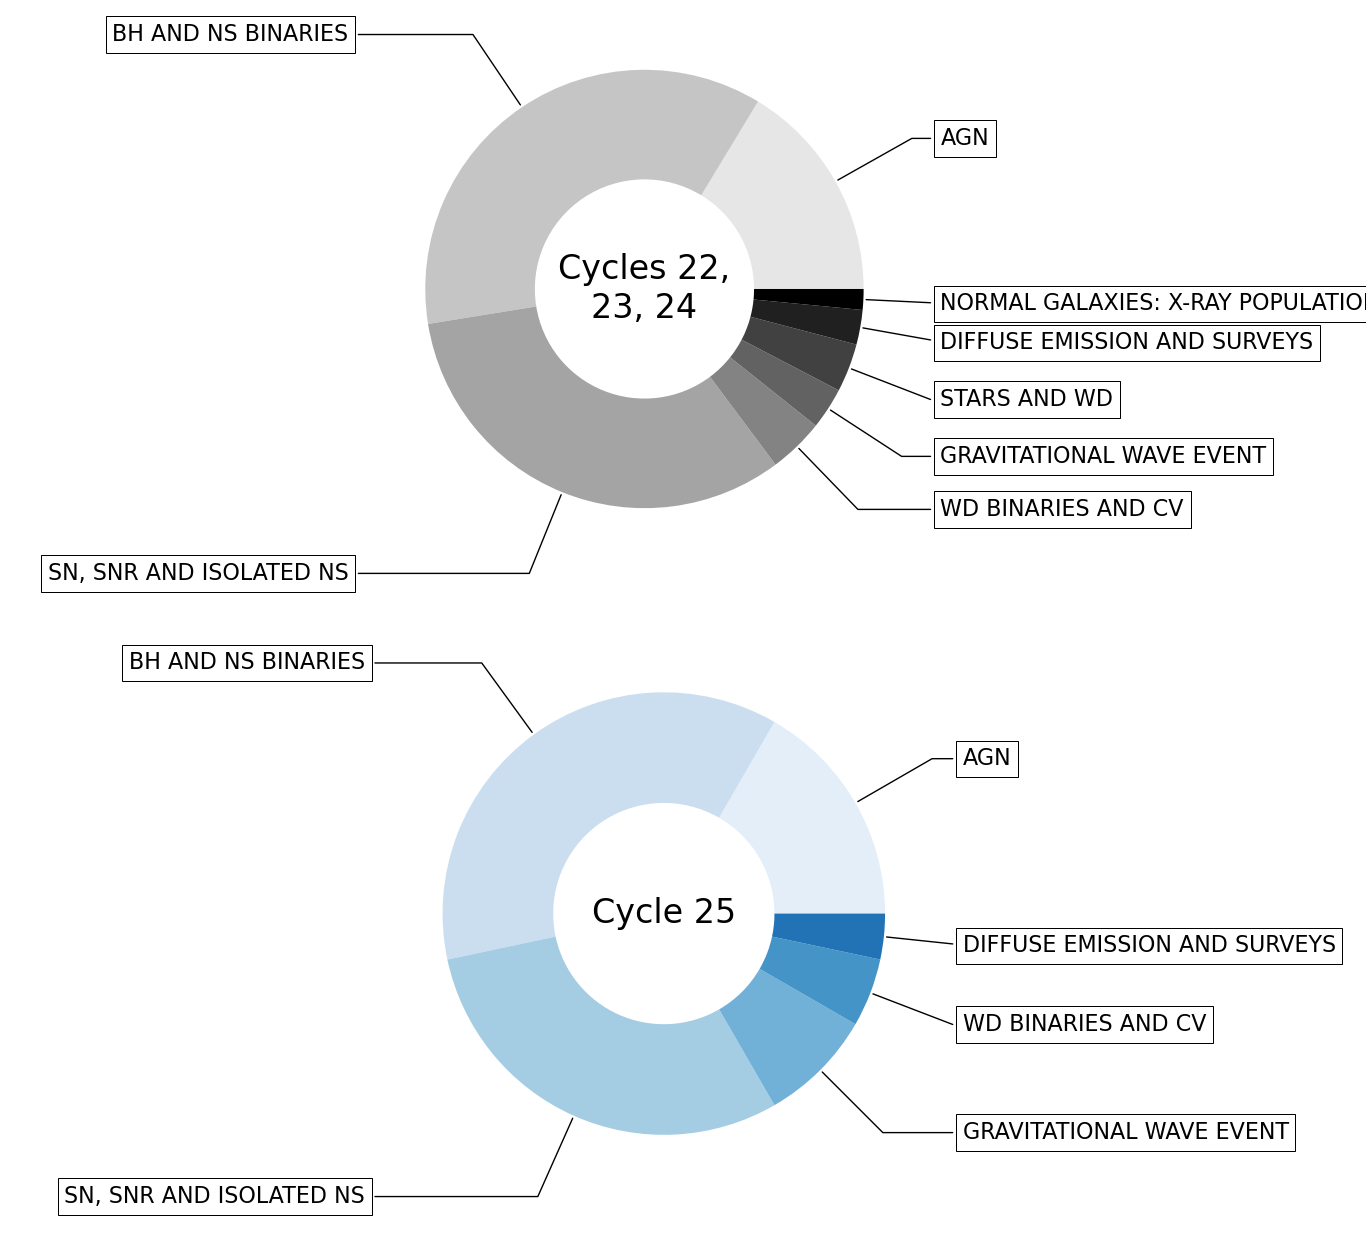
Figure 5: The distribution of TOO proposals by topical category for Cycles 22–24 (top, shades of gray) and Cycle 25 (bottom, shades of blue). Each wedge is sized in proportion to the number of proposals received in each topical category. The top three categories are Black Holes and Neutron Stars Binaries (BH AND NS BINARIES), Supernovae, Supernovae Remnants, and Isolated Neutron Stars (SN, SNR, AND ISOLATED NS), and Active Galactic Nuclei (AGN).
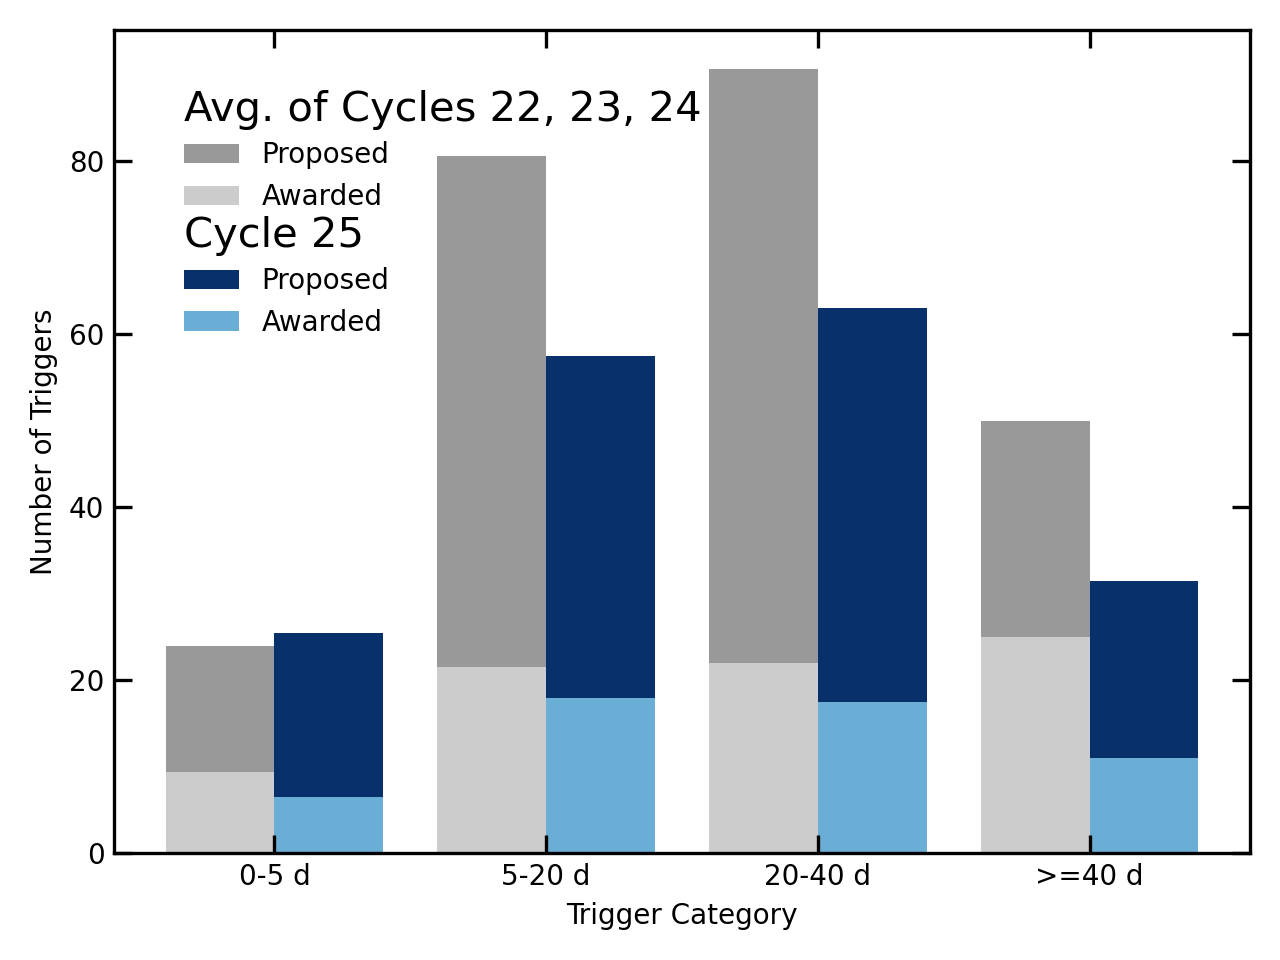
Figure 6: The distribution of trigger requests and awards by response category for the average of the past three cycles (gray) and Cycle 25 (blue).