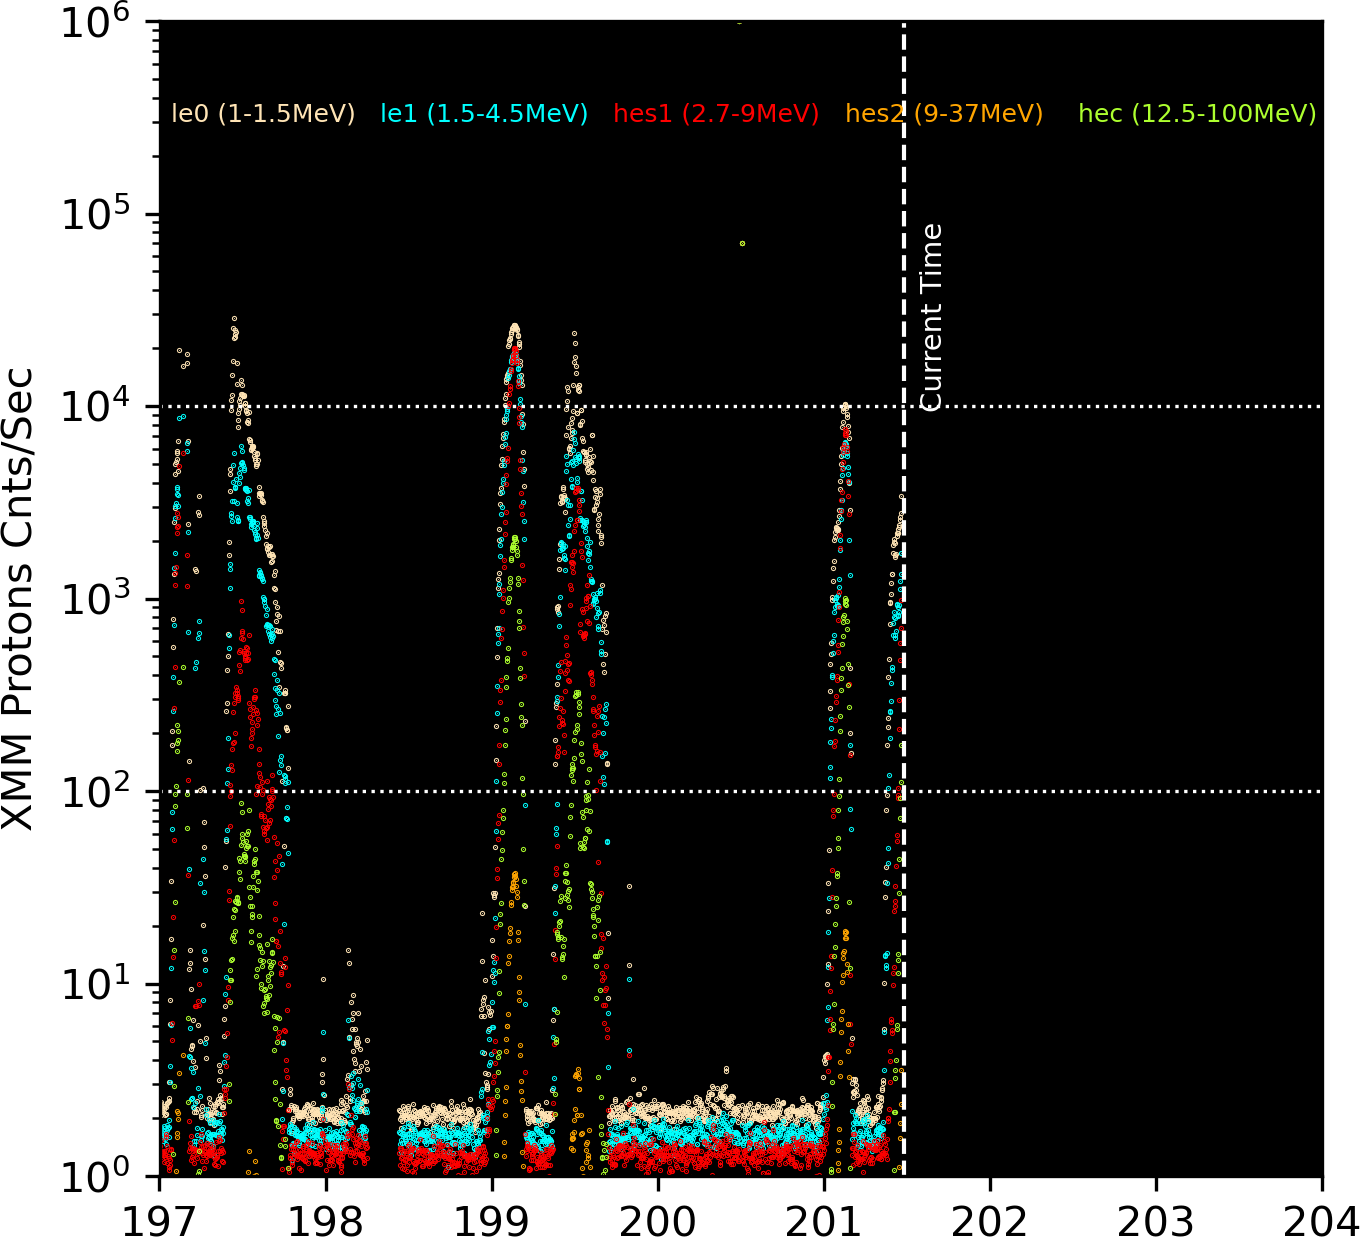
                                        Most recent XMM radiation observations
                                 Differential Flux particles/cm2-s-ster-MeV

 UT Date   Time    ---------------------------------- Protons MeV -------------------------------
                          LE1          LE2         HES1         HES2         HESC
  YR MO DA HHMM          1-1.5       1.5-4.5       2.7-9        9-37       12.5-100
2026-May23-14:30       82.531        0.433        7.652        0.468        0.980
2026-May23-15:30      194.827        0.421       29.143        0.487        3.142
2026-May23-16:30      236.915        0.439       47.804        0.520        6.130
2026-May23-17:30      168.382        0.430       30.747        0.517        4.483
2026-May23-18:30       99.770        0.437       14.596        0.499        2.143
2026-May23-19:30       56.521        0.441        5.349        0.486        0.722
2026-May23-20:30       26.698        0.424        2.847        0.497        0.513
2026-May23-21:30        9.577        0.453        1.864        0.473        0.414
2026-May23-22:30        2.844        0.420        1.485        0.456        0.374
2026-May23-23:30        1.979        0.426        1.420        0.465        0.401
2026-May24-00:30        1.947        0.431        1.512        0.458        0.376
2026-May24-01:30        1.946        0.440        1.438        0.483        0.417
2026-May24-02:30        1.878        0.437        1.517        0.475        0.398
2026-May24-03:30        2.050        0.419        1.740        0.490        0.407
2026-May24-04:30        1.998        0.443        1.526        0.463        0.385
2026-May24-05:30        1.826        0.426        1.625        0.453        0.415
2026-May24-06:30        2.063        0.452        1.540        0.498        0.408
2026-May24-07:30        1.945        0.434        1.568        0.486        0.399
2026-May24-08:30        1.932        0.438        1.472        0.476        0.406
2026-May24-09:30        1.851        0.451        1.451        0.464        0.384
2026-May24-10:30        1.808        0.433        1.417        0.481        0.389
2026-May24-11:30        1.831        0.450        1.423        0.441        0.381
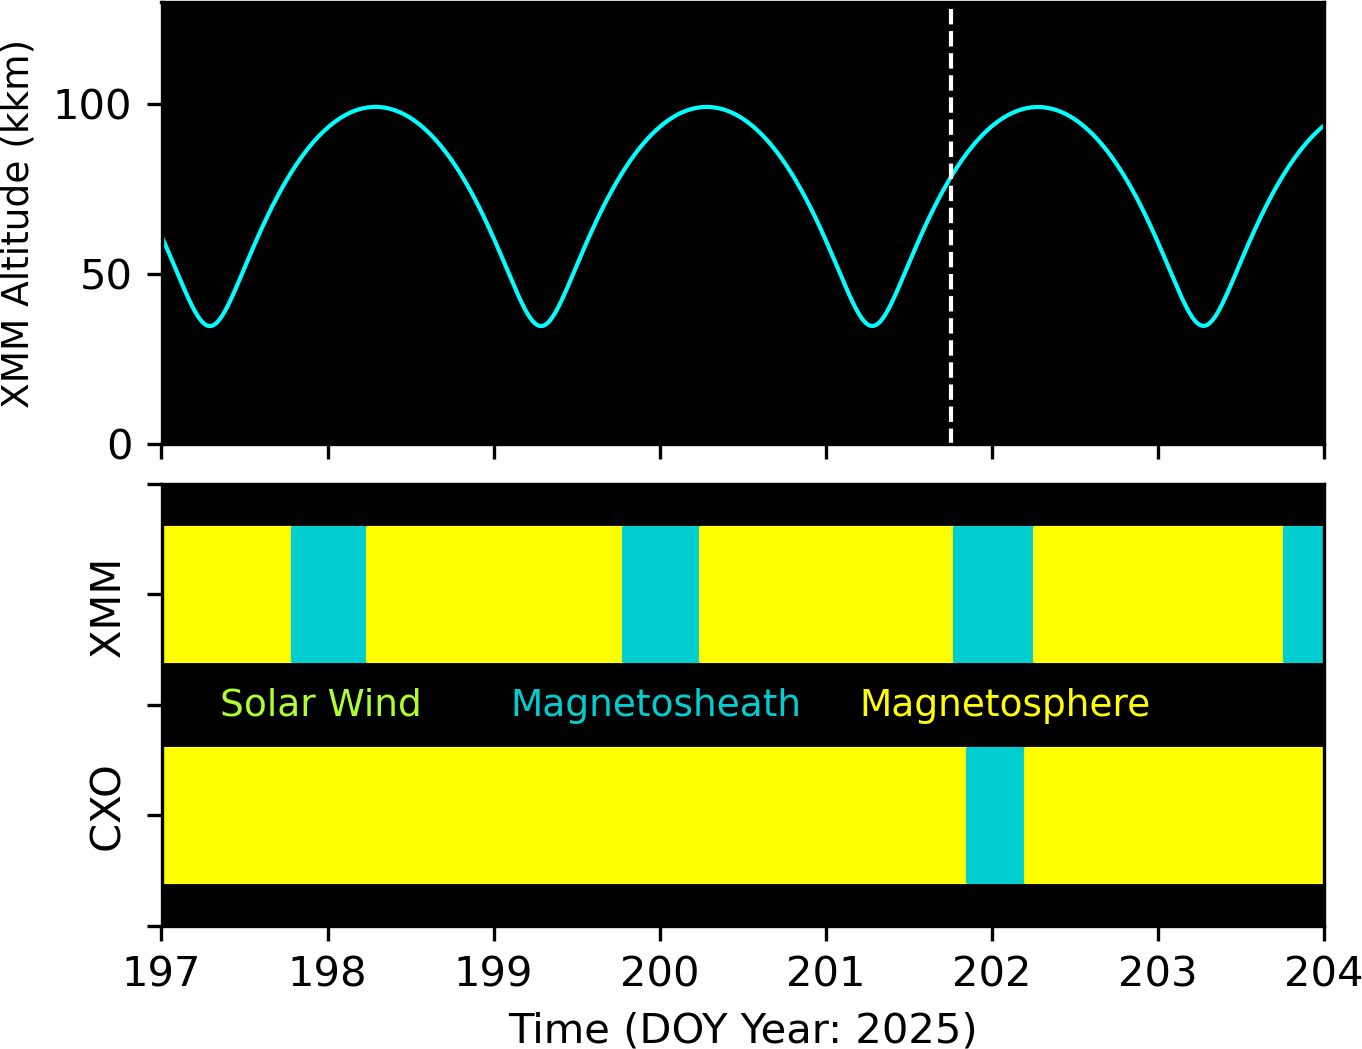
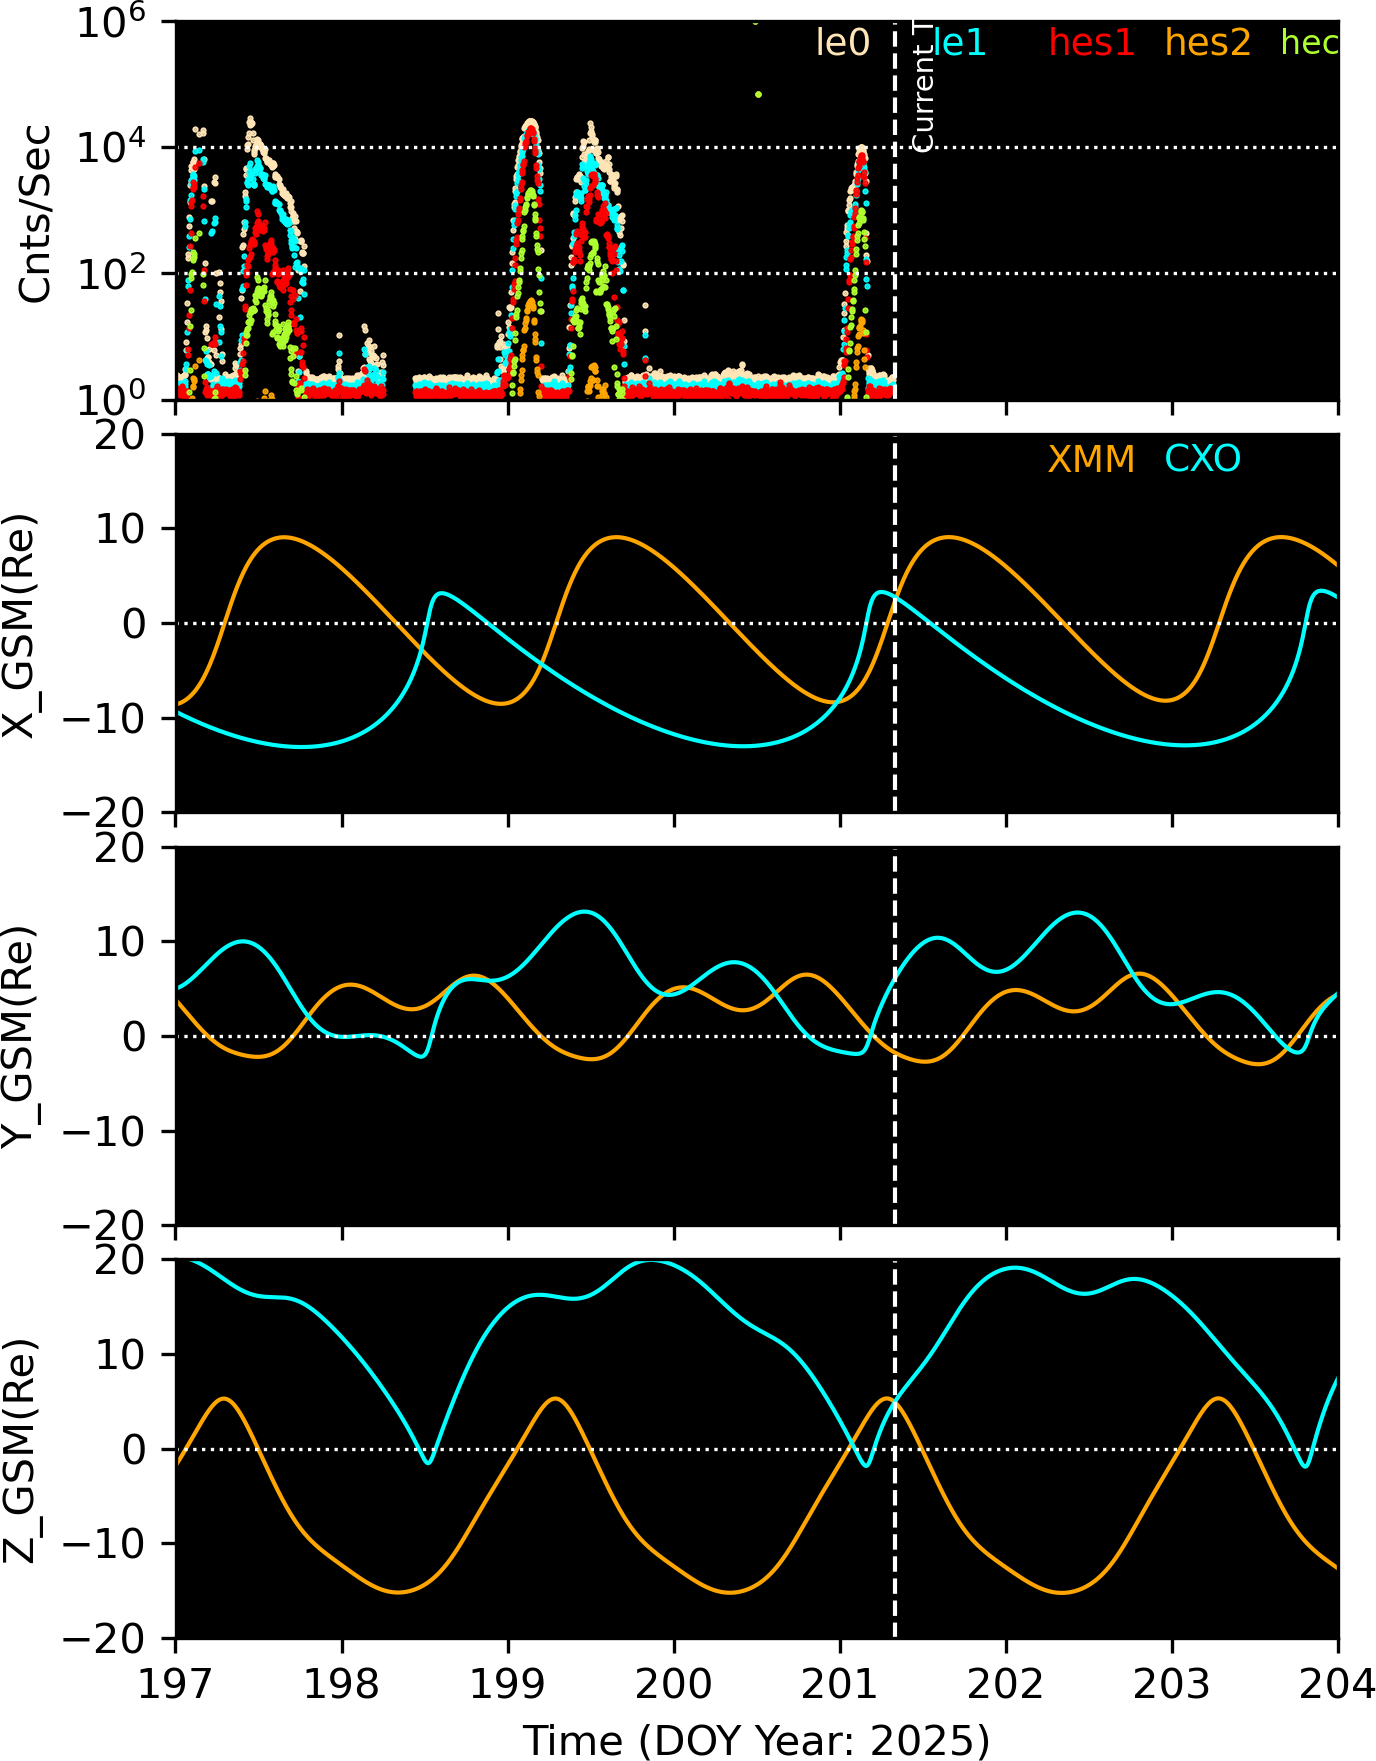
The following plots show the orbits of CXO and XMM in GSM coordinates. The left plot is in X-Y plane, and the right plot is in X-Z plane. If the orbit is in green, the satellite is in the solar wind area, if it is in light blue, the satellite is in magnetosheath, and if it is in yellow, the satellite is in magnetosphere.
The periods of the plotted orbits are +/-1.35 days from the current satellite positions (*), and the orange pentagon (*) mark the positions of one day ago.
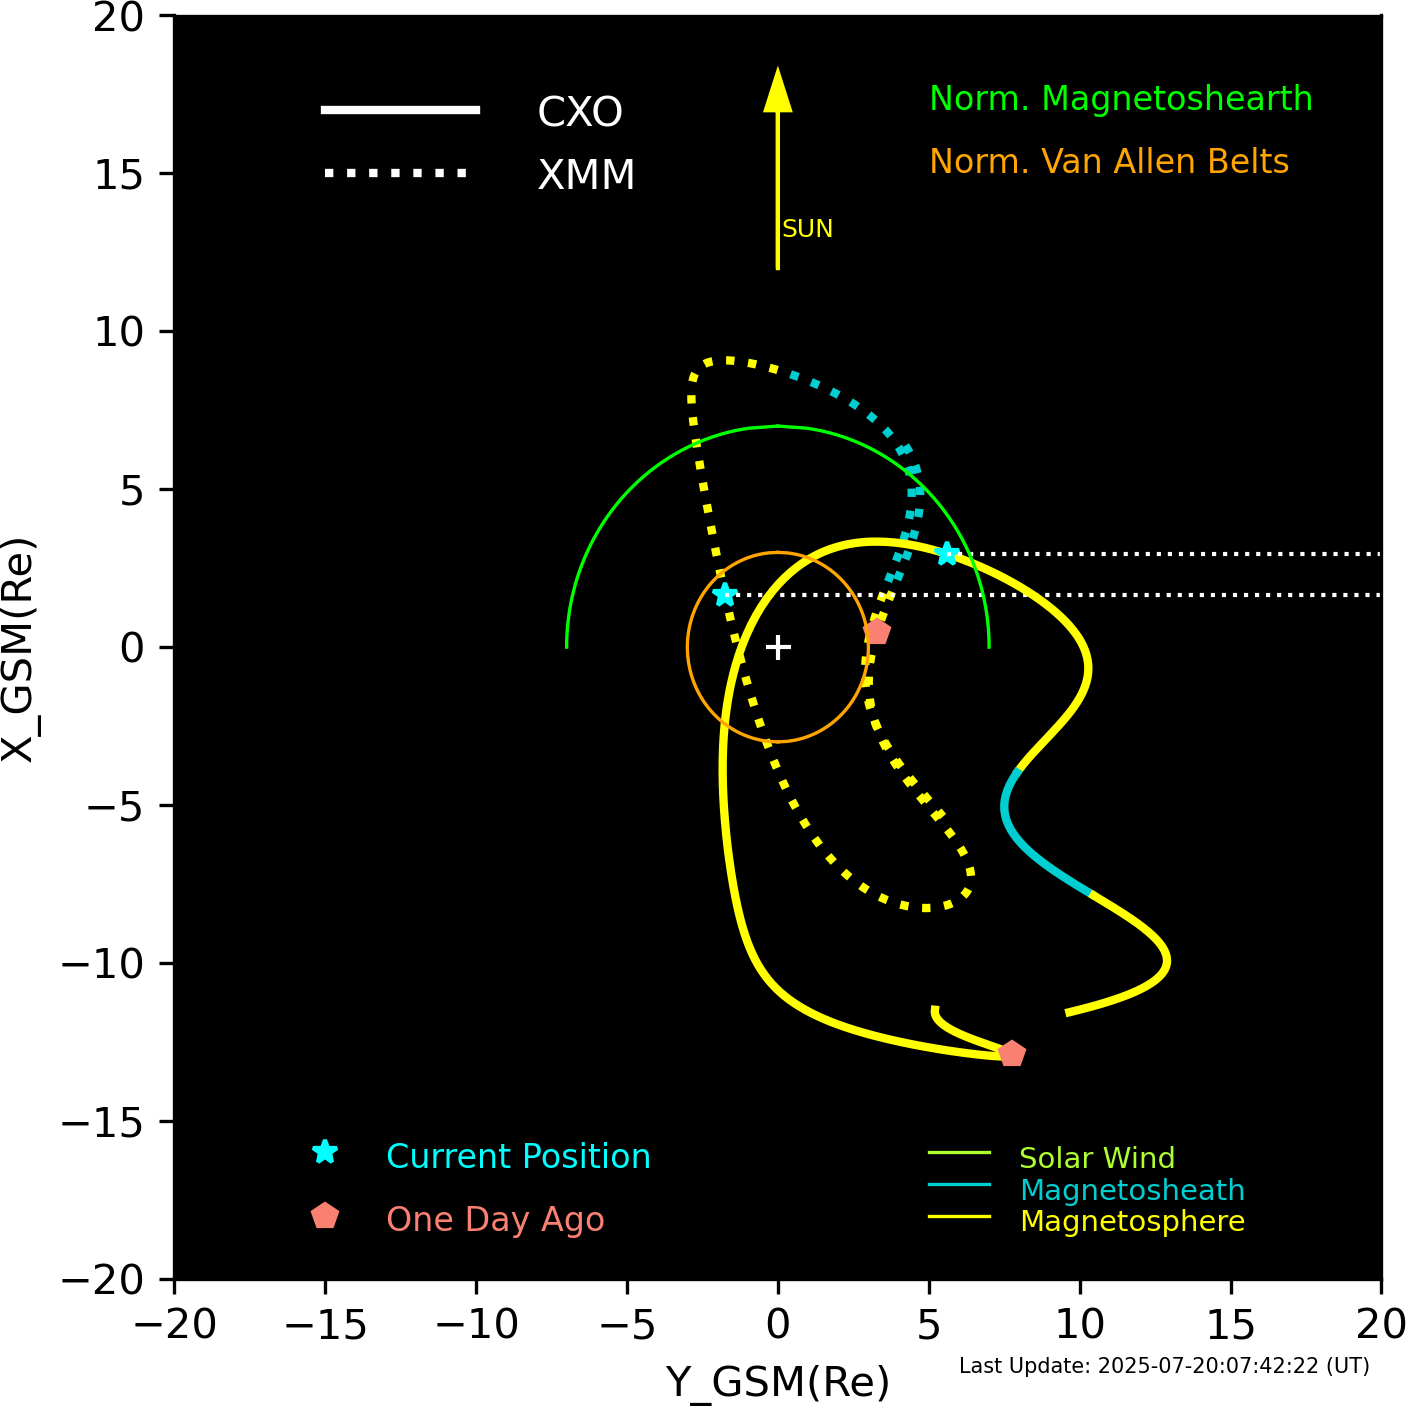
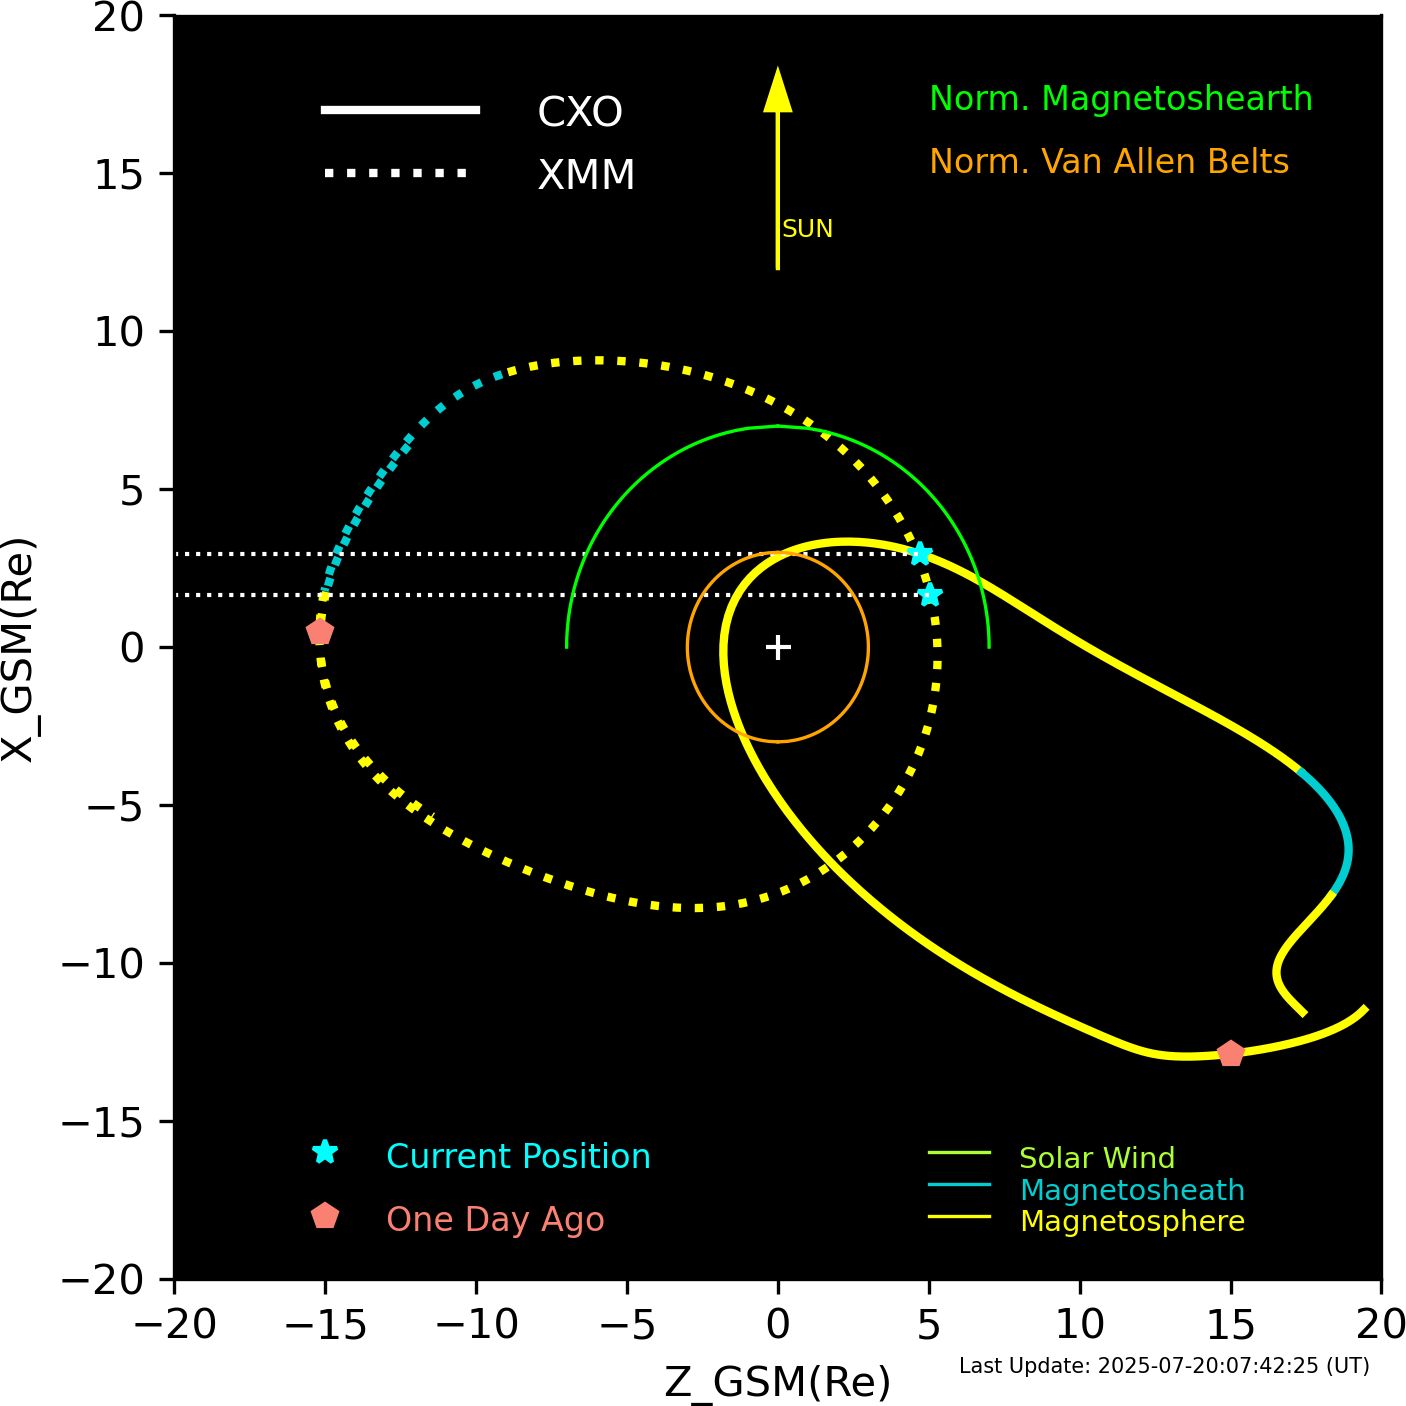
XMM and CXO orbits in GSM coordinates.
Email problems to: swolk
(Scott Wolk)
...it is all his fault