| CCD0 | CCD1 | CCD2 | CCD3 | CCD4 | CCD5 | CCD6 | CCD7 | CCD8 | CCD9 | |
|---|---|---|---|---|---|---|---|---|---|---|
| Previously Unknown Bad Pixels | ||||||||||
| Current Warm Pixels | ||||||||||
| Flickering Warm Pixels | (143,700) (154,9) | (910,239) (802,665) | (665,25) (526,66) (726,537) (178,149) | (21,95) (811,637) | (233,227) (263,317) (341,427) (282,385) (233,314) (258,797) (357,303) (161,206) (367,511) (607,281) (369,376) | (1000,214) (670,387) (287,164) | (335,412) | (182,474) (881,53) (332,324) (275,393) (220,813) (197,241) | ||
| Current Hot Pixels | ||||||||||
| Flickering Hot Pixels | ||||||||||
| Warm column candidates | 512 1022 510 | 1022 512 | ||||||||
| Flickering Warm column candidates |
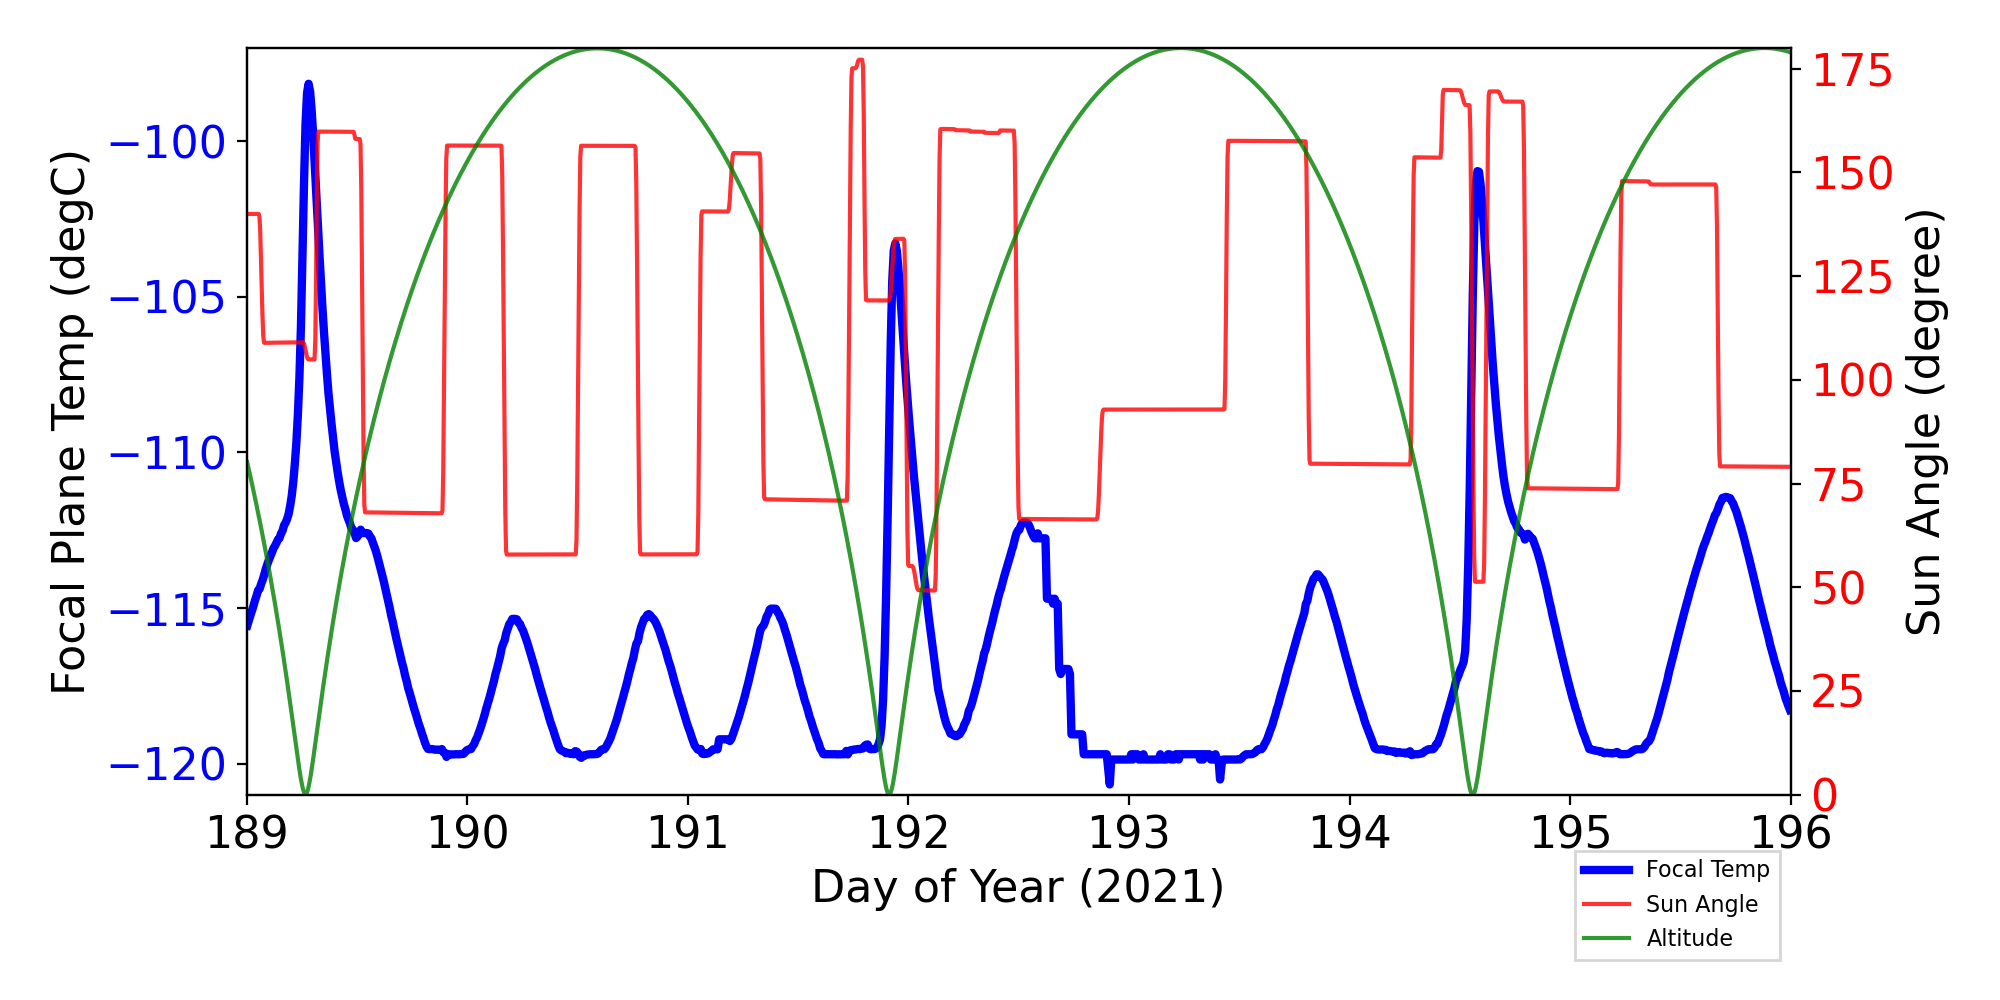
ACIS Focal Plane Temperature
For this period, 9 peaks are observed.
| Day (DOY) | Temp (C) | Width (Days) | |
|---|---|---|---|
| 189.29 | -98.41 | 1.14 | |
| 190.23 | -115.36 | 0.53 | |
| 190.83 | -115.23 | 0.52 | |
| 191.40 | -115.03 | 0.43 | |
| 191.95 | -103.53 | 0.39 | |
| 192.54 | -112.27 | 0.47 | |
| 193.86 | -113.98 | 0.63 | |
| 194.59 | -100.98 | 0.82 | |
| 195.71 | -111.44 | 0.83 |
Weekly focal plane temperature with sun angle, earth angle, and altitude overplotted. Sun angle is the solar array angle, that is the angle between the sun and the optical axis (+X axis). The earth angle is the angle between earth and the ACIS radiator (+Z axis). Altitude varies from 34 kkm to 128 kkm.
SIM Movements
11 TSC moves this period
| weekly average time/step | 0.00133 s |
|---|---|
| mission average time/step | 0.00132 s |
Telemetry
New violations or new extrema are shown in blue cells.
| MSID | 07/09/21 | 07/10/21 | 07/11/21 | 07/12/21 | 07/13/21 | 07/14/21 | 07/15/21 | yellow limits (lower) upper | red limits (lower) upper | Units | Description |
| TCM_TX1 | (268.43) | (267.70) | (266.61) | (266.97) | (266.97) | (266.97) | (283.15) 348.15 |
(269.15) 404.15 |
K | TRANSPONDER-1 EXT BPL TEMP | |
| SPHVLV | (45.00) | (72.0) 128.0 |
(71.0) 129.0 |
(2SPHVLV) | Spect Bot MCP HV Monitor | ||||||
| MZOBACONE | 308.59 | (260.2) 303.0 |
(250.2) 308.0 |
CONE | -Z SIDE OBA CONE | ||||||
| OBAAVG | 302.15 | (282.5) 300.0 |
(281.4) 301.0 |
K | OBA/TFTE TEMP | ||||||
| TCM_PA2 | (260.05) | (259.69) | (259.69) | (259.69) | (269.15) 348.15 |
(260.15) 413.15 |
K | RF POWER AMP-2 EXT BPL TEMP | |||
| AWD6TQI | (-3.47) | (-1.22) 1.22 |
(-3.3) 3.3 |
AMP | WHEEL 6 TORQUE CURRENT | ||||||
| HRMACAV | 295.60 | (293.4) 294.8 |
(292.8) 295.5 |
TEMP | HRMA CAVITY AVG TEMP | ||||||
| OBACONEAVG | 301.80 | 302.35 | 302.79 | 305.95 | 304.51 | 303.35 | 303.61 | (282.5) 300.0 |
(281.8) 301.0 |
K | OBA CONE AVG TEMP |
| OBADIAGRAD | 4.09 | 4.24 | 4.10 | 4.08 | 4.27 | 4.26 | 4.16 | (-1.11) 3.5 |
(-2.78) 3.9 |
K | OBA DIAM GRAD |
| PRBSCR | (-8.65) | (1.24) 1.92 |
(0.9) 2.26 |
AMP | Primary Bus Current | ||||||
| AWD1TQI | (-3.35) | (-1.22) 1.22 |
(-3.3) 3.3 |
AMP | WHEEL 1 TORQUE CURRENT | ||||||
| TSCTSF3 | (268.06) | (267.33) | (278.15) 359.15 |
(269.15) 483.15 |
K | SC-TS FITTING -3 TEMP | |||||
| TCM_PA1 | (260.05) | (258.96) | (258.56) | (258.56) | (258.56) | (269.15) 348.15 |
(260.15) 413.15 |
K | RF POWER AMP-1 EXT BPL TEMP | ||
| SPHBLV | (78.00) | (79.0) 128.0 |
(78.0) 129.0 |
(2SPHBLV) | Spect Bot & Top MCP HV Monitor |
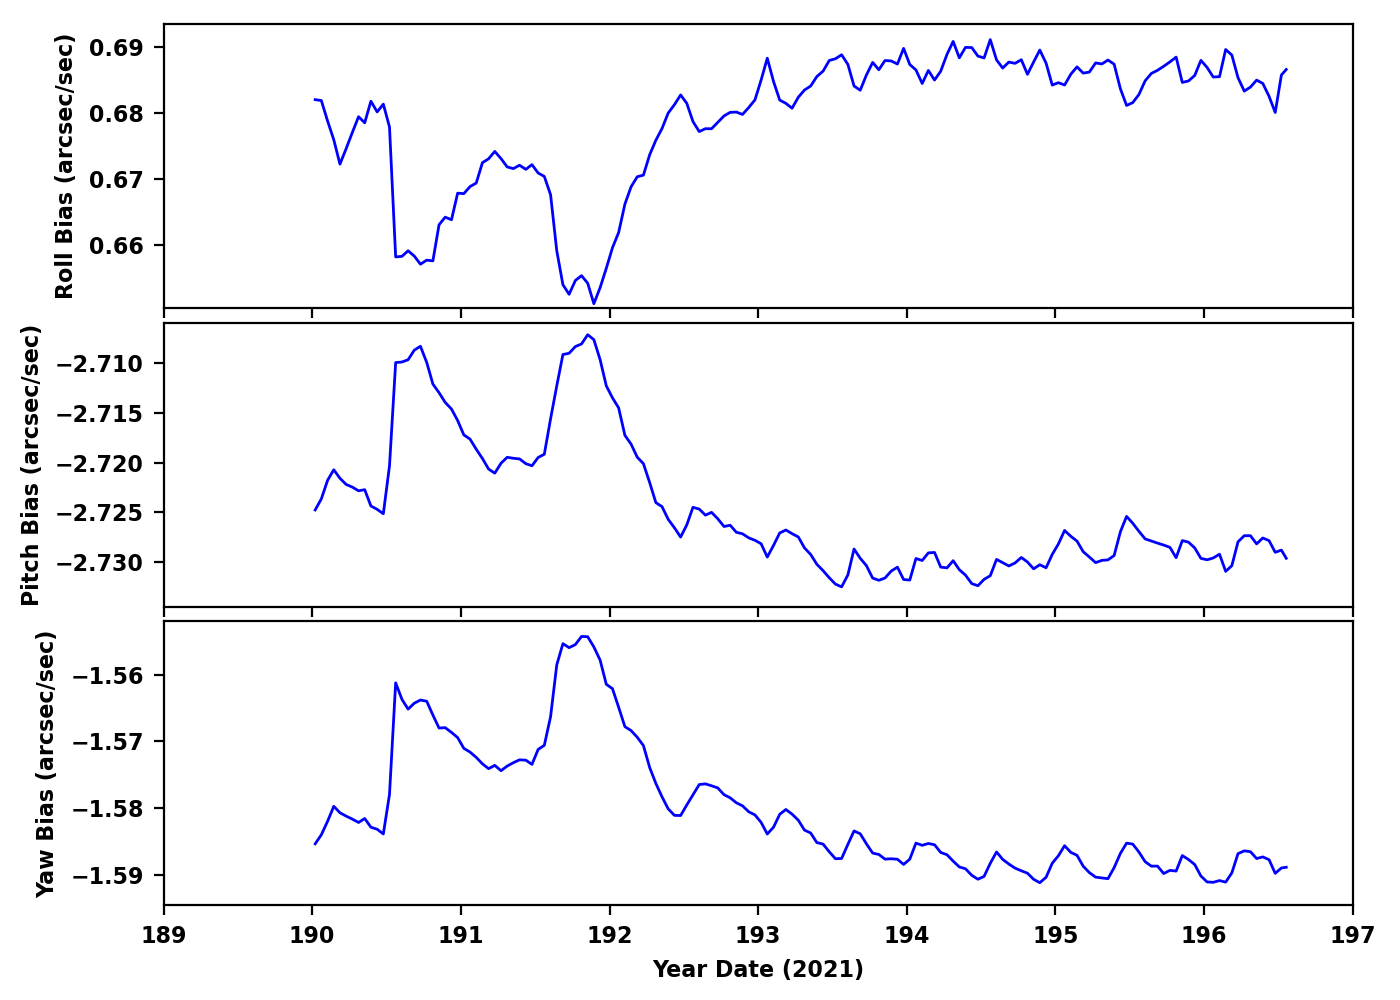
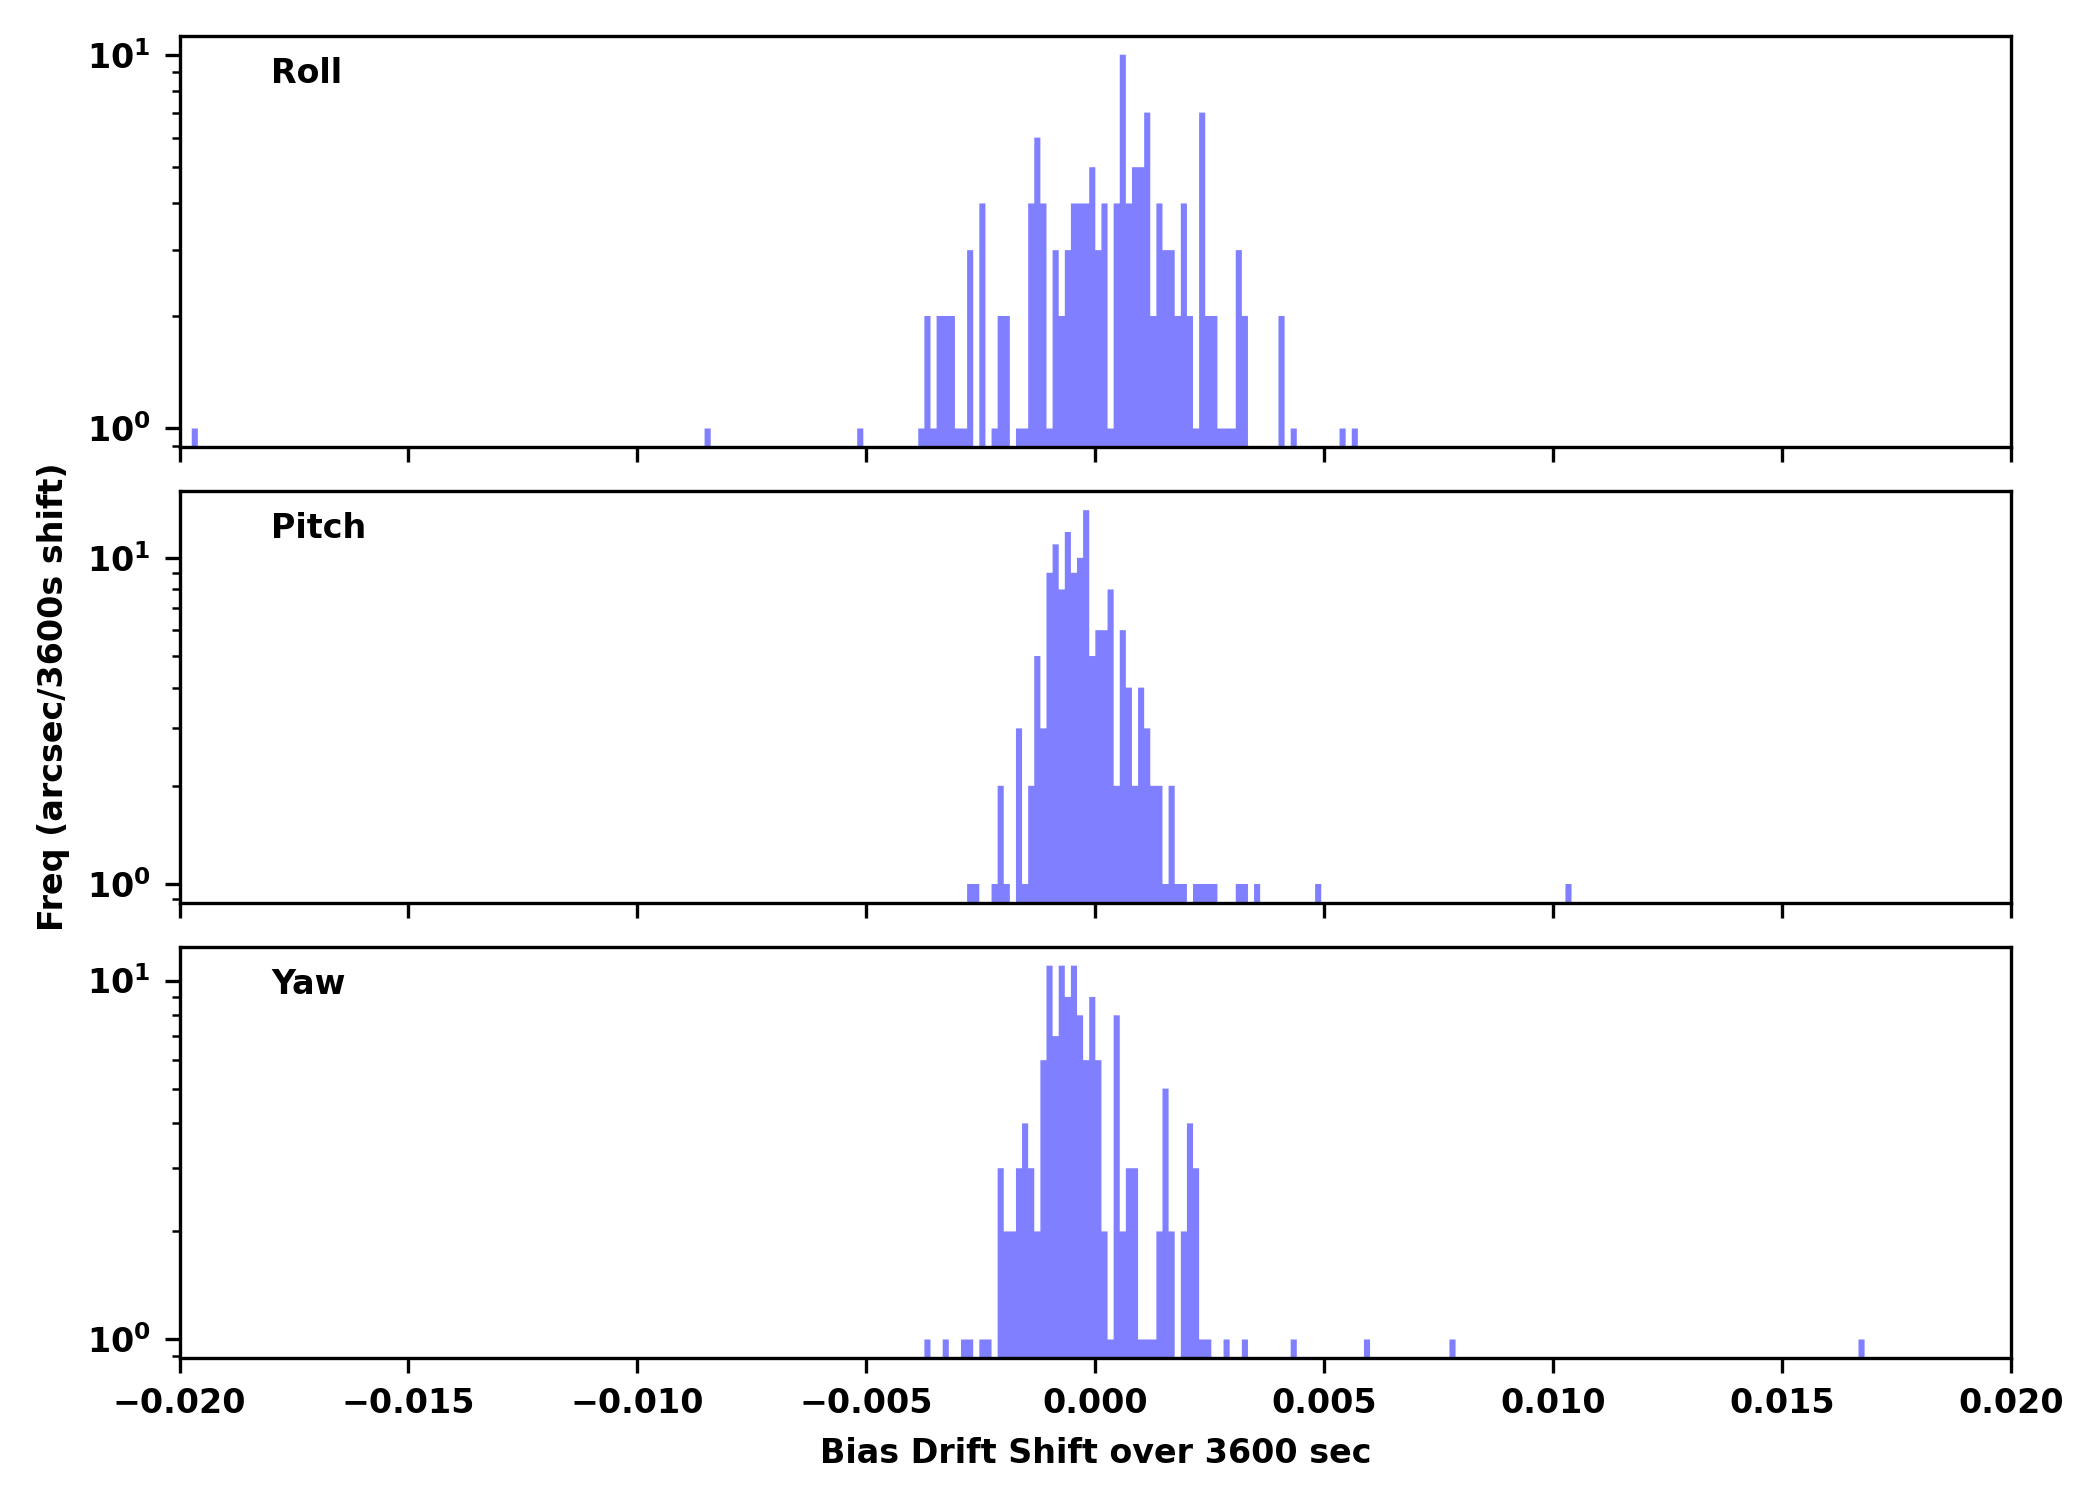
IRUs
| Gyro Bias Drift | Gyro Bias Drift Histogram |
|---|---|
|
|
Recent Observations
| OBSID | DETECTOR | GRATING | TARGET | ANALYSIS | ACA |
|---|---|---|---|---|---|
| 23490 | ACIS-235678 | NONE | NGC 4485/90 | OK | OK |
| 23866 | ACIS-7 | NONE | PSR J1852+0040 | CC | OK |
| 25085 | ACIS-7 | NONE | PSR J1852+0040 | CC | OK |
| 25083 | ACIS-678 | NONE | NGC2336-N | OK | OK |
| 25084 | ACIS-5678 | NONE | NGC2336-S | OK | OK |
| 23586 | ACIS-01237 | NONE | 4FGL J1736.1-3422 | OK | OK |
| 25089 | HRC-S | NONE | TCP J18573095+1653396 | OK | OK |
| 23782 | ACIS-7 | NONE | QSOJ1131-1231 | OK | OK |
| 23914 | ACIS-0123 | NONE | GDH7 | OK | OK |
| 23915 | ACIS-0123 | NONE | GDH7 | OK | OK |
| 23917 | ACIS-0123 | NONE | GDH7 | OK | OK |
| 23916 | ACIS-0123 | NONE | GDH7 | OK | OK |
| 23918 | ACIS-0123 | NONE | GDH7 | OK | OK |
| 22959 | HRC-S | LETG | PSR J0821-4300 | OK/NA | OK |
| 22945 | HRC-S | LETG | H1821+643 | OK/NA | OK |
| 23456 | ACIS-7 | NONE | MAXI J1848-015 | OK | OK |
| 25087 | ACIS-0123 | NONE | CIZAJ1809.0-0414 | OK | OK |
| 23329 | ACIS-456789 | HETG | mrk 817 | OK/NA | OK |
| 25088 | ACIS-0123 | NONE | HEP G029.280+11.269 | OK | OK |
| 23480 | ACIS-235678 | NONE | M51 | OK | OK |
| 23435 | ACIS-5678 | HETG | GRS 1915+105 | OK/NA | OK |
| 24332 | ACIS-456789 | HETG | mrk 817 | OK/NA | OK |
| 24291 | ACIS-7 | NONE | hete j1900.1-2455 | OK | OK |
| 24733 | ACIS-0123 | NONE | Antlia Cluster SE | Missing | Missing |
| 24663 | ACIS-5678 | HETG | GRS 1915+105 | Missing/NA | Missing |
Trending
This week's focus is PCAD
Last reported on
Apr 29.
Only the most interesting or representative msids are shown below.
For a full listing choose the bulletted link.
| MSID | Mean | RMS | Delta/Yr | Delta/Yr/Yr | Unit | Description | |
|---|---|---|---|---|---|---|---|
| afsspc2v | on | 0.008 | 0.001 | 3.51 +/- 0.18 | (9.14+/-13.53)e-5 | V | FSS POWER CONV 2 VOLTAGE | off | 5.659e-04 | 5.345e-04 | 0.01 +/- 0.14 | (0.00+/-0.00)e0 |
| airu2g1i | on | -0.310 | 0.014 | (1.03+/-0.06)e2 | -0.05 +/- 0.04 | mA | IRU-2 GYRO | off | -0.401 | 0.101 | 9.74 +/- 4.56 | -0.17 +/- 0.37 |
| airu2g2i | on | -0.385 | 0.058 | (1.03+/-0.26)e2 | 0.30 +/- 0.07 | mA | IRU-2 GYRO | off | -0.401 | 0.103 | 9.74 +/- 4.65 | -0.12 +/- 0.33 |
| airu2g2t | on | -0.289 | 0.014 | (3.41+/-0.06)e2 | (1.41+/-21.47)e-4 | K | IRU-2 GYRO | off | -0.191 | 0.060 | (2.93+/-0.03)e2 | -0.03 +/- 0.02 |
| MSID | Mean | RMS | Delta/Yr | Delta/Yr/Yr | Unit | Description | |
|---|---|---|---|---|---|---|---|
| aogyrct1 | -0.363 | 1.465 | 15.63 +/- 862.74 | -28.77 +/- 15.09 | CNTS | ACCUMULATED GYRO PULSE COUNTS FROM OBC SELECTED GYRO 1 | |
| aogyrct2 | 0.514 | 1.687 | 25.43 +/- 993.46 | -4.22 +/- 13.43 | CNTS | ACCUMULATED GYRO PULSE COUNTS FROM OBC SELECTED GYRO 2 | |
| aogyrct3 | 3.515 | 4.671 | -27.22 +/- 2751.24 | 2.52 +/- 55.72 | CNTS | ACCUMULATED GYRO PULSE COUNTS FROM OBC SELECTED GYRO 3 | |
| aogyrct4 | 0.143 | 1.647 | -33.98 +/- 970.00 | -0.54 +/- 8.47 | CNTS | ACCUMULATED GYRO PULSE COUNTS FROM OBC SELECTED GYRO 4 |
If you have any questions, please contact: swolk@head.cfa.harvard.edu