| CCD0 | CCD1 | CCD2 | CCD3 | CCD4 | CCD5 | CCD6 | CCD7 | CCD8 | CCD9 | |
|---|---|---|---|---|---|---|---|---|---|---|
| Previously Unknown Bad Pixels | ||||||||||
| Current Warm Pixels | (670,387) | (335,412) | ||||||||
| Flickering Warm Pixels | (143,700) (154,9) (692,141) | (910,239) (802,665) (427,125) | (726,537) (526,66) (178,149) (803,225) (919,71) | (680,391) (811,637) (21,95) | (419,163) (879,121) (758,244) | (258,797) (233,227) (669,577) (341,427) (282,385) (233,102) (263,317) (161,206) (369,376) (607,281) (357,303) | (1000,214) (287,164) (884,31) | (182,474) (197,241) (675,304) (881,53) (275,393) (220,813) (332,324) (136,65) (139,109) | (636,819) (150,374) (749,477) (40,49) (675,52) | |
| Current Hot Pixels | ||||||||||
| Flickering Hot Pixels | ||||||||||
| Warm column candidates | 510 1022 512 | 512 1022 | ||||||||
| Flickering Warm column candidates |
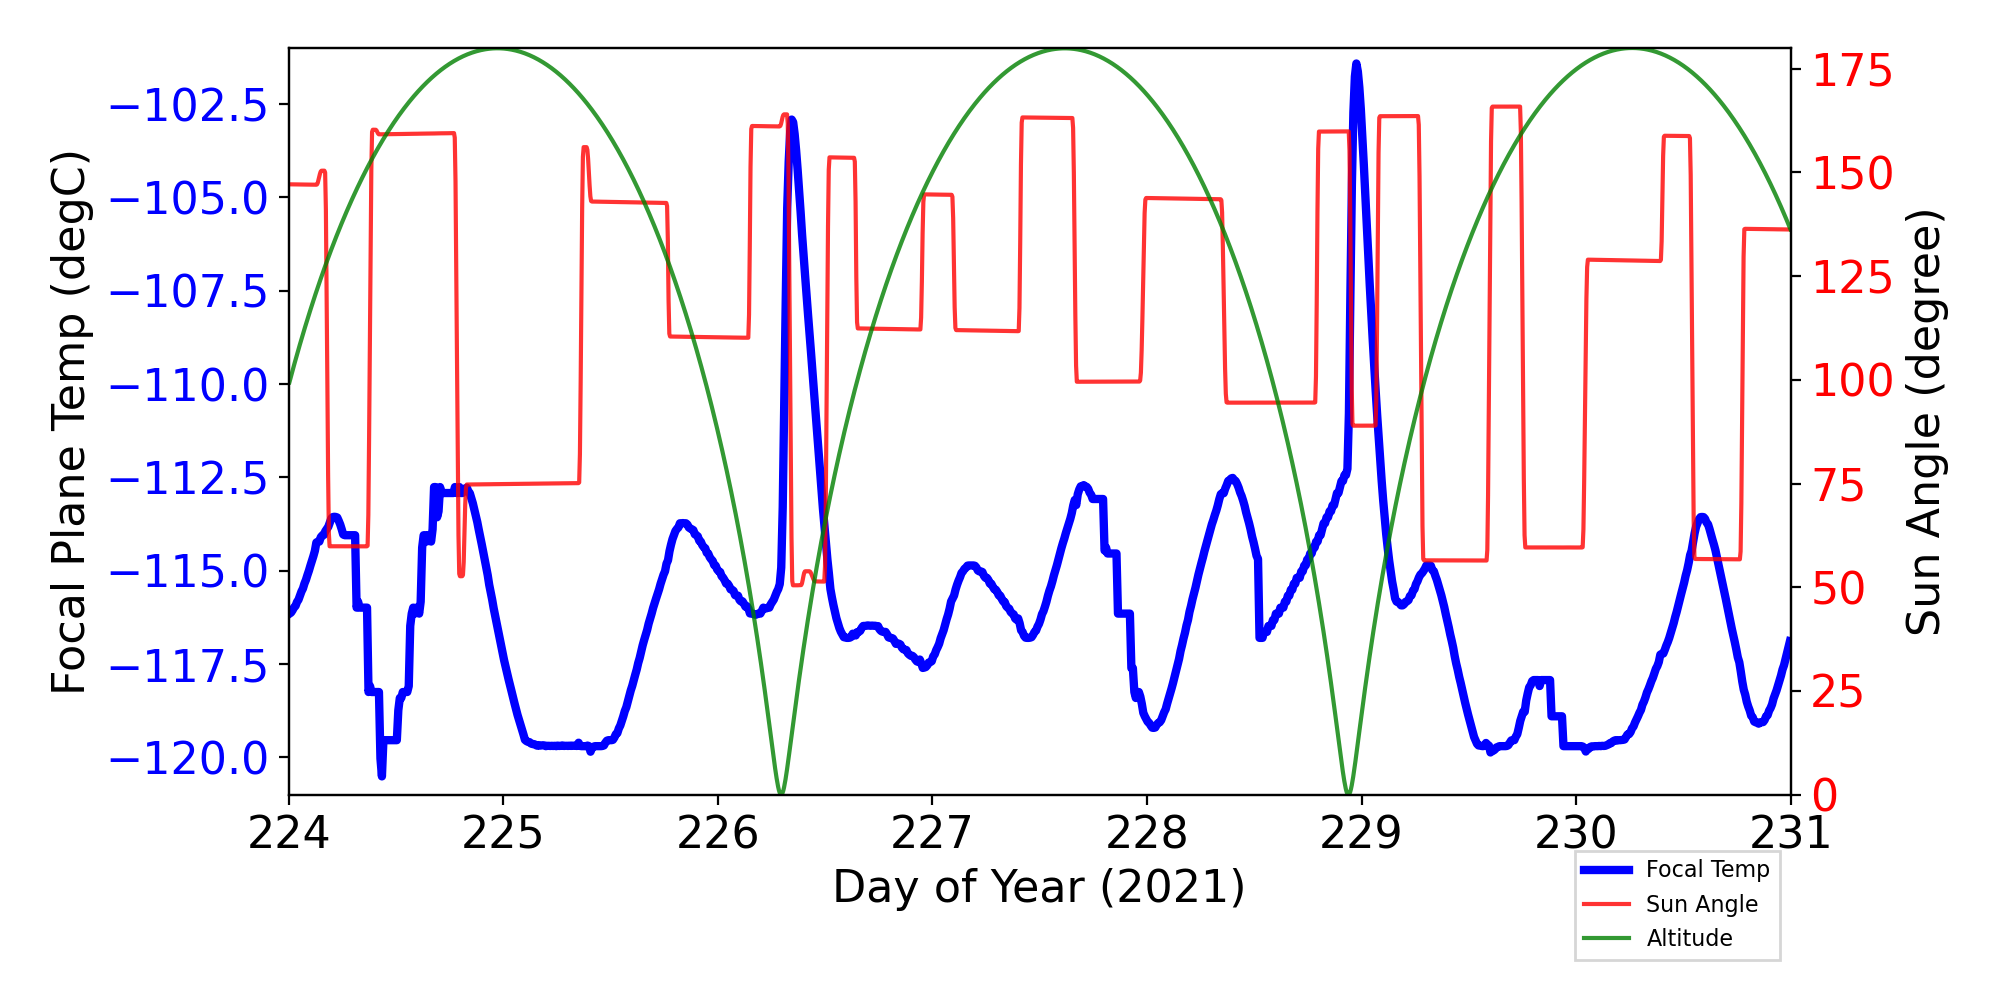
ACIS Focal Plane Temperature
For this period, 12 peaks are observed.
| Day (DOY) | Temp (C) | Width (Days) | |
|---|---|---|---|
| 224.22 | -113.56 | 0.33 | |
| 224.84 | -112.87 | 0.53 | |
| 225.84 | -113.73 | 0.63 | |
| 226.35 | -102.99 | 0.38 | |
| 226.70 | -116.47 | 0.20 | |
| 227.20 | -114.87 | 0.29 | |
| 227.71 | -112.75 | 0.42 | |
| 228.41 | -112.58 | 0.49 | |
| 228.98 | -101.63 | 0.66 | |
| 229.32 | -114.87 | 0.38 | |
| 229.83 | -118.09 | 0.12 | |
| 230.59 | -113.56 | 0.66 |
Weekly focal plane temperature with sun angle, earth angle, and altitude overplotted. Sun angle is the solar array angle, that is the angle between the sun and the optical axis (+X axis). The earth angle is the angle between earth and the ACIS radiator (+Z axis). Altitude varies from 34 kkm to 128 kkm.
SIM Movements
11 TSC moves this period
| weekly average time/step | 0.00135 s |
|---|---|
| mission average time/step | 0.00132 s |
Telemetry
New violations or new extrema are shown in blue cells.
| MSID | 08/13/21 | 08/14/21 | 08/15/21 | 08/16/21 | 08/17/21 | 08/18/21 | 08/19/21 | yellow limits (lower) upper | red limits (lower) upper | Units | Description |
| SPHBLV | (67.00) | (72.00) | (79.0) 128.0 |
(78.0) 129.0 |
(2SPHBLV) | Spect Bot & Top MCP HV Monitor | |||||
| OBADIAGRAD | 4.46 | 3.94 | 3.94 | 3.91 | 4.11 | (-1.11) 3.5 |
(-2.78) 3.9 |
K | OBA DIAM GRAD | ||
| TCM_TX1 | (266.97) | (267.70) | (267.33) | (266.61) | (267.33) | (267.70) | (283.15) 348.15 |
(269.15) 404.15 |
K | TRANSPONDER-1 EXT BPL TEMP | |
| TCM_PA1 | (259.32) | (260.05) | (259.32) | (258.16) | (258.96) | (259.69) | (269.15) 348.15 |
(260.15) 413.15 |
K | RF POWER AMP-1 EXT BPL TEMP | |
| TEP_PSU2 | (264.06) | (283.15) 343.15 |
(264.15) 393.15 |
K | PSU-2 TEMP | ||||||
| OBACONEAVG | 302.56 | 303.46 | 304.22 | 304.21 | 301.87 | 304.31 | (282.5) 300.0 |
(281.8) 301.0 |
K | OBA CONE AVG TEMP | |
| OBAAVG | 301.62 | (282.5) 300.0 |
(281.4) 301.0 |
K | OBA/TFTE TEMP | ||||||
| TCM_PA2 | (260.05) | (259.32) | (260.05) | (269.15) 348.15 |
(260.15) 413.15 |
K | RF POWER AMP-2 EXT BPL TEMP | ||||
| HRMACAV | 295.65 | (293.4) 294.8 |
(292.8) 295.5 |
TEMP | HRMA CAVITY AVG TEMP | ||||||
| CTXBPWR | (0.00) | (36.12) 37.0 |
(36.0) 38.0 |
DBM | TRANSMITTER B OUTPUT POWER | ||||||
| AWD1TQI | (-3.39) | (-3.39) | (-1.22) 1.22 |
(-3.3) 3.3 |
AMP | WHEEL 1 TORQUE CURRENT |
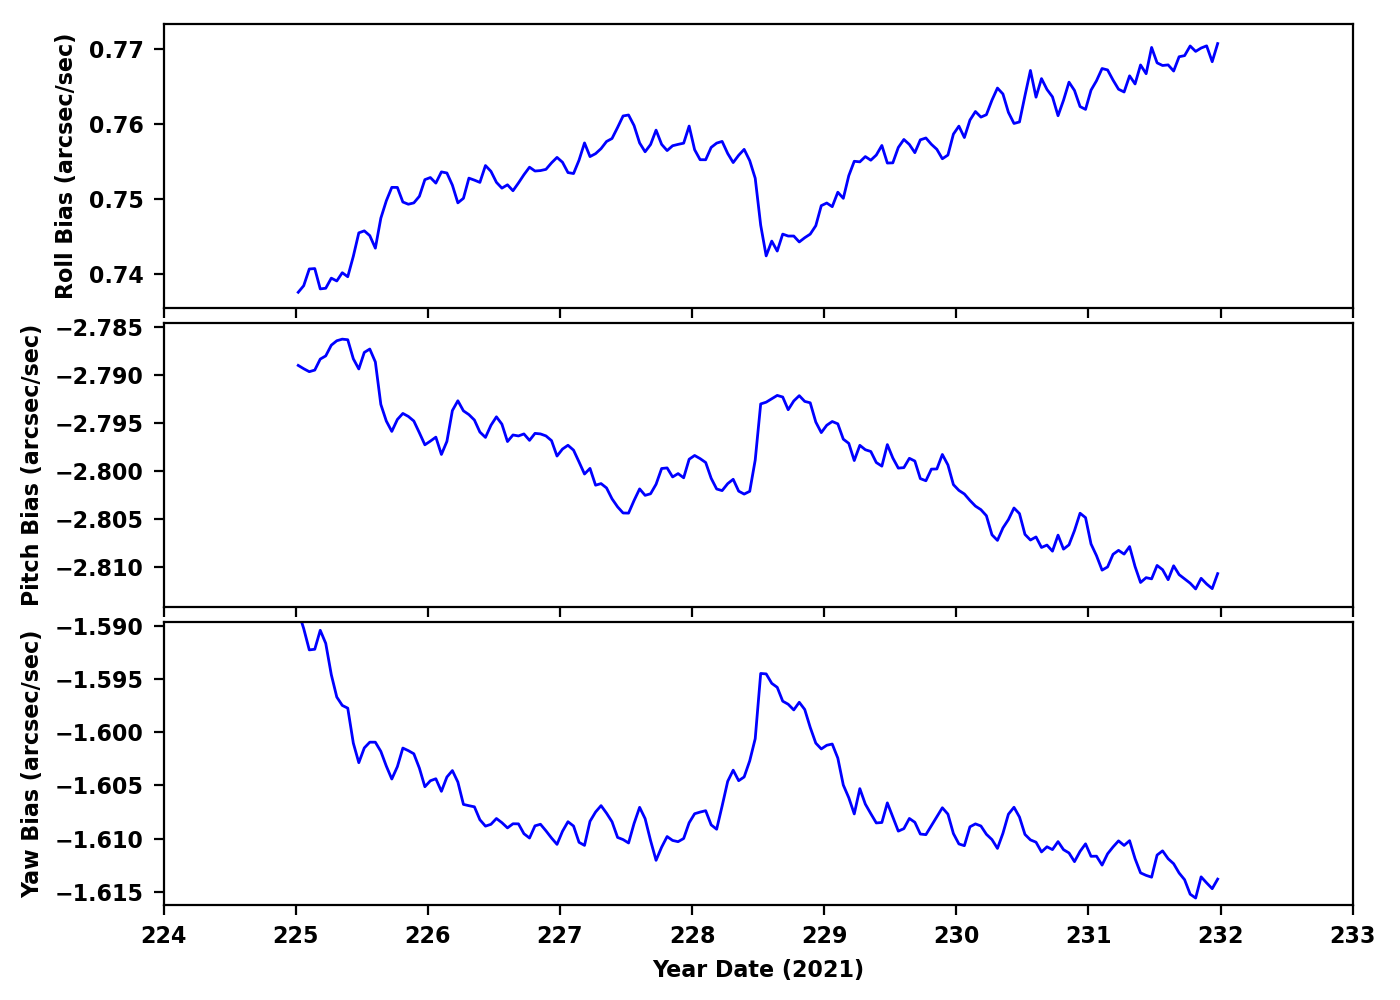
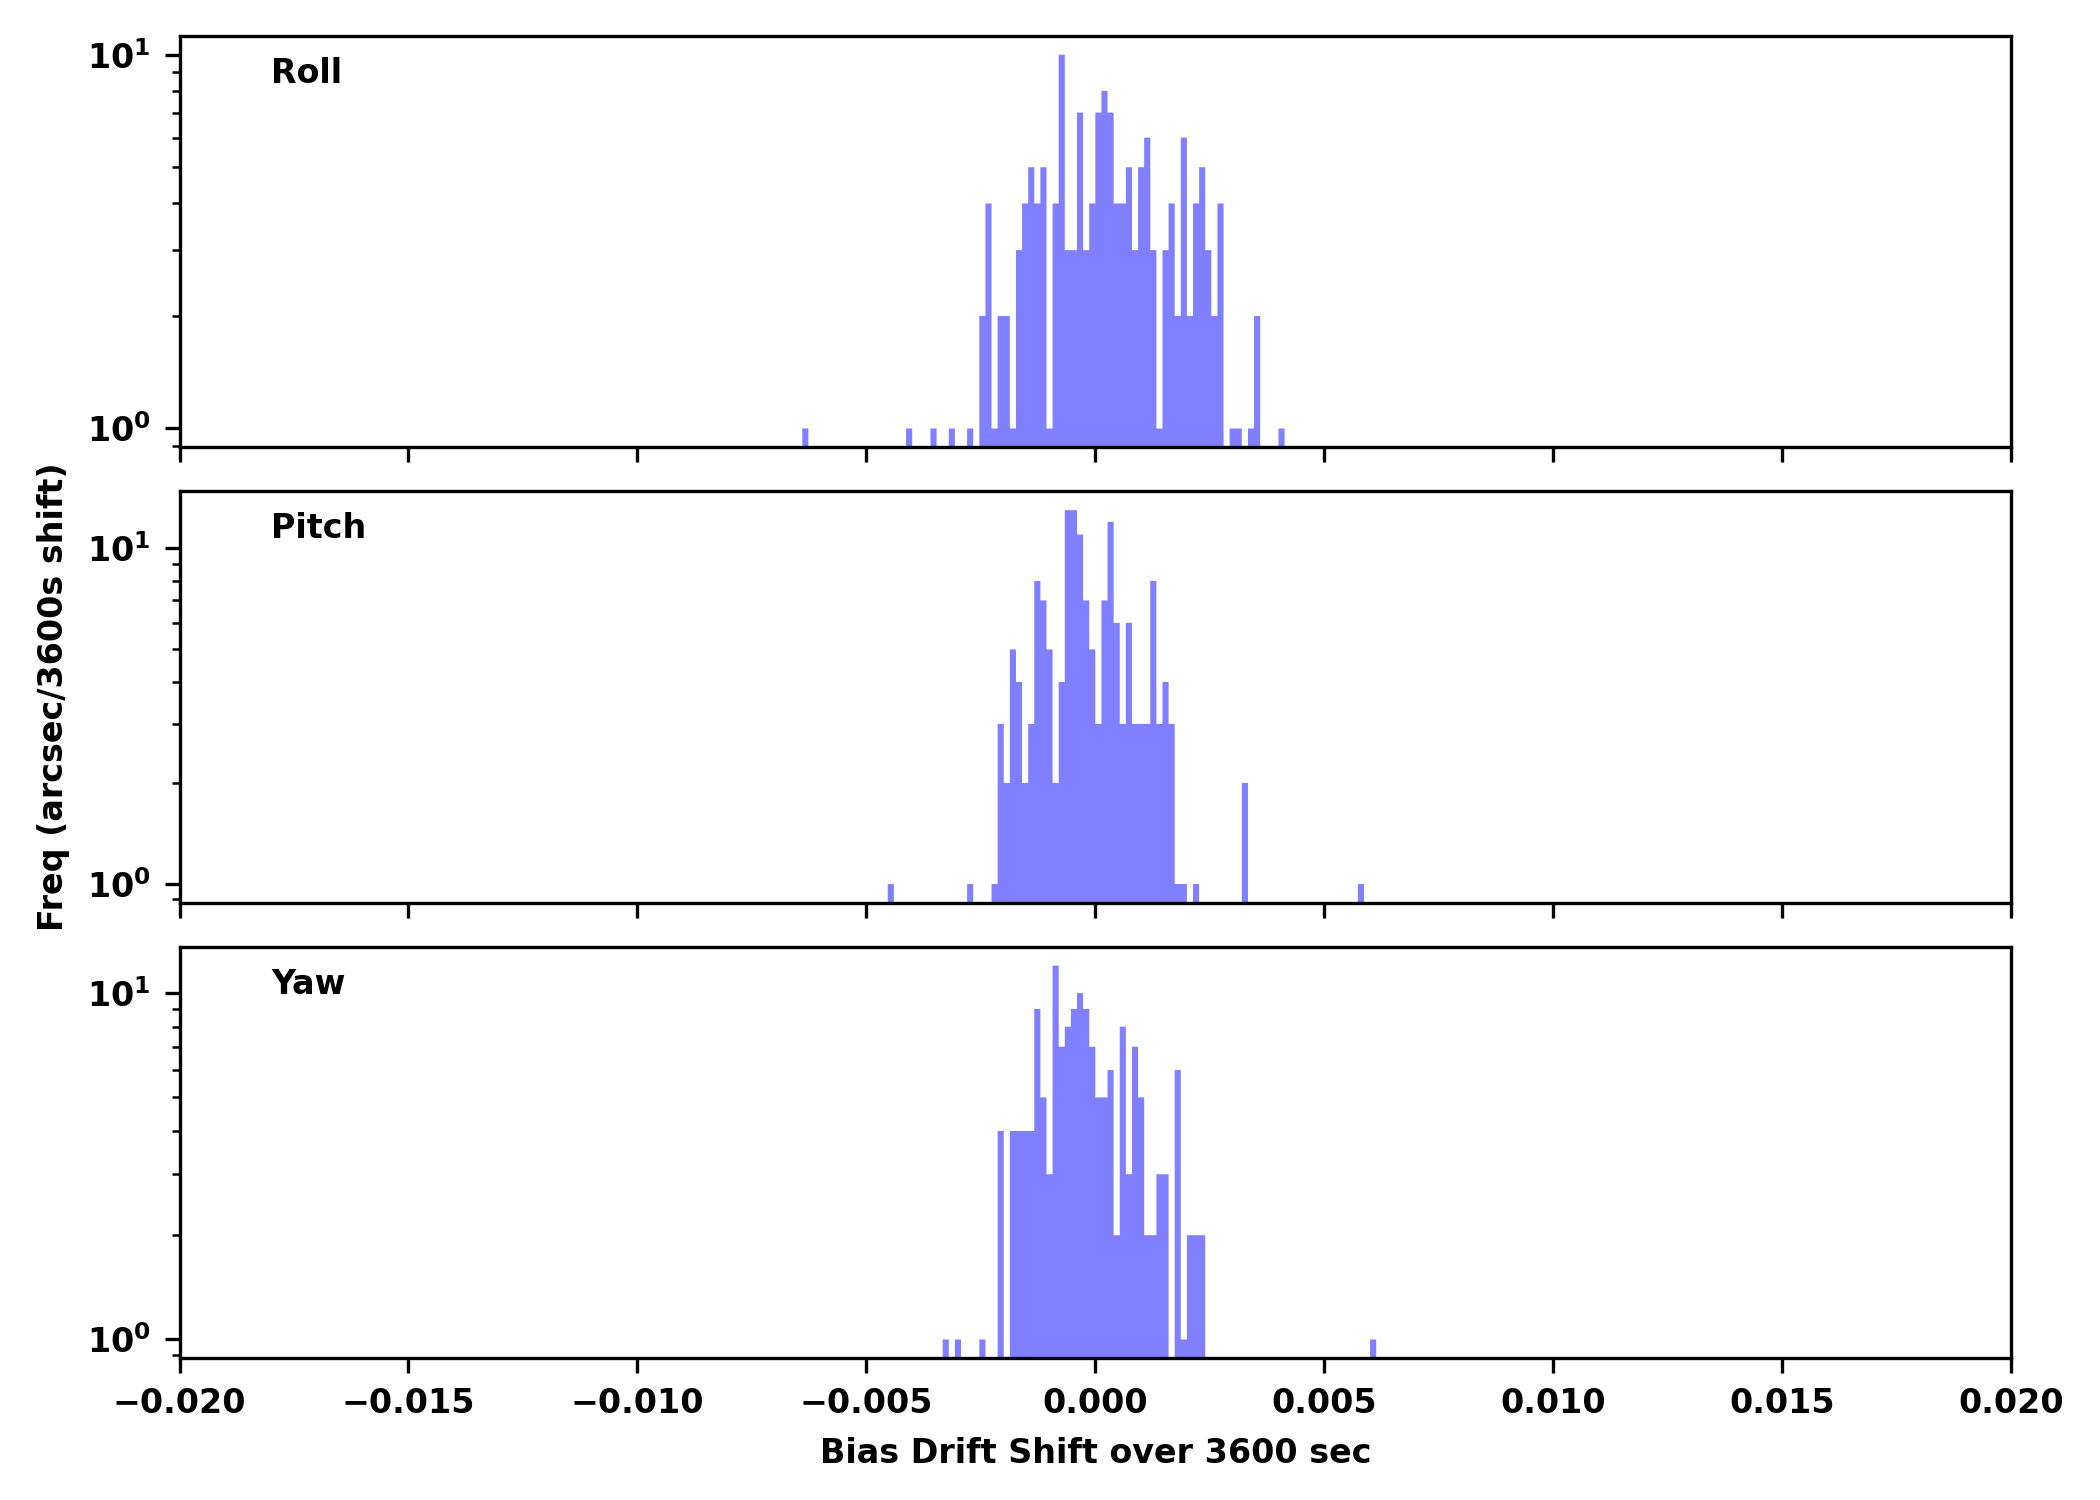
IRUs
| Gyro Bias Drift | Gyro Bias Drift Histogram |
|---|---|
|
|
Recent Observations
| OBSID | DETECTOR | GRATING | TARGET | ANALYSIS | ACA |
|---|---|---|---|---|---|
| 22481 | ACIS-012367 | NONE | IC342 SW | OK | OK |
| 22700 | ACIS-456789 | HETG | IGR J16318-4848 | OK/NA | OK |
| 22317 | ACIS-0123 | NONE | Westerlund 1 | OK | OK |
| 23481 | ACIS-235678 | NONE | M51 | OK | OK |
| 22640 | ACIS-23567 | NONE | PSZ2 G126.57+51.61 | OK | OK |
Trending
This week's focus is Gratings
Last reported on
Jun 03.
Only the most interesting or representative msids are shown below.
For a full listing choose the bulletted link.
| MSID | Mean | RMS | Delta/Yr | Delta/Yr/Yr | Unit | Description | |
|---|---|---|---|---|---|---|---|
| 4hposaro | -0.022 | 0.034 | 68.47 +/- 19.92 | 1.23 +/- 0.96 | na | NA | |
| 4hposbro | -0.017 | 0.034 | 69.06 +/- 20.14 | 1.24 +/- 0.97 | na | NA | |
| 4lposaro | 0.018 | 0.022 | 73.83 +/- 12.84 | 0.41 +/- 0.57 | na | NA | |
| 4lposbro | 0.027 | 0.022 | 72.90 +/- 13.20 | 0.51 +/- 0.58 | na | NA | |
| 4mp28av | 0.011 | 0.001 | 0.38 +/- 0.73 | 0.01 +/- 0.03 | V | MCE A: +28 VOLT MONITOR | |
| 4mp28bv | 0.067 | 0.005 | 1.88 +/- 3.06 | 0.06 +/- 0.13 | V | MCE B: +28 VOLT MONITOR | |
| 4mp5av | 0.016 | 0.001 | 0.45 +/- 0.74 | 0.01 +/- 0.03 | V | MCE A: +5 VOLT MONITOR | |
| 4mp5bv | 0.012 | 9.287e-04 | 0.34 +/- 0.56 | 0.01 +/- 0.02 | V | MCE B: +5 VOLT MONITOR |
If you have any questions, please contact: swolk@head.cfa.harvard.edu