| CCD0 | CCD1 | CCD2 | CCD3 | CCD4 | CCD5 | CCD6 | CCD7 | CCD8 | CCD9 | |
|---|---|---|---|---|---|---|---|---|---|---|
| Previously Unknown Bad Pixels | ||||||||||
| Current Warm Pixels | (803,225) (526,66) | (21,95) | (233,227) (282,385) (161,206) (369,376) | (335,412) | (597,187) (838,239) (881,53) (275,393) | |||||
| Flickering Warm Pixels | (798,494) | (910,239) (802,665) (36,614) (985,393) (427,125) (787,181) | (104,31) (665,25) (726,537) (353,201) (837,378) (178,149) | (811,637) (318,53) | (367,511) (258,797) (439,452) (270,726) (641,669) (877,408) (357,303) (263,317) (166,738) (233,429) (728,340) (669,577) (226,564) (233,102) (383,586) (554,484) | (1000,214) (670,387) (849,169) (884,31) | (220,813) (130,26) (447,769) (136,65) (332,324) (666,165) (295,978) (139,109) (893,490) (675,304) (182,474) | (675,52) | ||
| Current Hot Pixels | ||||||||||
| Flickering Hot Pixels | ||||||||||
| Warm column candidates | 1022 512 510 | 1022 512 | ||||||||
| Flickering Warm column candidates |
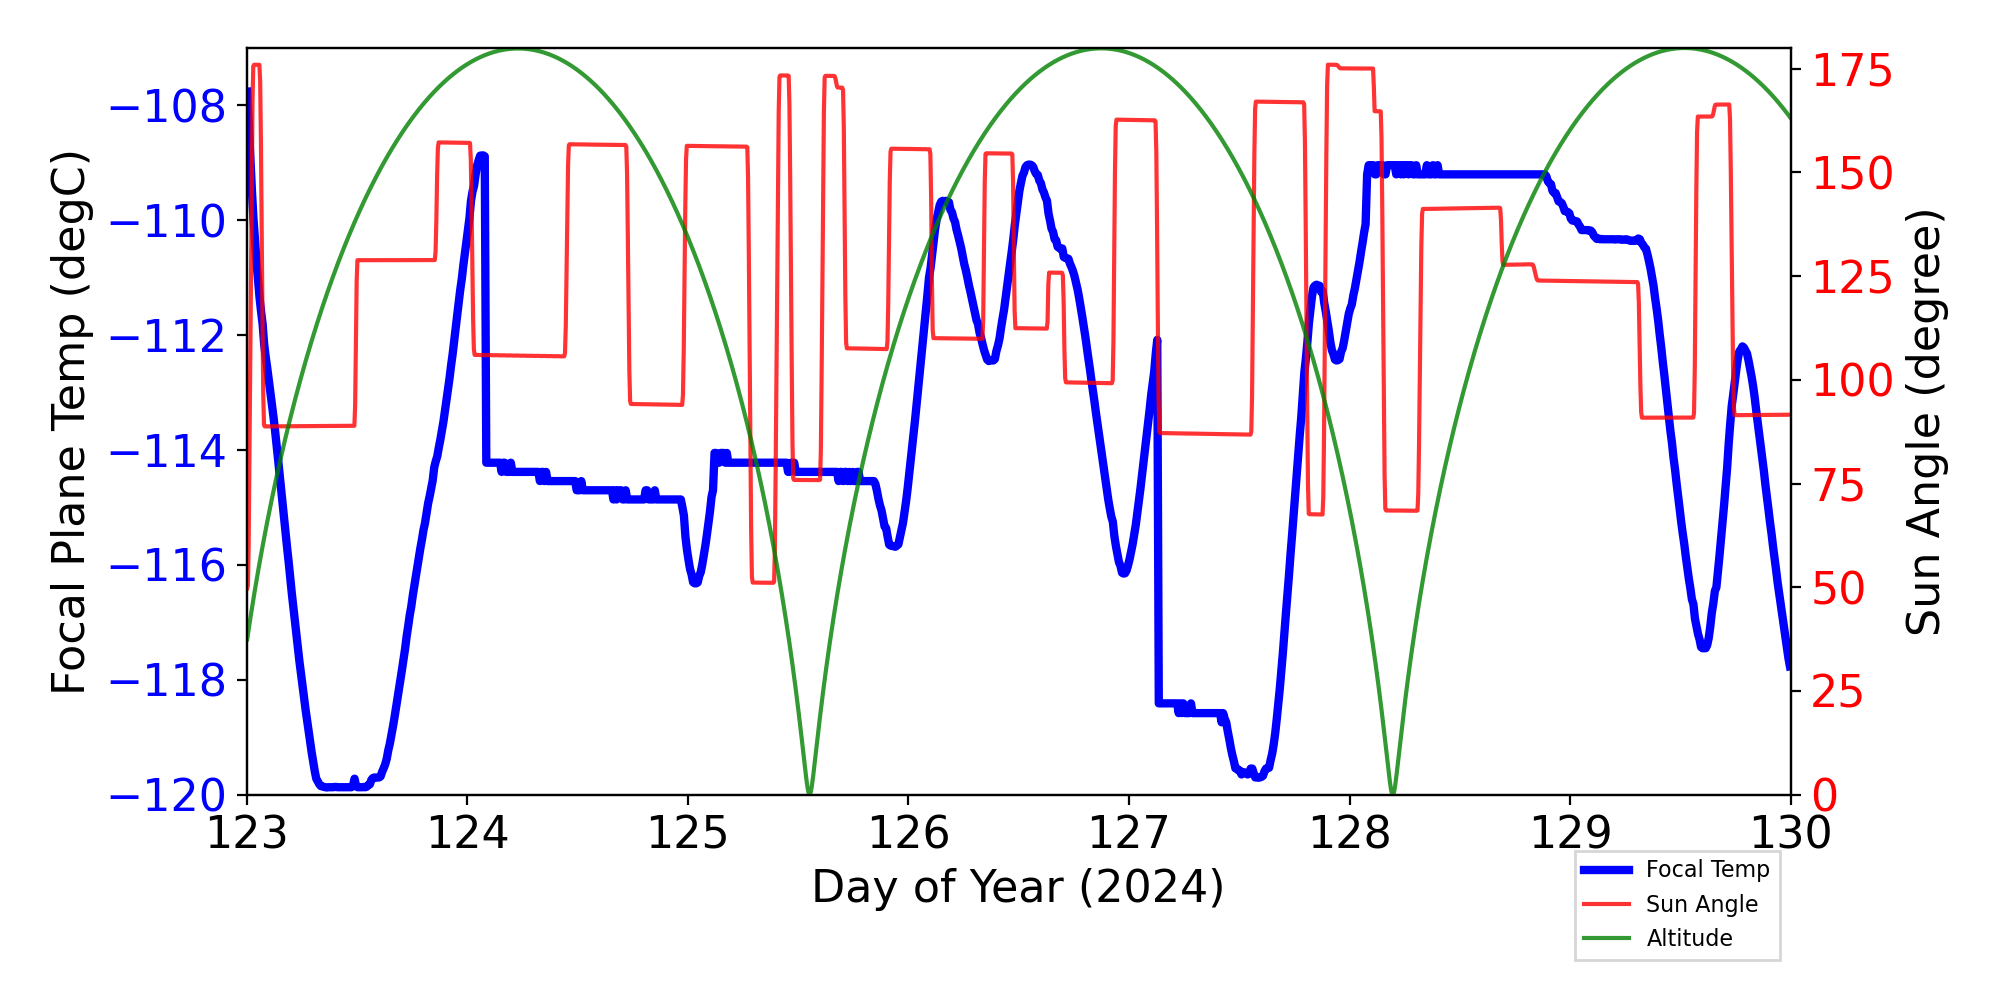
ACIS Focal Plane Temperature
For this period, 4 peaks are observed.
| Day (DOY) | Temp (C) | Width (Days) | |
|---|---|---|---|
| 124.08 | -108.89 | 1.44 | |
| 125.14 | -114.22 | 0.91 | |
| 126.56 | -109.04 | 1.03 | |
| 128.11 | -109.20 | 2.01 |
Weekly focal plane temperature with sun angle, earth angle, and altitude overplotted. Sun angle is the solar array angle, that is the angle between the sun and the optical axis (+X axis). The earth angle is the angle between earth and the ACIS radiator (+Z axis). Altitude varies from 34 kkm to 128 kkm.
SIM Movements
12 TSC moves this period
| weekly average time/step | 0.00129 s |
|---|---|
| mission average time/step | 0.00132 s |
Telemetry
New violations or new extrema are shown in blue cells.
| MSID | 05/03/24 | 05/04/24 | 05/05/24 | 05/06/24 | 05/07/24 | 05/08/24 | 05/09/24 | yellow limits (lower) upper | red limits (lower) upper | Units | Description |
| AWD1TQI | (-3.39) | (-3.39) | (-3.39) | (-1.22) 1.22 |
(-3.3) 3.3 |
AMP | WHEEL 1 TORQUE CURRENT | ||||
| AWD3TQI | (-3.35) | (-1.22) 1.22 |
(-3.3) 3.3 |
AMP | WHEEL 3 TORQUE CURRENT | ||||||
| AWD6TQI | (-3.35) | (-3.35) | (-3.47) | (-1.22) 1.22 |
(-3.3) 3.3 |
AMP | WHEEL 6 TORQUE CURRENT | ||||
| CALPALV | (120.00) | (126.0) 128.0 |
(125.0) 129.0 |
V | Cal Pulser Amplitude | ||||||
| CTXBPWR | (0.00) | (0.00) | (0.00) | (0.00) | (0.00) | (0.00) | (0.00) | (36.12) 37.0 |
(36.0) 38.0 |
DBM | TRANSMITTER B OUTPUT POWER |
| MZOBACONE | 312.61 | 309.79 | 311.74 | 312.96 | 312.11 | 312.09 | (260.2) 303.0 |
(250.2) 308.0 |
CONE | -Z SIDE OBA CONE | |
| OBAAVG | 304.43 | 302.96 | 303.51 | 304.28 | 303.67 | 303.65 | (282.5) 300.0 |
(281.4) 301.0 |
K | OBA/TFTE TEMP | |
| OBACONEAVG | 304.78 | 309.21 | (282.5) 300.0 |
(281.8) 301.0 |
K | OBA CONE AVG TEMP | |||||
| OBADIAGRAD | 4.49 | 4.42 | 4.29 | 4.66 | 4.53 | 4.58 | 4.61 | (-1.11) 3.5 |
(-2.78) 3.9 |
K | OBA DIAM GRAD |
| PZOBACONE | 308.69 | 308.72 | (260.2) 303.0 |
(250.2) 308.0 |
CONE | +Z SIDE OBA CONE | |||||
| SPHBLV | (77.00) | (0.00) | (71.00) | (79.0) 128.0 |
(78.0) 129.0 |
(2SPHBLV) | Spect Bot & Top MCP HV Monitor | ||||
| SPHVLV | (0.00) | (70.00) | (72.0) 128.0 |
(71.0) 129.0 |
(2SPHVLV) | Spect Bot MCP HV Monitor | |||||
| SPINATM | (-117.76) | (-12.0) 35.0 |
(-15.0) 40.0 |
C | Spect Det Temperature | ||||||
| TCM_PA1 | (260.05) | (259.32) | (259.69) | (258.96) | (259.32) | (269.15) 348.15 |
(260.15) 413.15 |
K | RF POWER AMP-1 EXT BPL TEMP | ||
| TCM_PA2 | (260.05) | (269.15) 348.15 |
(260.15) 413.15 |
K | RF POWER AMP-2 EXT BPL TEMP | ||||||
| TCM_TX1 | (268.43) | (268.43) | (267.70) | (268.43) | (266.97) | (267.33) | (283.15) 348.15 |
(269.15) 404.15 |
K | TRANSPONDER-1 EXT BPL TEMP | |
| TFTERANGE | 47.71 | 47.47 | 47.87 | 47.33 | (16.7) 37.5 |
(11.1) 45.0 |
K | TFTE VENT/RAD TEMP | |||
| TSCTSF3 | (268.43) | (268.43) | (267.33) | (266.97) | (268.06) | (278.15) 359.15 |
(269.15) 483.15 |
K | SC-TS FITTING -3 TEMP |
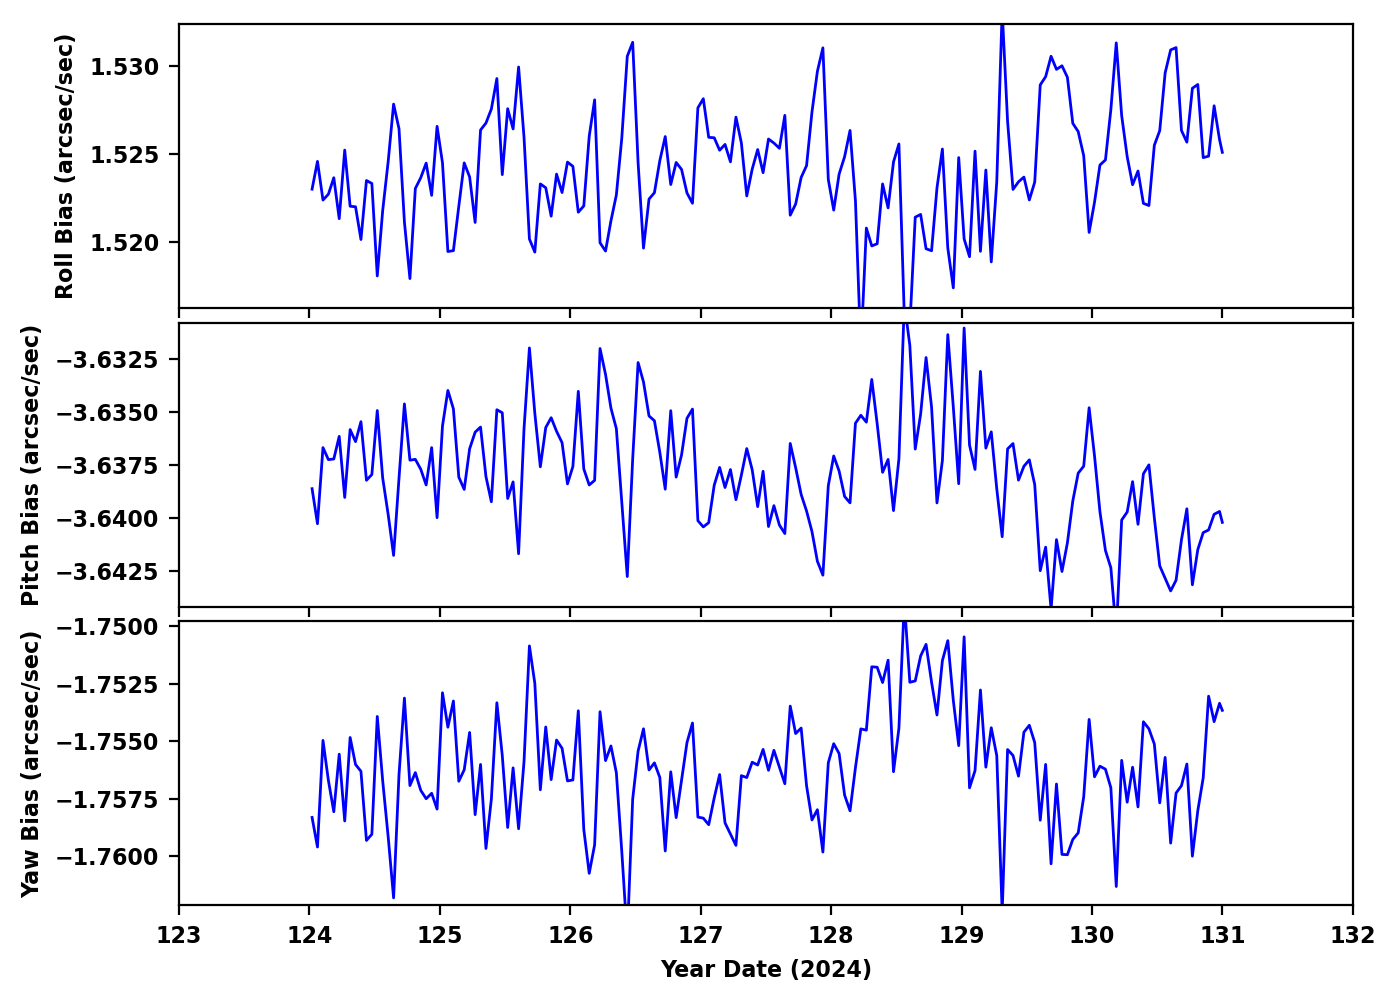
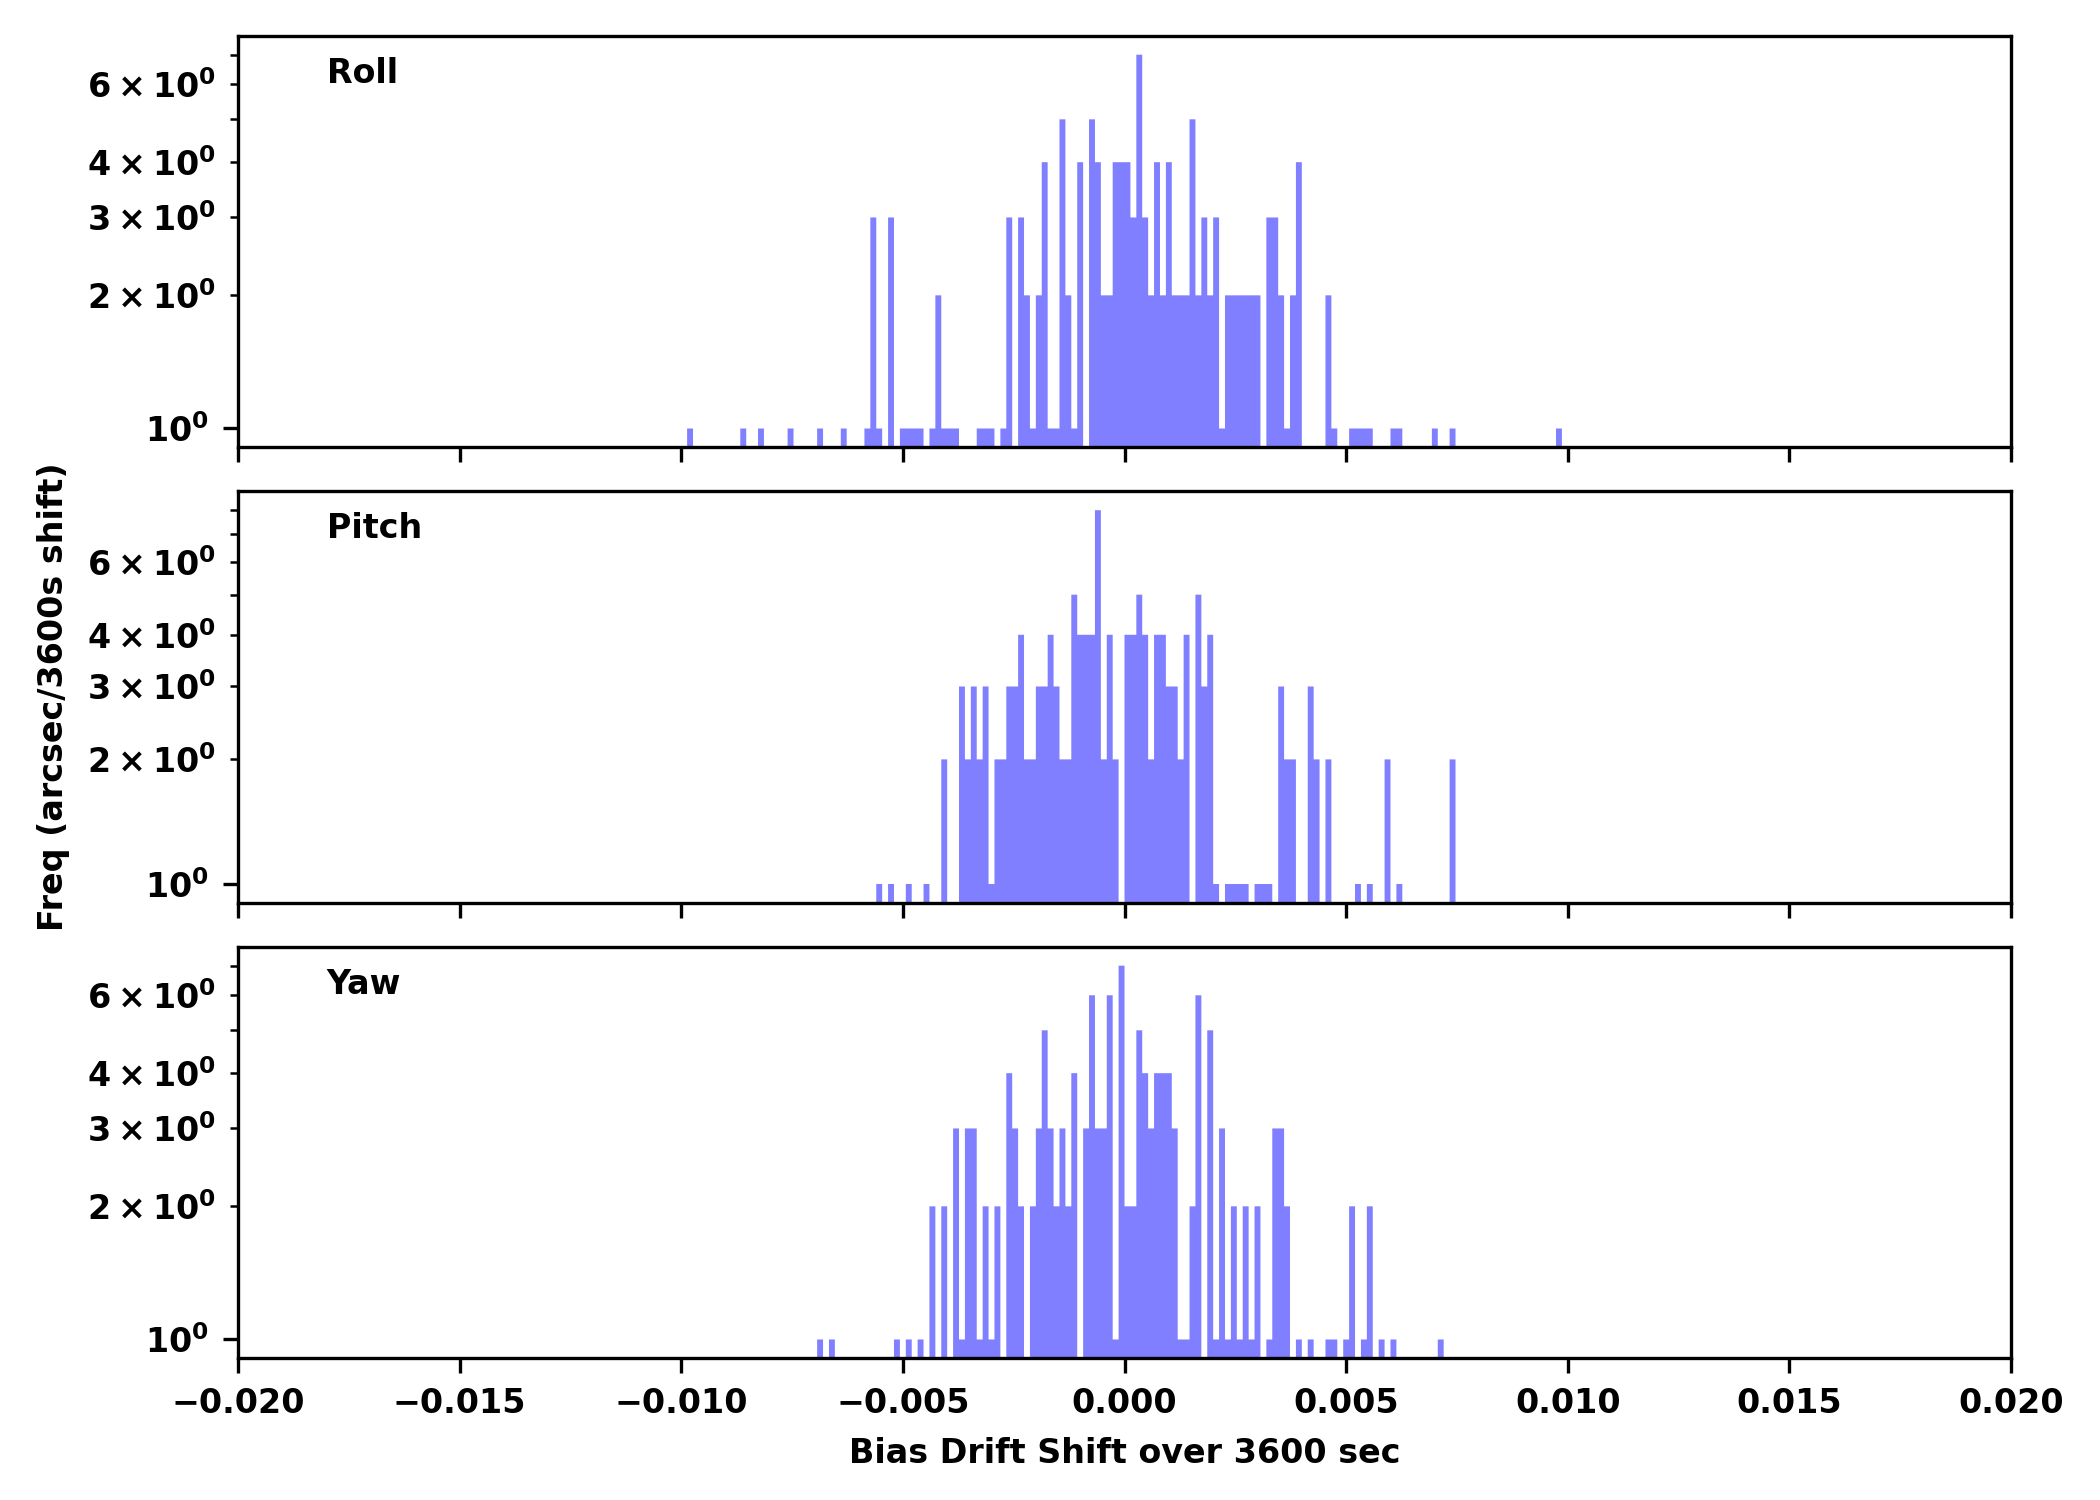
IRUs
| Gyro Bias Drift | Gyro Bias Drift Histogram |
|---|---|
|
|
Recent Observations
| OBSID | DETECTOR | GRATING | TARGET | ANALYSIS | ACA |
|---|---|---|---|---|---|
| 29397 | ACIS-67 | NONE | GW170817 | OK | OK |
| 29398 | ACIS-67 | NONE | GW170817 | OK | OK |
| 28667 | ACIS-567 | LETG | MKN421 | OK/NA | OK |
| 28038 | ACIS-5678 | NONE | 1eRASS J094838.5+332530 | OK | OK |
| 29399 | ACIS-67 | NONE | GW170817 | OK | OK |
| 28791 | ACIS-678 | NONE | SDSS J104241.10+245107.0 | OK | OK |
| 28526 | ACIS-23567 | NONE | GW170817 | OK | OK |
| 28039 | ACIS-5678 | NONE | 1eRASS J094445.0-314949 | OK | OK |
| 28953 | ACIS-67 | NONE | TW Hya | OK | OK |
| 28191 | ACIS-23678 | NONE | LEDA 3098303 | OK | OK |
| 28178 | ACIS-235678 | NONE | ESO435-020 | OK | OK |
| 28289 | ACIS-67 | NONE | SDSS J093514.71+033545.7 | OK | OK |
| 28862 | HRC-S | LETG | HE1338-1423 | OK/NA | OK |
| 28265 | ACIS-5678 | NONE | SDSS J075438.45+423238.8 | OK | OK |
| 26905 | ACIS-67 | NONE | PKS 1418-064 | OK | OK |
| 29074 | ACIS-235678 | NONE | eFEDS J083933.8-014044 | OK | OK |
| 28457 | HRC-S | NONE | SNR G21.5-0.9 | OK | OK |
| 29382 | ACIS-5678 | HETG | V1723 Sco | OK/NA | OK |
| 26898 | ACIS-67 | NONE | TXS1834+612 | OK | OK |
| 26724 | ACIS-367 | NONE | WISEA J122612.12+244246.0 | OK | OK |
| 28325 | ACIS-0123 | NONE | PSZ2G356.53+28.66 | OK | OK |
| 28809 | ACIS-0123 | NONE | PSZ2G000.04+45.13 | OK | OK |
| 28435 | ACIS-3 | NONE | E0102-72.3 | OK | OK |
| 25504 | HRC-I | NONE | PROCYON | OK | OK |
| 26499 | ACIS-0123 | NONE | NGC 6242 | OK | OK |
| 28156 | ACIS-67 | NONE | IC 4518A | OK | OK |
Trending
This week's focus is HRMA Thermal
Last reported on
Feb 22.
Only the most interesting or representative msids are shown below.
For a full listing choose the bulletted link.
| MSID | Mean | RMS | Delta/Yr | Delta/Yr/Yr | Unit | Description | |
|---|---|---|---|---|---|---|---|
| 4rt556t | 0.070 | 5.912e-04 | (2.94+/-0.01)e2 | 0.03 +/- 0.01 | K | RT 556 - HRMA TEMP | |
| 4rt558t | 0.083 | 6.351e-04 | (2.94+/-0.01)e2 | 0.03 +/- 0.01 | K | RT 558 - HRMA TEMP | |
| 4rt568t | 0.694 | 0.003 | (2.91+/-0.05)e2 | 0.12 +/- 0.04 | K | RT 568 - HRMA TEMP | |
| 4rt575t | 0.983 | 0.003 | (2.94+/-0.07)e2 | 0.14 +/- 0.05 | K | RT 575 - OB CONE TEMP | |
| 4rt576t | 0.713 | 0.003 | (2.87+/-0.05)e2 | 0.12 +/- 0.04 | K | RT 576 - OB CONE TEMP | |
| 4rt577t | 1.060 | 0.004 | (2.94+/-0.08)e2 | 0.20 +/- 0.07 | K | RT 577 - OB CONE TEMP | |
| 4rt578t | 0.961 | 0.004 | (2.92+/-0.07)e2 | 0.20 +/- 0.07 | K | RT 578 - OB CONE TEMP | |
| 4rt579t | 0.700 | 0.004 | (2.89+/-0.06)e2 | 0.19 +/- 0.06 | K | RT 579 - OB CONE TEMP | |
| 4rt580t | 0.702 | 0.004 | (2.88+/-0.06)e2 | 0.20 +/- 0.06 | K | RT 580 - OB CONE TEMP | |
| 4rt581t | 0.793 | 0.004 | (2.90+/-0.06)e2 | 0.22 +/- 0.08 | K | RT 581 - OB CONE TEMP |
| MSID | Mean | RMS | Delta/Yr | Delta/Yr/Yr | Unit | Description | |
|---|---|---|---|---|---|---|---|
| 4rt582t | 0.359 | 0.002 | (2.87+/-0.03)e2 | 0.06 +/- 0.02 | K | RT 582 - STRUT TEMP | |
| 4rt583t | 0.558 | 0.002 | (2.90+/-0.04)e2 | 0.07 +/- 0.03 | K | RT 583 - STRUT TEMP | |
| 4rt584t | 0.704 | 0.002 | (2.93+/-0.05)e2 | 0.08 +/- 0.04 | K | RT 584 - STRUT TEMP | |
| 4rt585t | 0.706 | 0.002 | (2.94+/-0.05)e2 | 0.09 +/- 0.04 | K | RT 585 - STRUT TEMP | |
| 4rt586t | 0.567 | 0.002 | (2.91+/-0.04)e2 | 0.09 +/- 0.03 | K | RT 586 - STRUT TEMP | |
| 4rt587t | 0.365 | 0.002 | (2.87+/-0.03)e2 | 0.05 +/- 0.03 | K | RT 587 - STRUT TEMP | |
| 4rt588t | -0.043 | 4.859e-04 | (2.83+/-0.00)e2 | 0.01 +/- 0.01 | K | RT 588 - STRUT TEMP | |
| 4rt589t | 0.714 | 0.003 | (2.88+/-0.06)e2 | 0.10 +/- 0.05 | K | RT 589 - STRUT TEMP | |
| 4rt590t | 1.289 | 0.004 | (2.96+/-0.10)e2 | 0.14 +/- 0.07 | K | RT 590 - STRUT TEMP | |
| 4rt591t | 1.277 | 0.004 | (2.96+/-0.10)e2 | 0.13 +/- 0.07 | K | RT 591 - STRUT TEMP | |
| 4rt592t | 0.652 | 0.003 | (2.87+/-0.05)e2 | 0.11 +/- 0.04 | K | RT 592 - STRUT TEMP | |
| 4rt593t | -0.035 | 4.662e-04 | (2.83+/-0.00)e2 | 0.00 +/- 0.01 | K | RT 593 - STRUT TEMP | |
| 4rt594t | 0.146 | 0.002 | (2.89+/-0.02)e2 | 0.03 +/- 0.01 | K | RT 594 - TFTE TEMP | |
| 4rt595t | 0.695 | 0.003 | (2.88+/-0.05)e2 | 0.10 +/- 0.04 | K | RT 595 - TFTE TEMP | |
| 4rt596t | 0.632 | 0.003 | (2.87+/-0.05)e2 | 0.04 +/- 0.03 | K | RT 596 - TFTE TEMP | |
| 4rt597t | 1.251 | 0.004 | (2.95+/-0.09)e2 | 0.15 +/- 0.06 | K | RT 597 - TFTE TEMP | |
| 4rt598t | 1.226 | 0.004 | (2.95+/-0.09)e2 | 0.16 +/- 0.06 | K | RT 598 - TFTE TEMP |
If you have any questions, please contact: swolk@head.cfa.harvard.edu