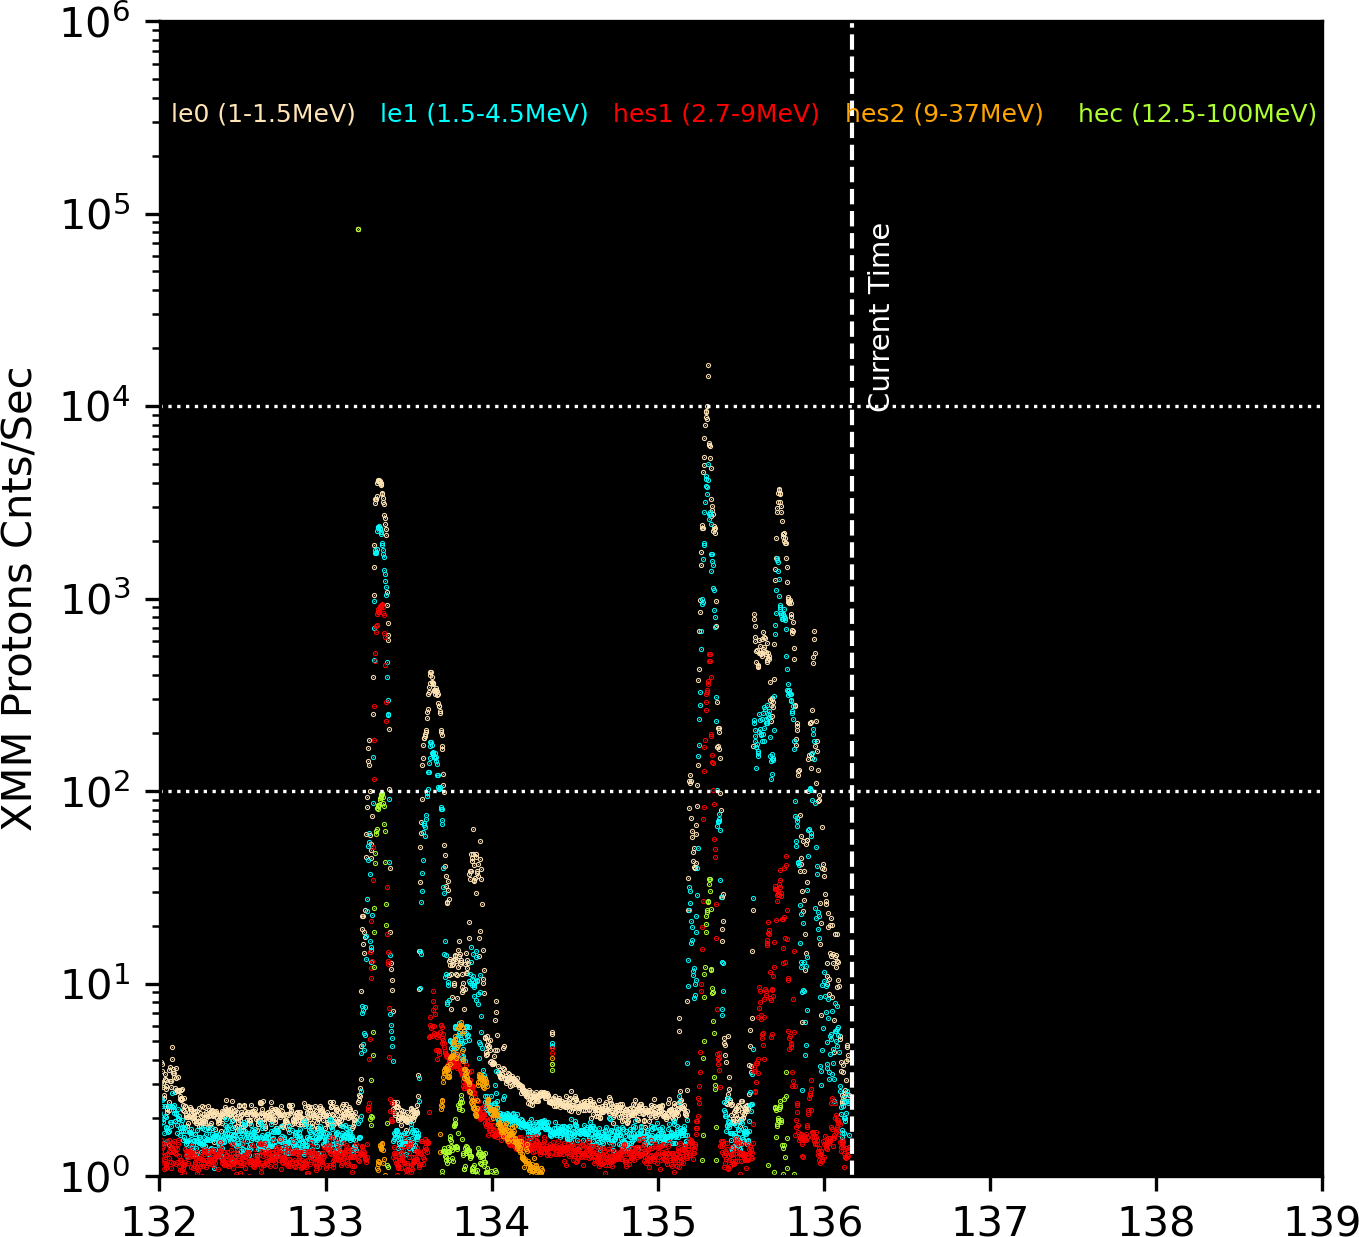

                                        Most recent XMM radiation observations
                                 Differential Flux particles/cm2-s-ster-MeV

 UT Date   Time    ---------------------------------- Protons MeV -------------------------------
                          LE1          LE2         HES1         HES2         HESC
  YR MO DA HHMM          1-1.5       1.5-4.5       2.7-9        9-37       12.5-100
2026-Jul20-17:30        1.936        0.417        1.497        0.495        0.377
2026-Jul20-18:30        1.897        0.434        1.512        0.505        0.426
2026-Jul20-19:30        1.922        0.449        1.502        0.460        0.413
2026-Jul20-20:30        1.982        0.435        1.479        0.458        0.404
2026-Jul20-21:30        1.938        0.461        1.513        0.513        0.418
2026-Jul20-22:30        1.927        0.453        1.535        0.470        0.391
2026-Jul20-23:30        1.914        0.409        1.567        0.496        0.416
2026-Jul21-00:30        1.980        0.434        1.478        0.499        0.404
2026-Jul21-01:30        1.912        0.456        1.573        0.450        0.408
2026-Jul21-02:30        1.959        0.427        1.525        0.474        0.394
2026-Jul21-03:30        1.871        0.457        1.543        0.494        0.400
2026-Jul21-04:30        1.914        0.438        1.540        0.467        0.404
2026-Jul21-05:30        1.936        0.412        1.595        0.463        0.403
2026-Jul21-06:30        1.887        0.431        1.605        0.497        0.402
2026-Jul21-07:30        2.035        0.480        1.592        0.467        0.404
2026-Jul21-08:30        2.077        0.406        1.614        0.536        0.389
2026-Jul21-09:30    12484.816    12483.180    12484.135    12483.235    12483.137
2026-Jul21-10:30           na           na           na           na           na
2026-Jul21-11:30        2.075        0.439        1.512        0.493        0.371
2026-Jul21-12:30        2.169        0.419        1.538        0.497        0.395
2026-Jul21-13:30        2.034        0.444        1.548        0.494        0.382
2026-Jul21-14:30        1.903        0.452        1.550        0.451        0.384
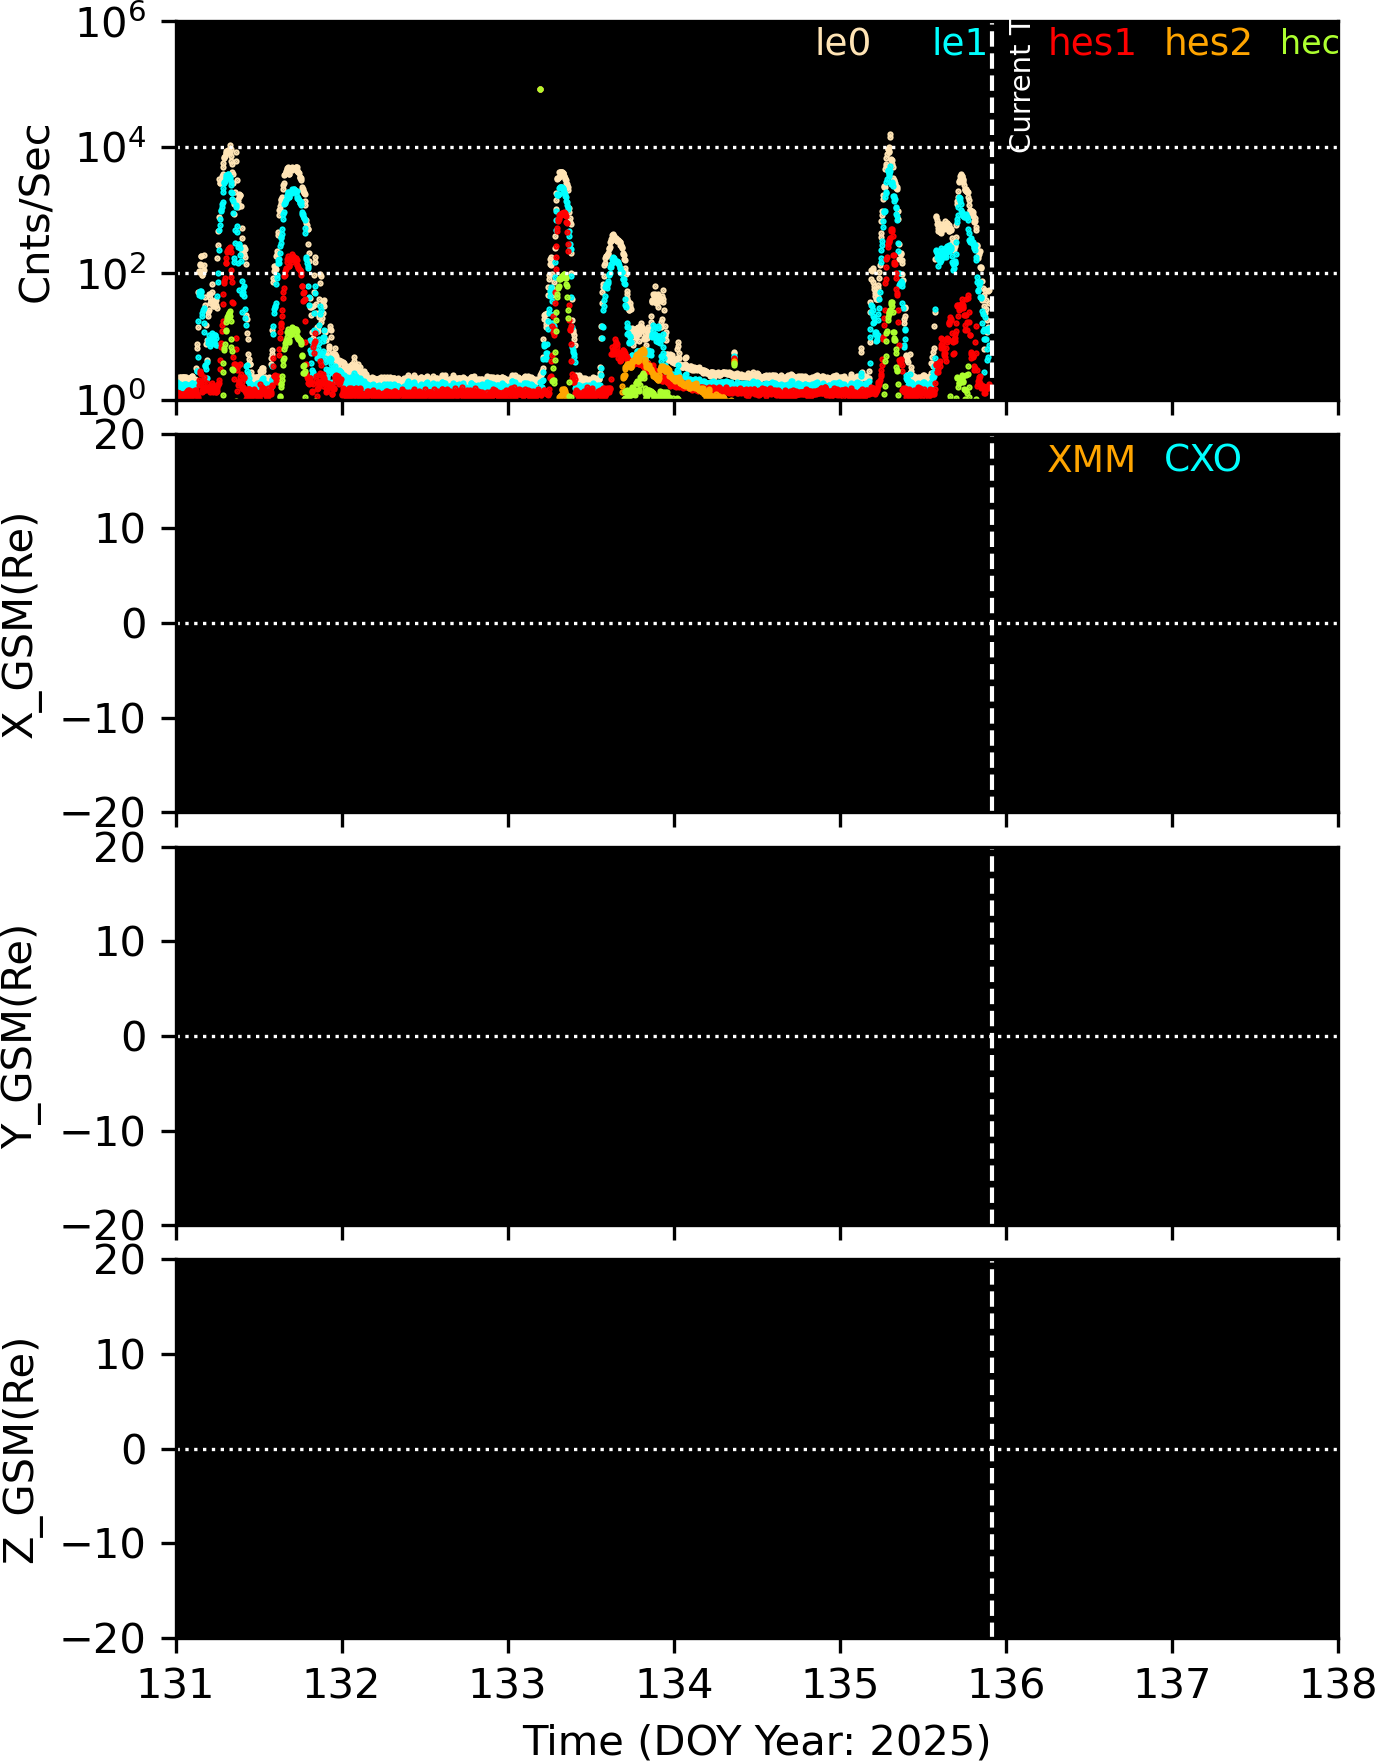
The following plots show the orbits of CXO and XMM in GSM coordinates. The left plot is in X-Y plane, and the right plot is in X-Z plane. If the orbit is in green, the satellite is in the solar wind area, if it is in light blue, the satellite is in magnetosheath, and if it is in yellow, the satellite is in magnetosphere.
The periods of the plotted orbits are +/-1.35 days from the current satellite positions (*), and the orange pentagon (*) mark the positions of one day ago.

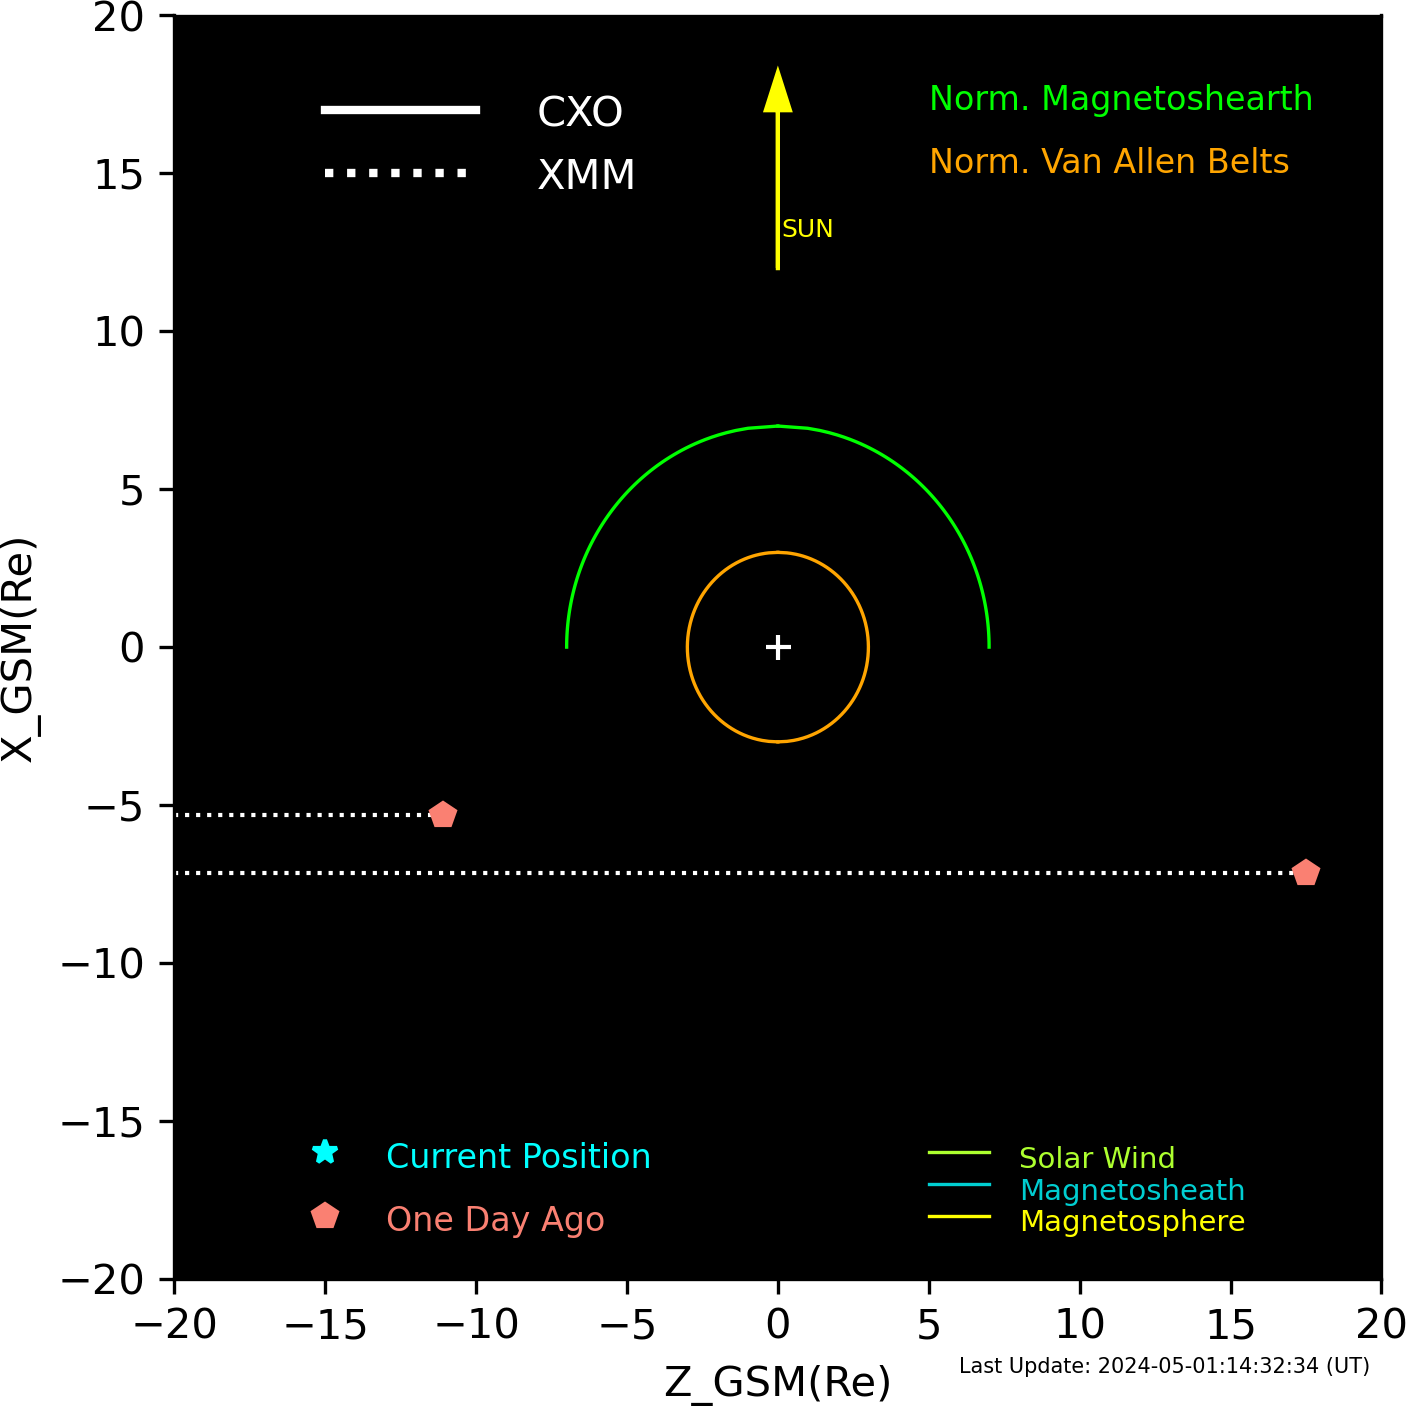
XMM and CXO orbits in GSM coordinates.
Email problems to: swolk
(Scott Wolk)
...it is all his fault