

|
|
|
Note: This page describes the RMFs for use with PHA-based PI. As of CALDB 4.2/CIAO 4.2 (December 2009), the default is to calculate PI from scaled SUMAMPS (SAMP) rather than PHA. New RMFs have been created for use SAMP-based PI, see this page.
We have developed RMFs for the HRC-I and HRC-S. This page discusses the creation of and justification for the RMF and provides grids in hardness-ratio and quantile-width spaces for some common spectral models, as calculated with the new RMF.
Vinay Kashyap & Jennifer Posson-Brown
The intrinsic energy resolution of the HRC is poor compared with the
ACIS, but it does have some ability to discriminate between hard and
soft spectra. Lab tests of HRC-I pulse-height distributions obtained
during sub-assembly calibration show a monotonic trend in the median
PHA for line energies below 2 keV (see
Figure 7.7
of the
Chandra
Proposers' Observatory Guide).
Using observations of HR1099 carried out using the HRC-I/LETG at various
locations on the detector (ObsIDs 1388, 1389, 1392, 1393), we have constructed
a response matrix for the HRC-I (see
Kashyap
& Posson-Brown 2005). The following plot from Kashyap
& Posson-Brown 2005 summarizes our analysis.
The HRC-I RMF can be used to calibrate hardness ratios or quantile color-color
diagrams (QCCD) to distinguish between gross differences in the spectra.
We recommend the QCCD, as it is relatively less dependent on temporal
variations in the gain that are known to exist, and are not yet accounted
for, in the gain-correction maps.
Here we provide grids in hardness-ratio and quantile-width spaces for
some common spectral models, as calculated using the HRC-I RMF derived
above and a nominal on-axis ARF (v2.2). The grids were calculated using Sherpa. For
the hardness ratio, we choose three bands in PI,
HRC-I
Introduction | Files | Grids
November 2005 Introduction
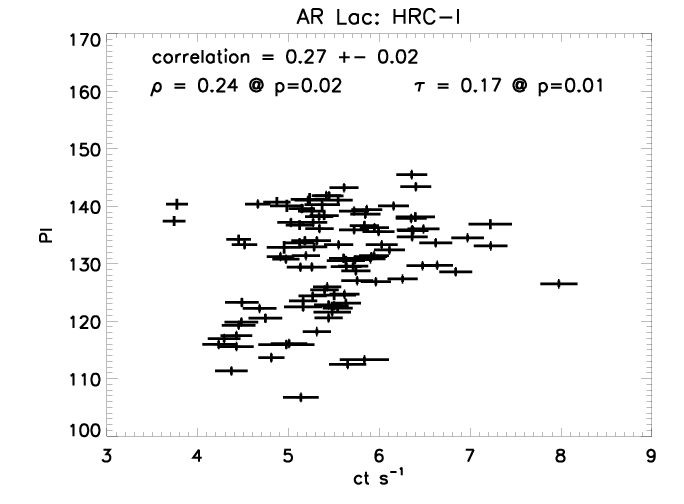 This spectral discrimination is also seen in flight data.
We have analyzed data from the flaring variable coronal
source AR Lac, which has been regularly observed since
1999 as a calibration source to monitor the HRC-I gain and
QE, and in the adjacent plot we show the count-rate and the
corresponding median PI computed for each observation (each
approximately 2 ks in duration) with off-axis values < 8 arcmin. When a coronal source
flares, the plasma temperature is usually higher, and
consequently the spectrum is harder; a (weak) correlation
is therefore to be expected between count-rate and spectral
hardness, and is indeed detected in the data. A correlation
of 0.27 is observed, with an error of 0.02 determined after a
Monte Carlo simulation of the individual errors. Pearson's
coefficient rho is 0.24, with a p-value of 0.02, and
Kendall's Rank correlation coefficient tau is 0.17, with a
p-value of 0.01.
This spectral discrimination is also seen in flight data.
We have analyzed data from the flaring variable coronal
source AR Lac, which has been regularly observed since
1999 as a calibration source to monitor the HRC-I gain and
QE, and in the adjacent plot we show the count-rate and the
corresponding median PI computed for each observation (each
approximately 2 ks in duration) with off-axis values < 8 arcmin. When a coronal source
flares, the plasma temperature is usually higher, and
consequently the spectrum is harder; a (weak) correlation
is therefore to be expected between count-rate and spectral
hardness, and is indeed detected in the data. A correlation
of 0.27 is observed, with an error of 0.02 determined after a
Monte Carlo simulation of the individual errors. Pearson's
coefficient rho is 0.24, with a p-value of 0.02, and
Kendall's Rank correlation coefficient tau is 0.17, with a
p-value of 0.01.
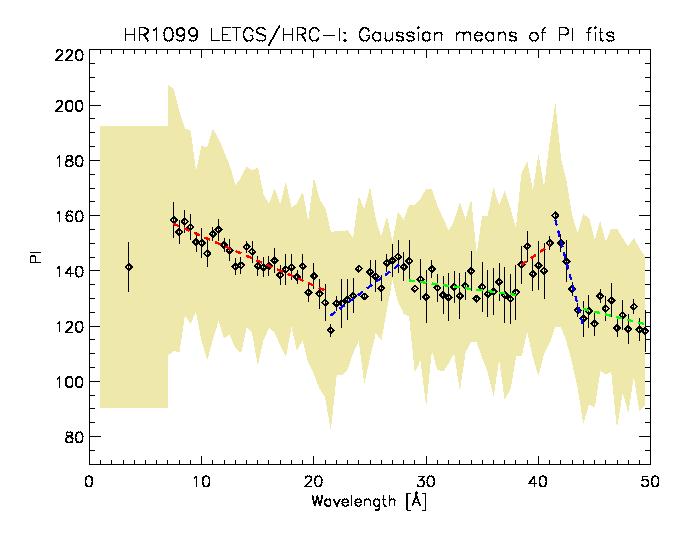 Results of fitting wavelength "slices" of co-added HRC-I/LETG HR 1099
observations with Gaussians. The best-fits means are shown by diamond
points, with one sigma error bars. The shaded region shows the best-fit
Gaussian sigmas. The dashed lines show linear fits to the means. We
constructed the RMF from these linear fits.
Results of fitting wavelength "slices" of co-added HRC-I/LETG HR 1099
observations with Gaussians. The best-fits means are shown by diamond
points, with one sigma error bars. The shaded region shows the best-fit
Gaussian sigmas. The dashed lines show linear fits to the means. We
constructed the RMF from these linear fits.
Files
Grids
and consider the colors
As Park et al. (2006) point out, colors are the most well-behaved of the
different types of hardness-ratios even at low counts.
For the quantile-width (see Hong et al. 2004) grids, we consider
where EPP refers to the energy of the photon or the PI value
of the event that corresponds to the PPth percentile in the
observed spectral distribution (thus, E50 is the median).
The quantile-width grids are more stable to temporal changes in gain than
the hardness ratio grid.
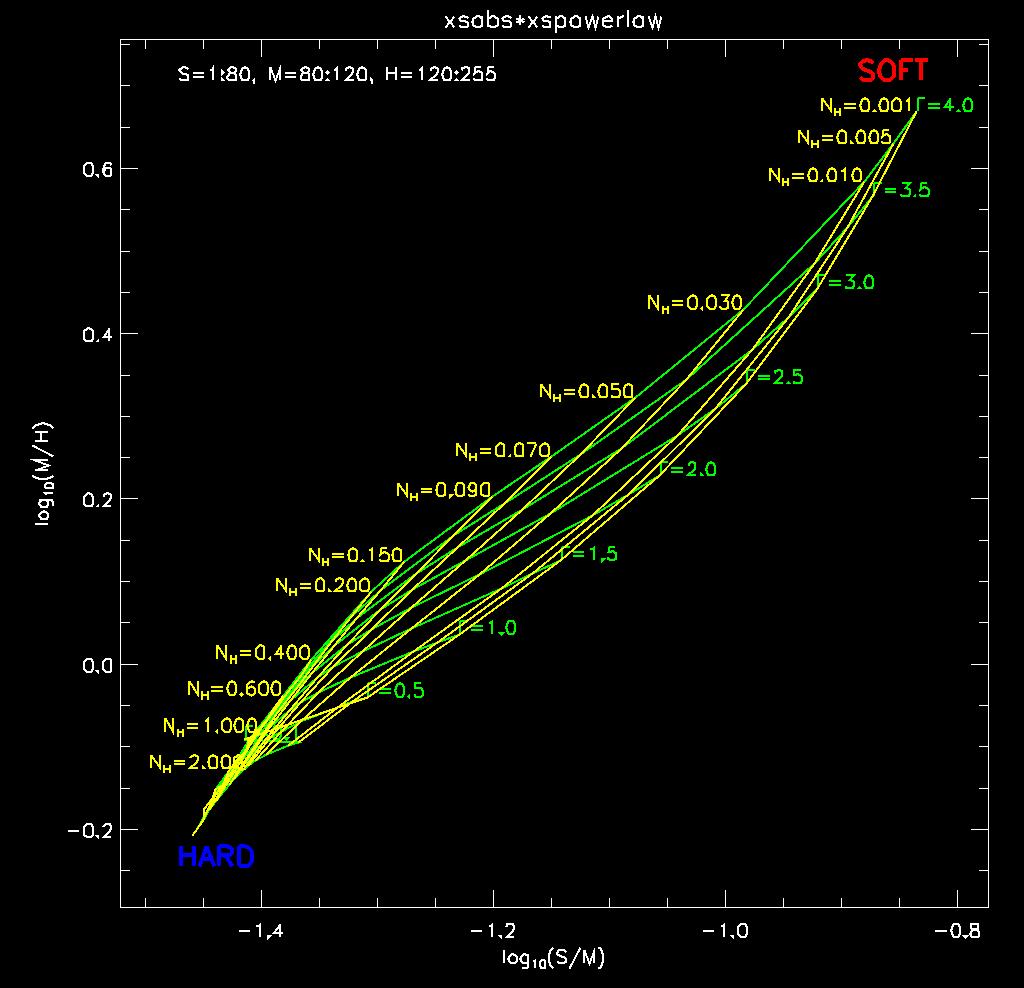
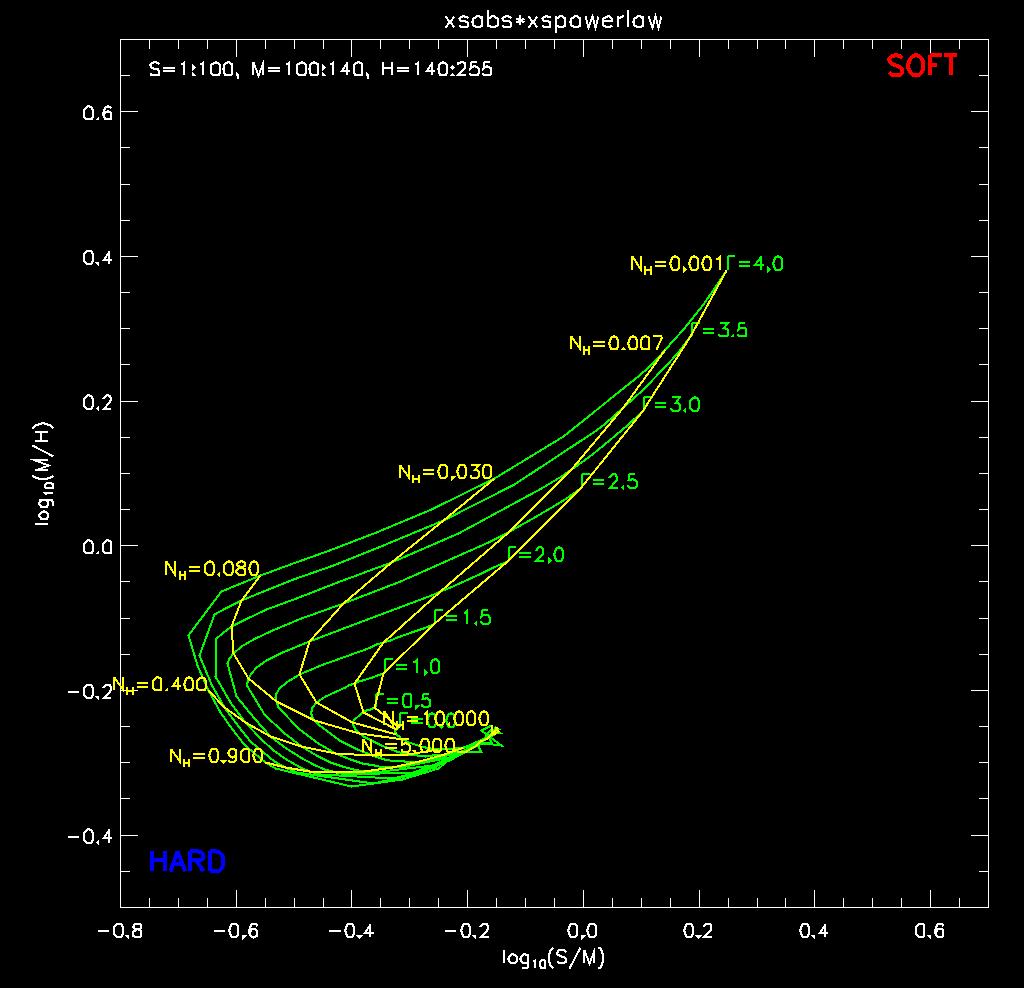 The color-color grid for a powerlaw model, calculated for
various values of the
powerlaw index Gamma (green loci) and
absorption column NH [1022 cm-2] (yellow loci).
The color-color grid for a powerlaw model, calculated for
various values of the
powerlaw index Gamma (green loci) and
absorption column NH [1022 cm-2] (yellow loci).
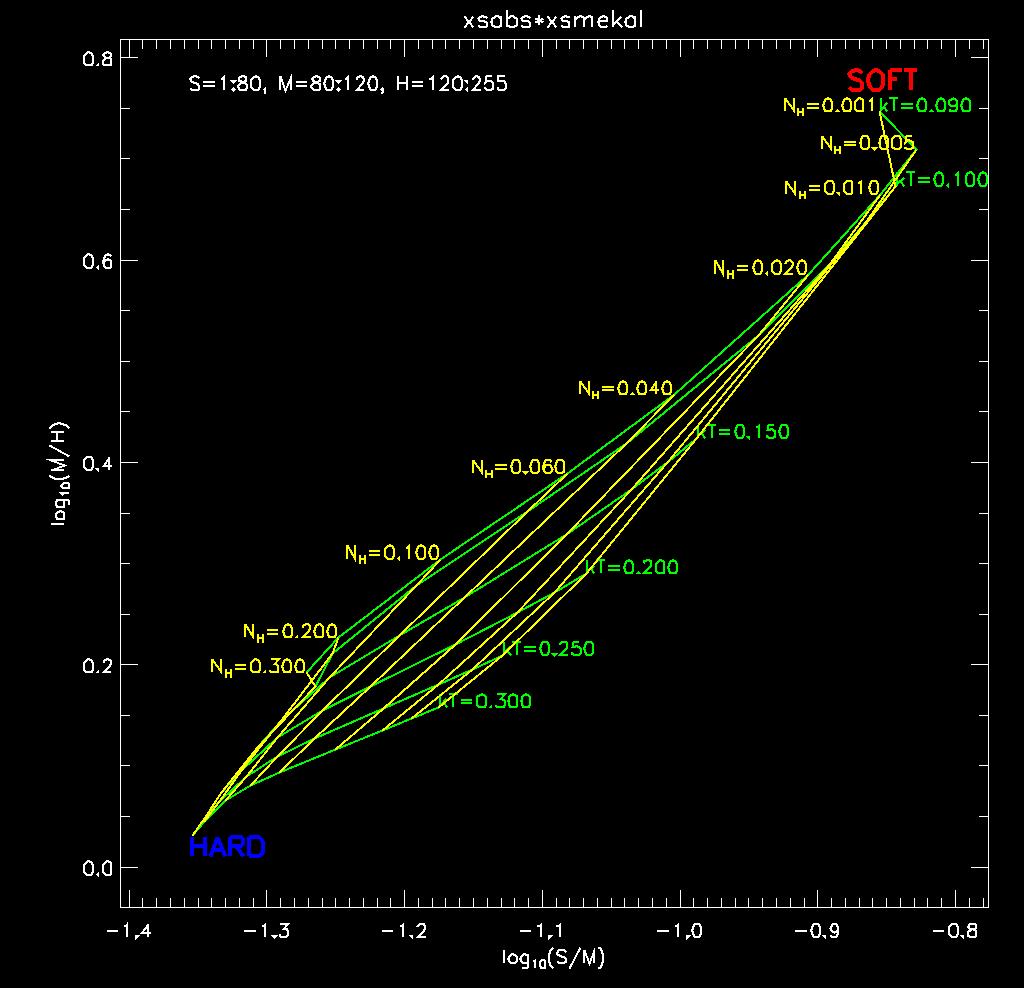
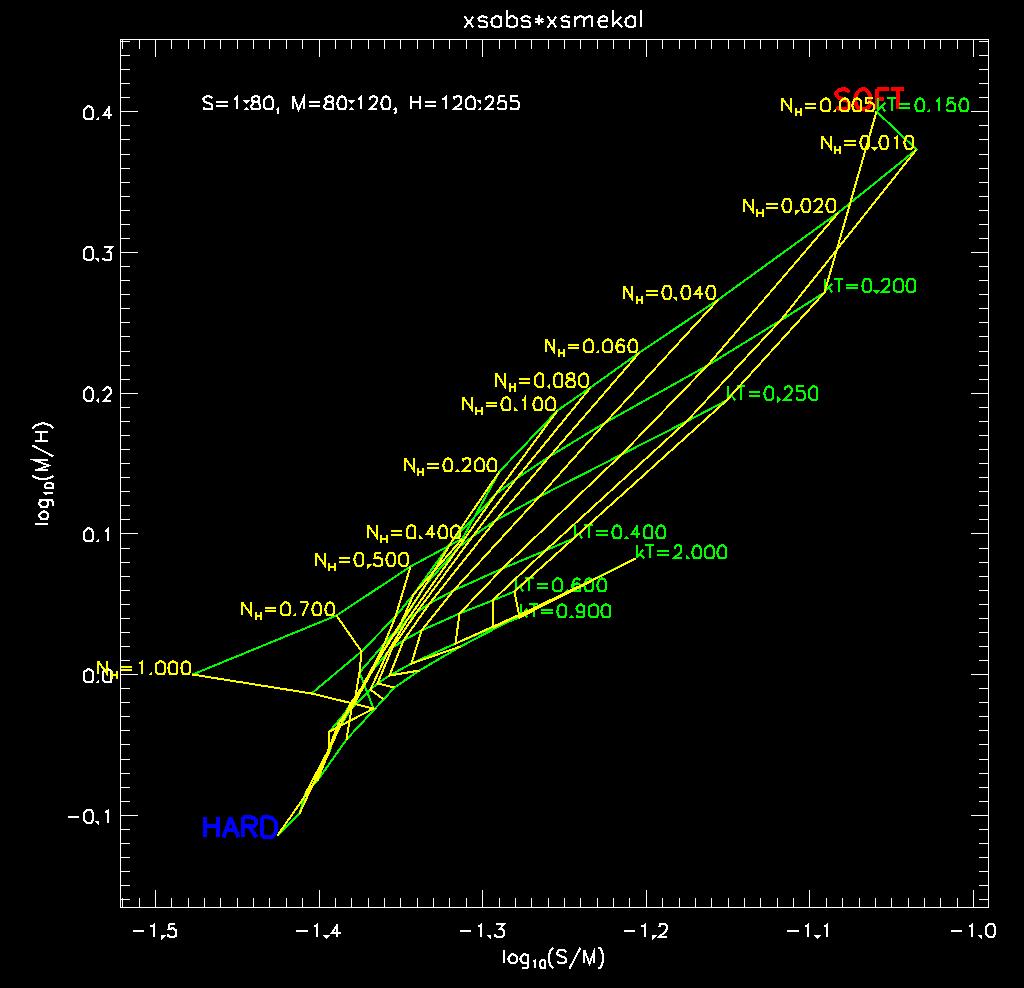
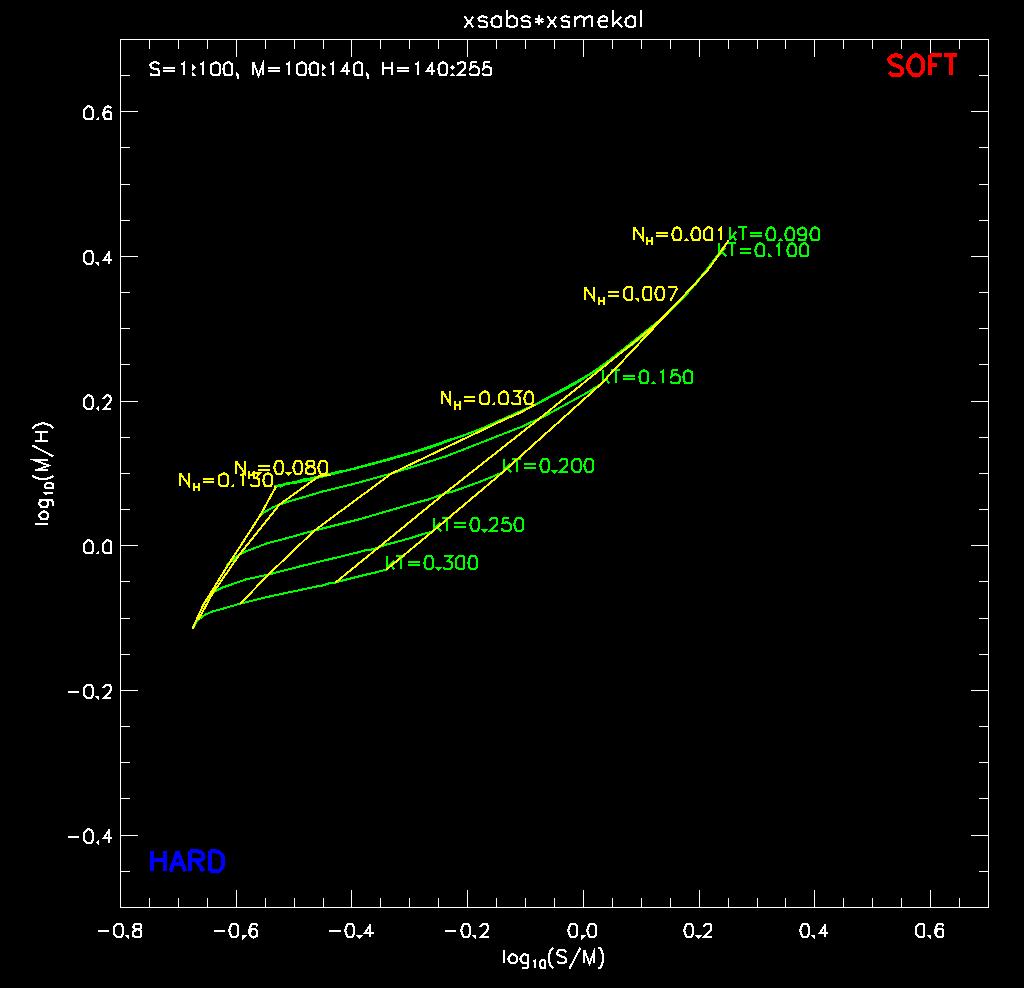 The color-color grid for a MEKAL model, calculated for
relatively low values of the plasma temperature kT [keV] (green loci) and
absorption column NH [1022 cm-2] (yellow loci).
The color-color grid for a MEKAL model, calculated for
relatively low values of the plasma temperature kT [keV] (green loci) and
absorption column NH [1022 cm-2] (yellow loci).
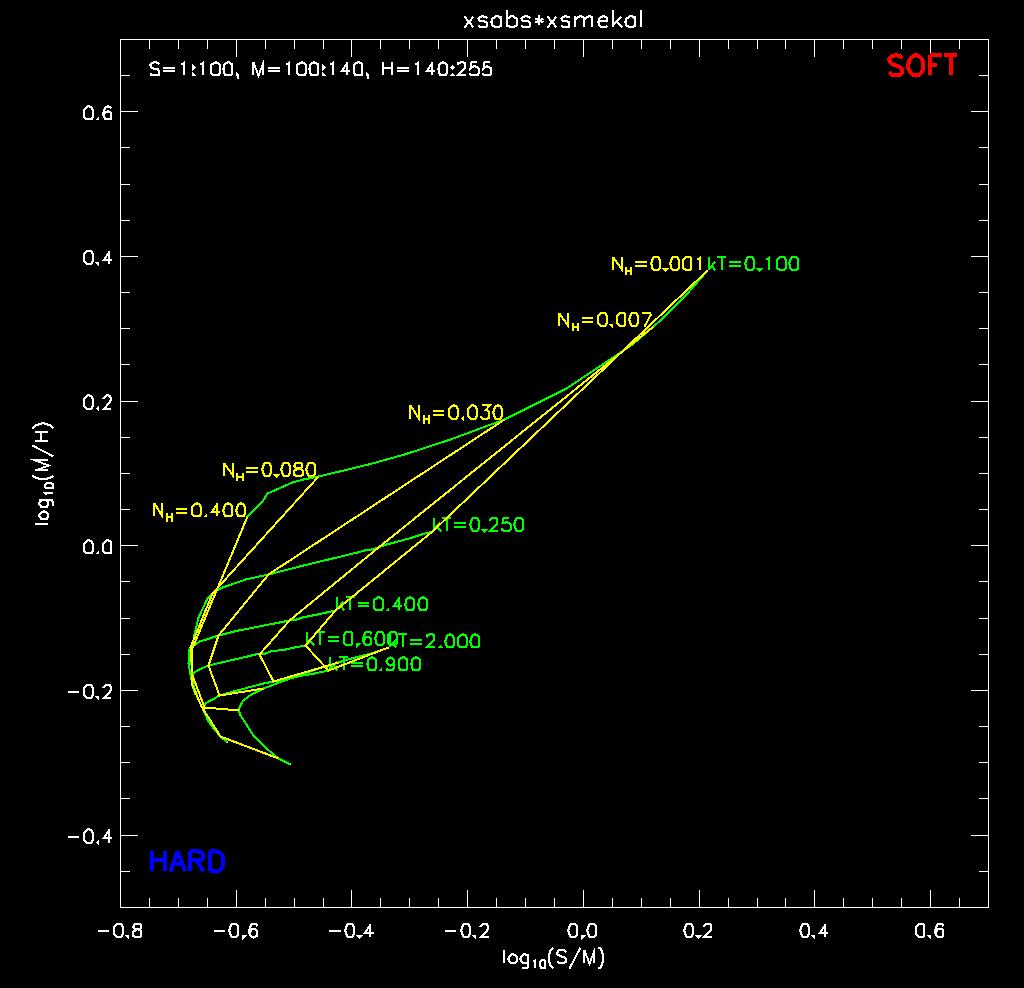 The color-color grid for a MEKAL model, calculated for
relatively high values of the plasma temperature kT [keV] (green loci) and
absorption column NH [1022 cm-2] (yellow loci).
The color-color grid for a MEKAL model, calculated for
relatively high values of the plasma temperature kT [keV] (green loci) and
absorption column NH [1022 cm-2] (yellow loci).
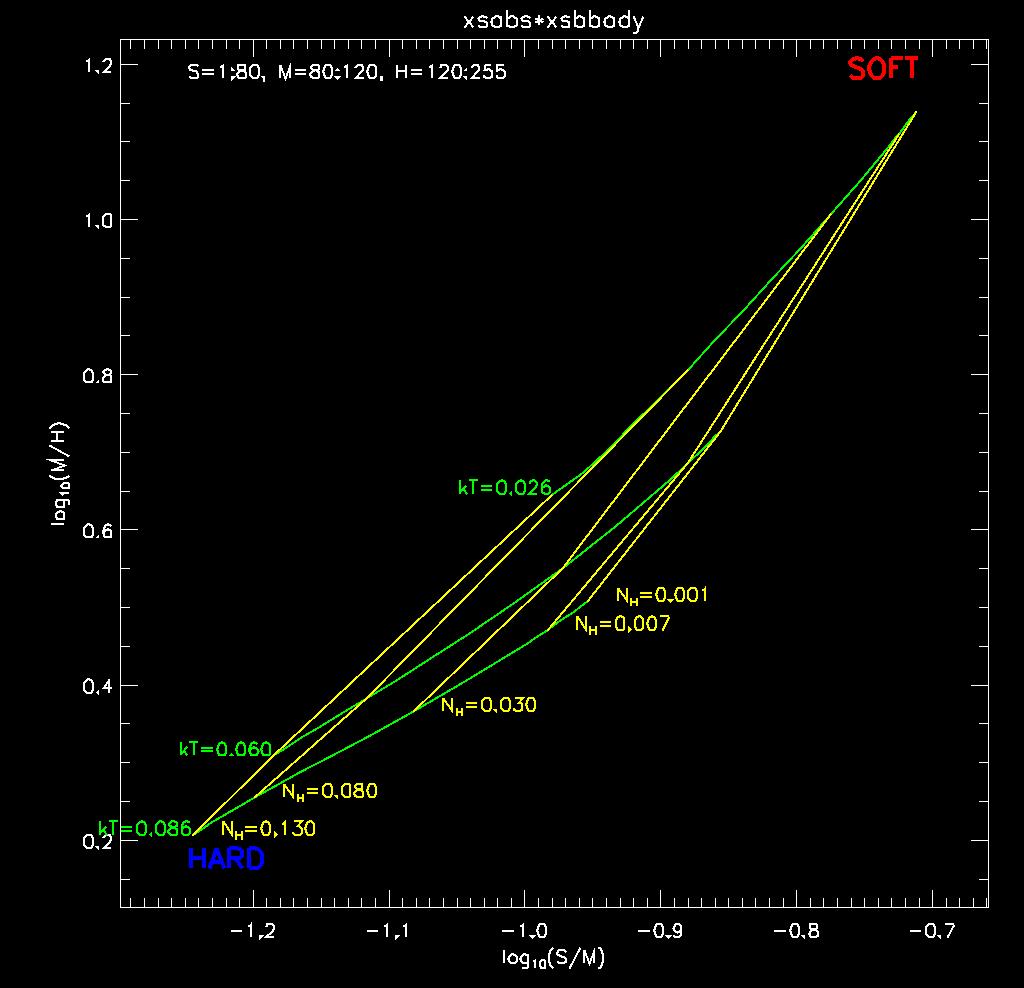
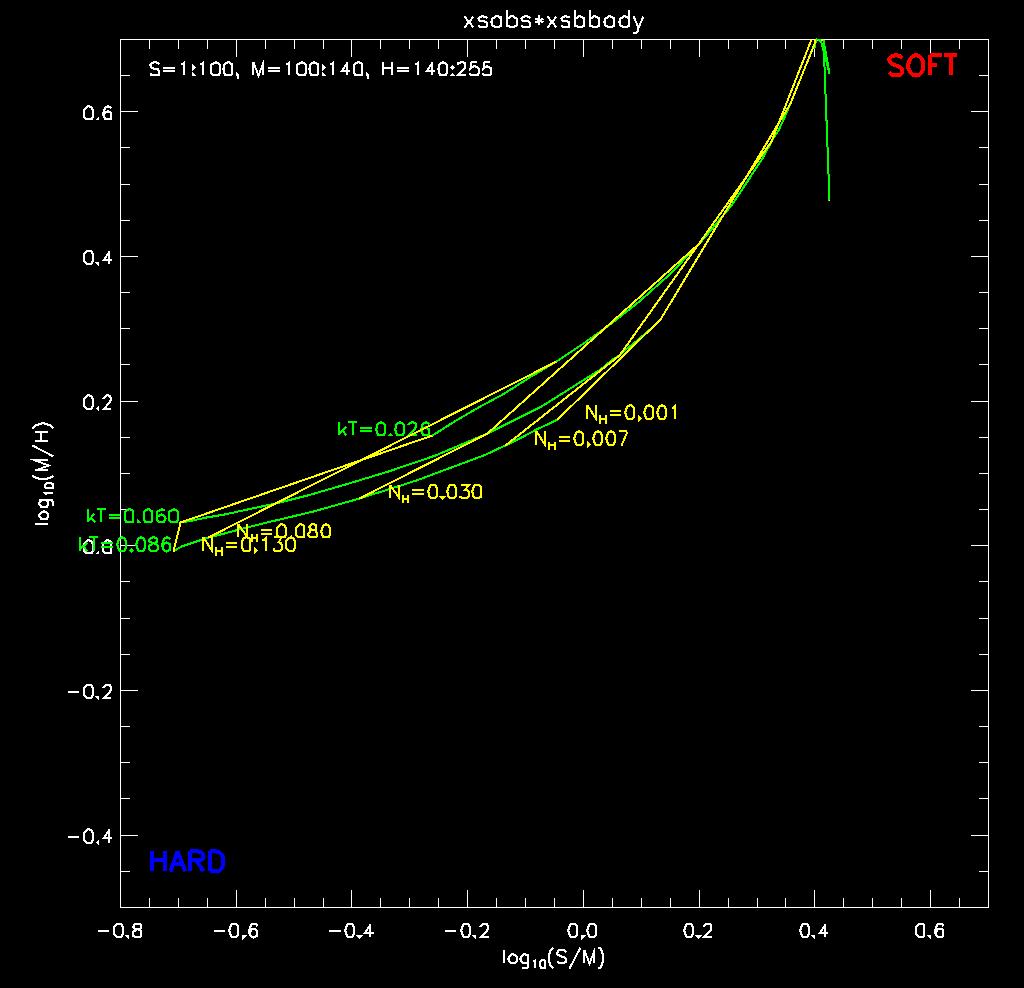 The color-color grid for a Blackbody model, calculated for
various values of the
temperature kT [keV] (green loci) and
absorption column NH [1022 cm-2] (yellow loci).
The color-color grid for a Blackbody model, calculated for
various values of the
temperature kT [keV] (green loci) and
absorption column NH [1022 cm-2] (yellow loci).
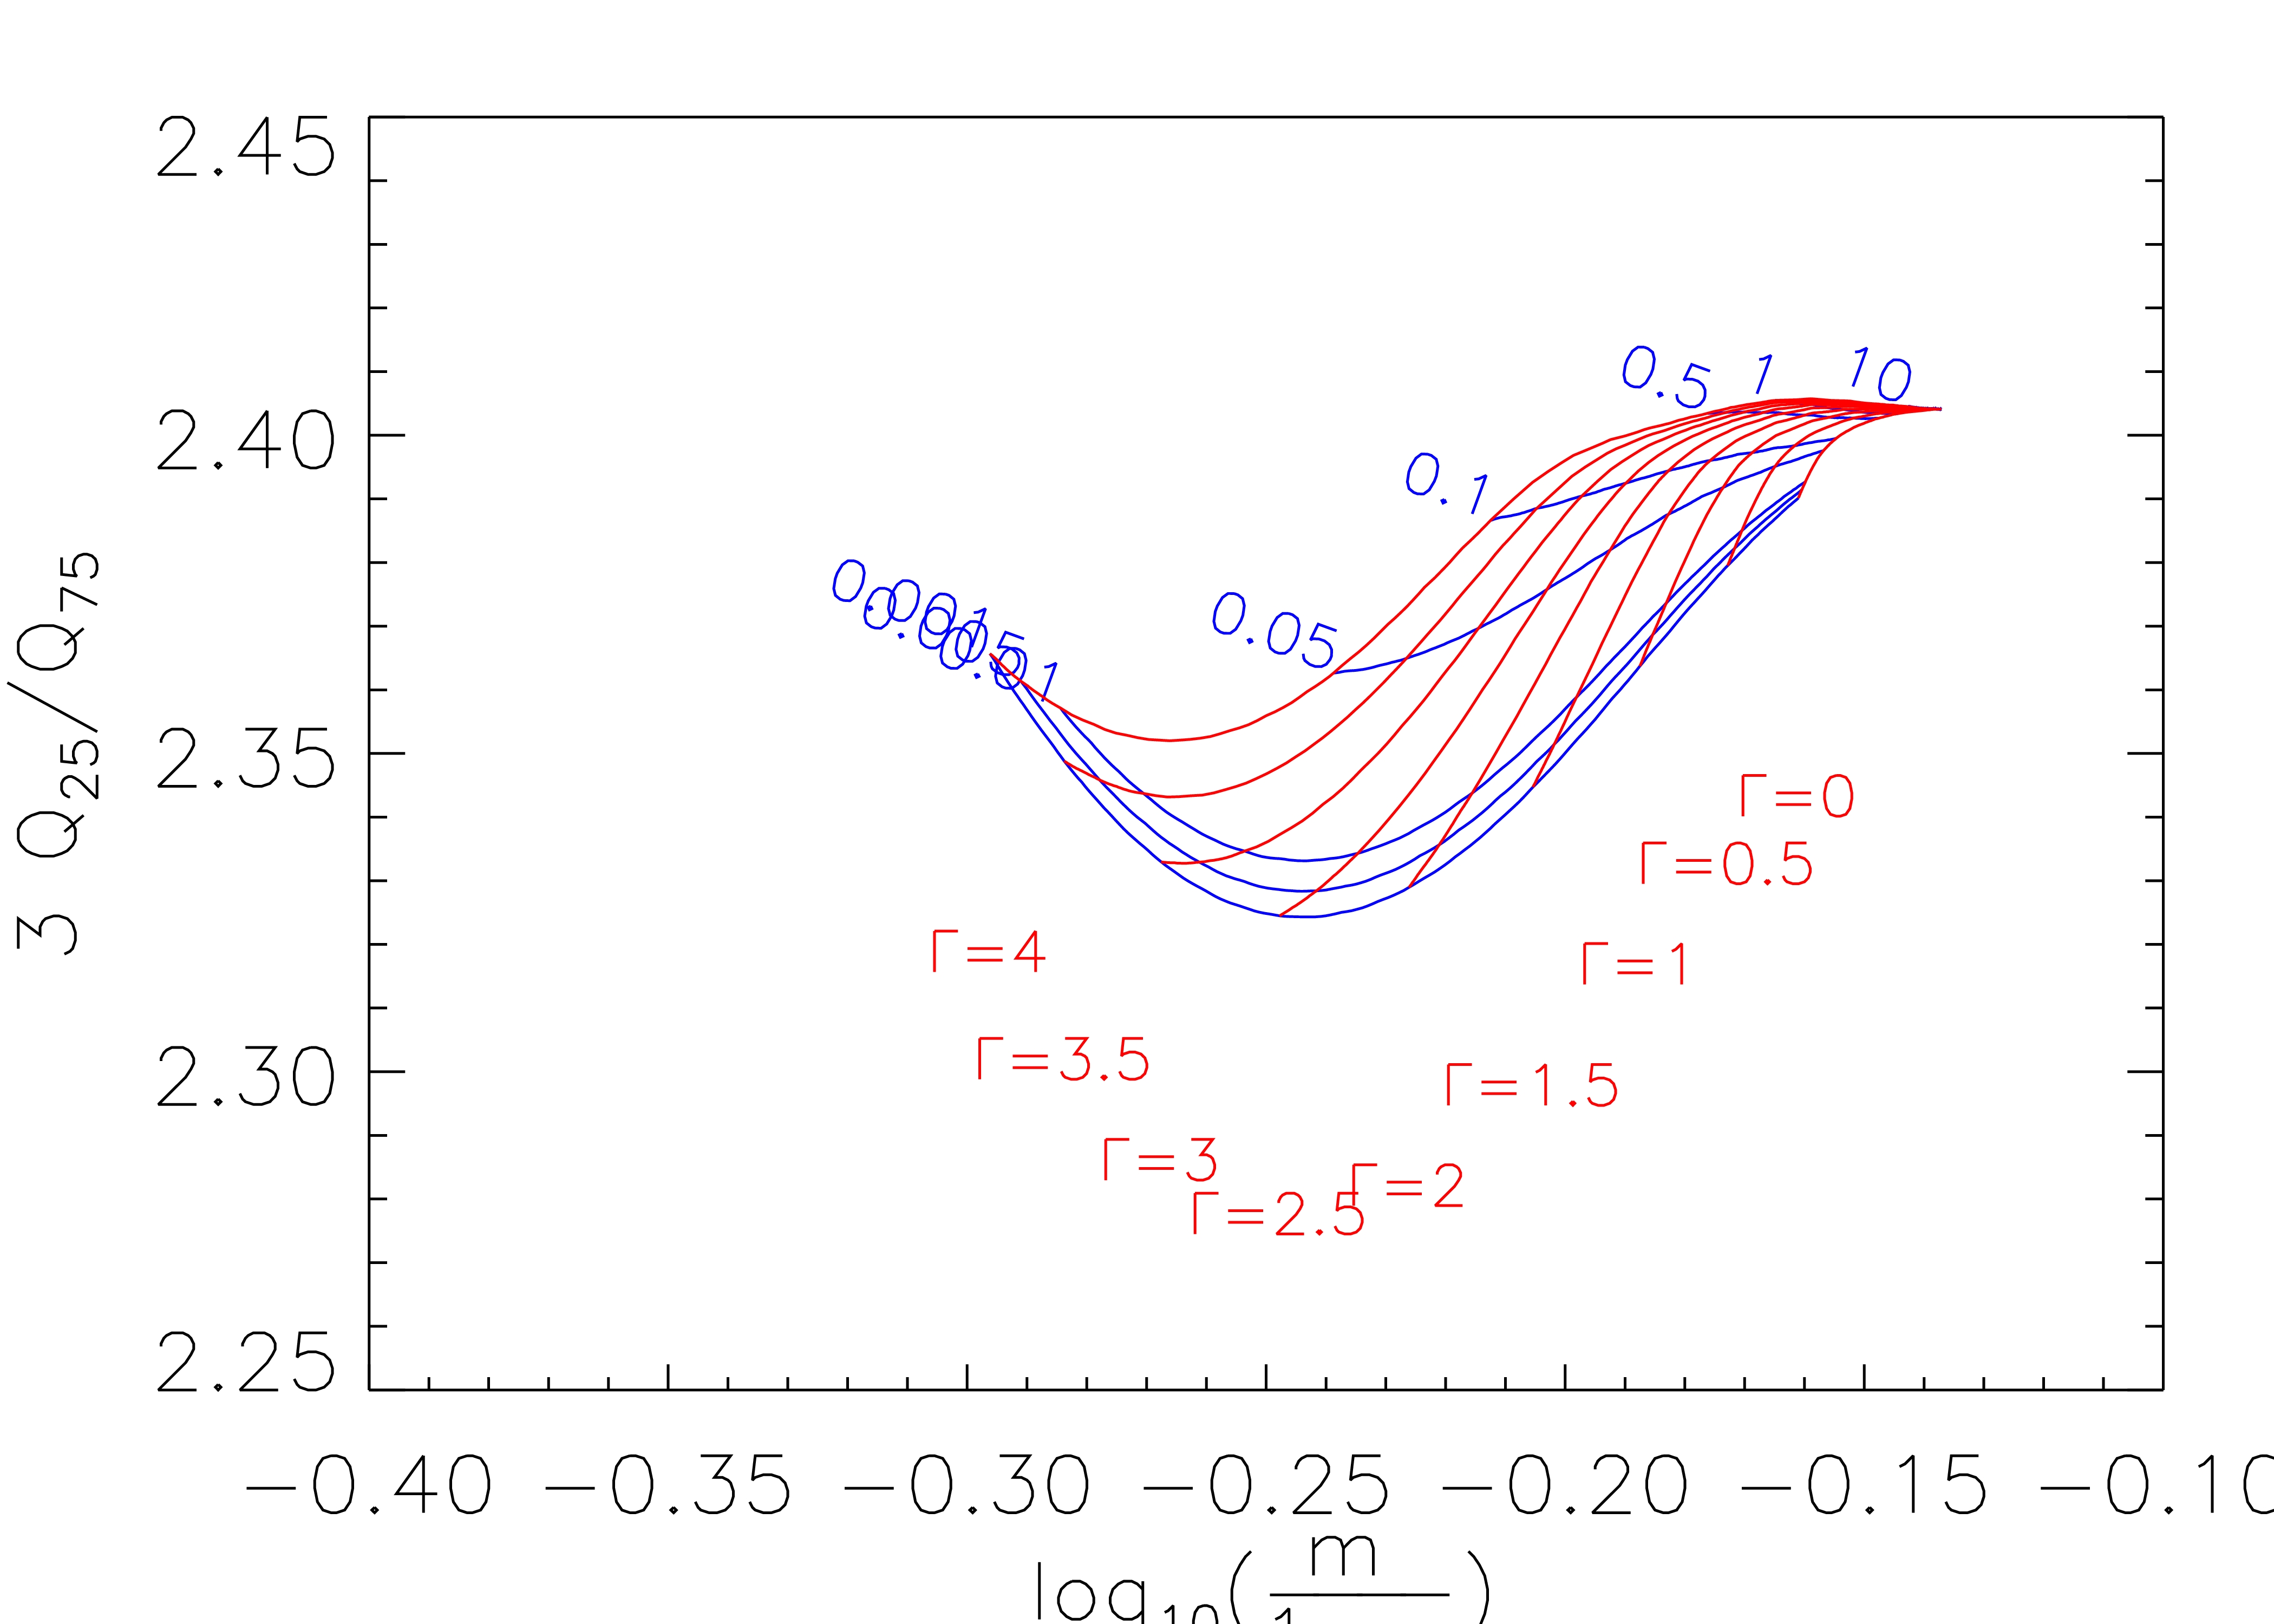
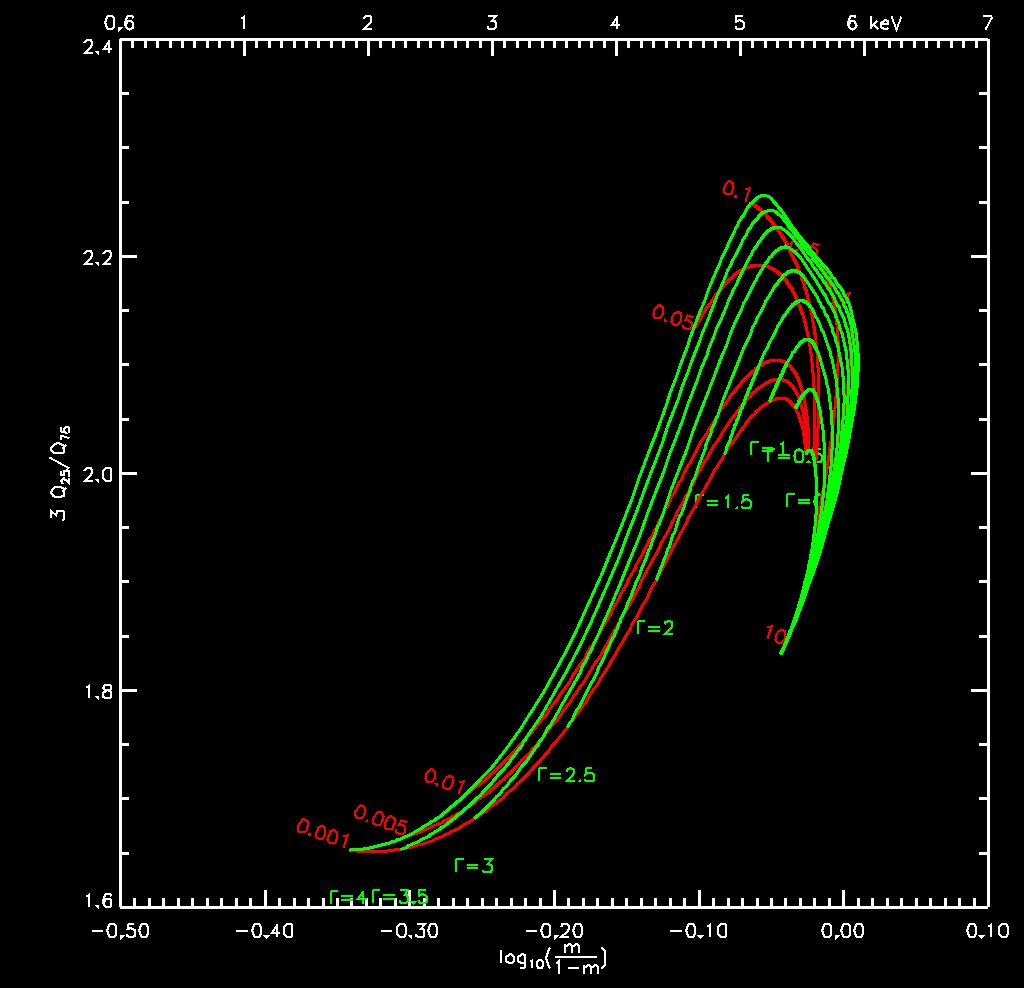 The quantile-width grid for a powerlaw model, calculated for
various values of the
powerlaw index Gamma (green loci) and
absorption column NH [1022 cm-2] (red loci).
The quantile-width grid for a powerlaw model, calculated for
various values of the
powerlaw index Gamma (green loci) and
absorption column NH [1022 cm-2] (red loci).
 The quantile-width grid for a MEKAL model, calculated for
relatively low values of the plasma temperature kT [keV] (blue loci) and
absorption column NH [1022 cm-2] (red loci).
The quantile-width grid for a MEKAL model, calculated for
relatively low values of the plasma temperature kT [keV] (blue loci) and
absorption column NH [1022 cm-2] (red loci).
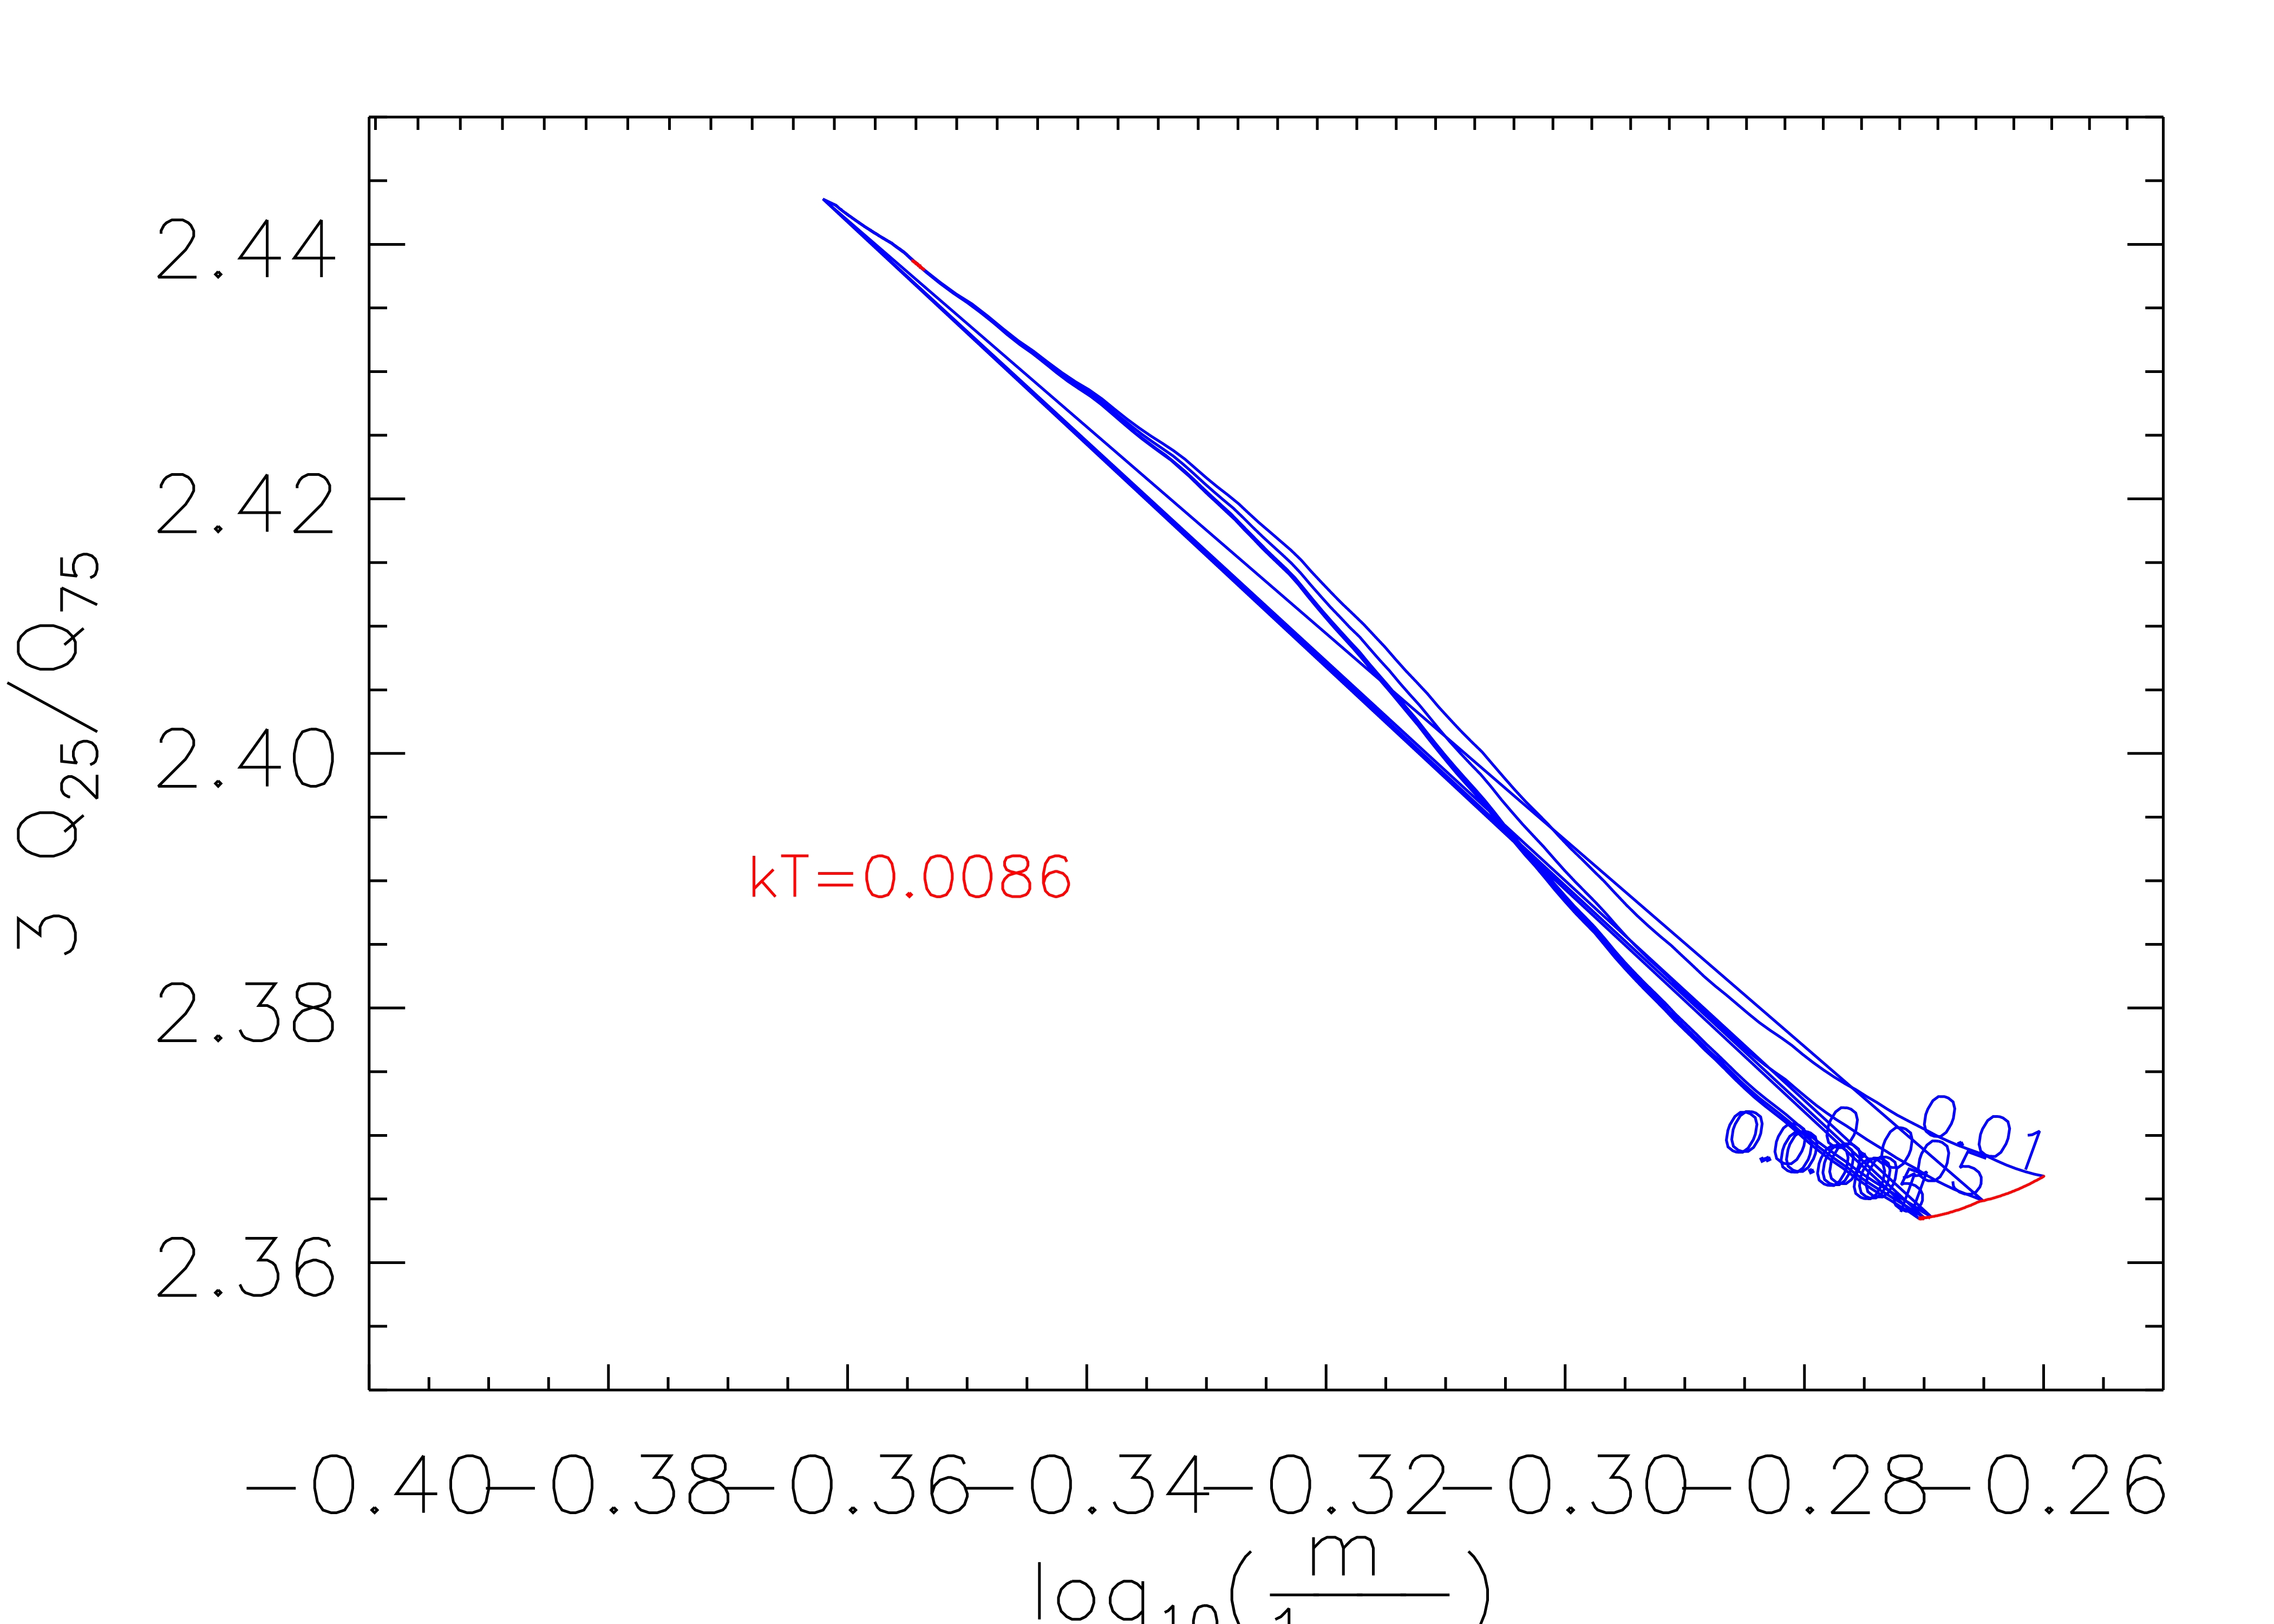
 The quantile-width grid for a MEKAL model, calculated for
relatively high values of the plasma temperature kT [keV] (blue loci) and
absorption column NH [1022 cm-2] (red loci).
The quantile-width grid for a MEKAL model, calculated for
relatively high values of the plasma temperature kT [keV] (blue loci) and
absorption column NH [1022 cm-2] (red loci).
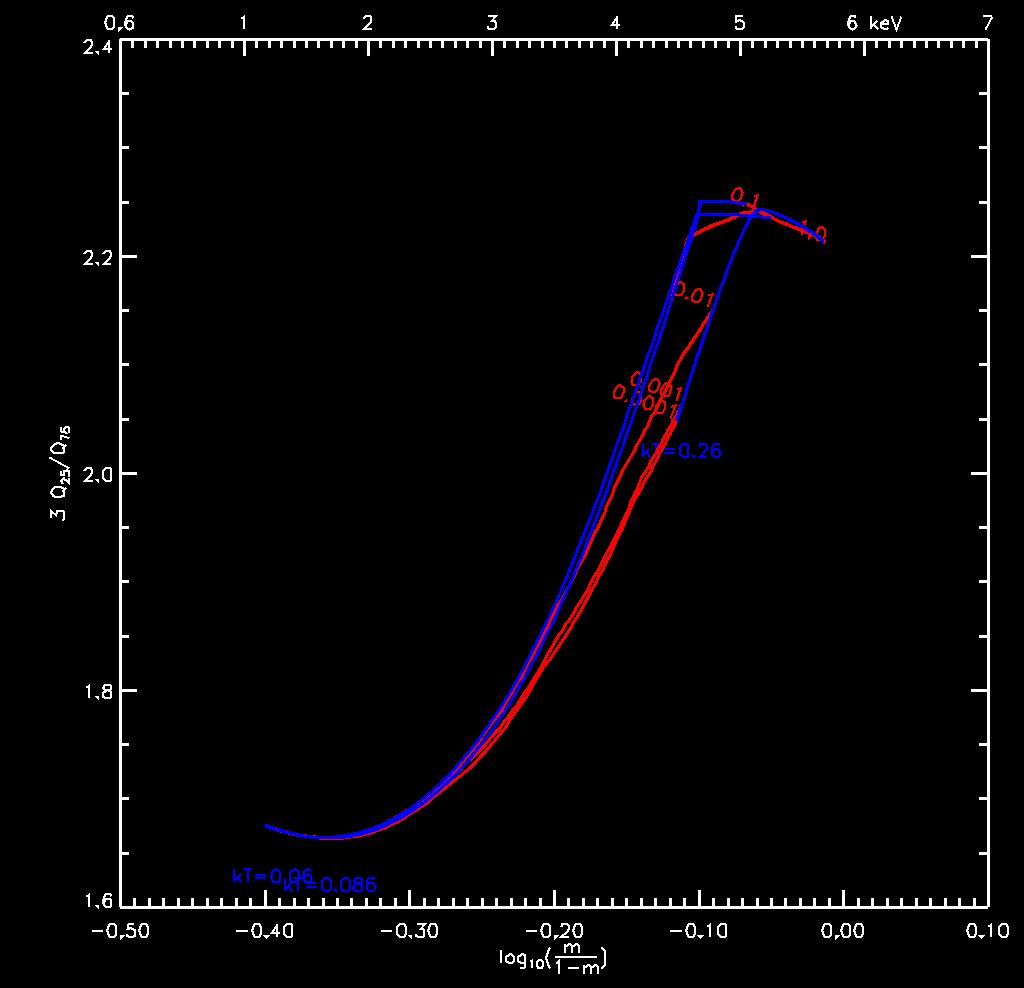
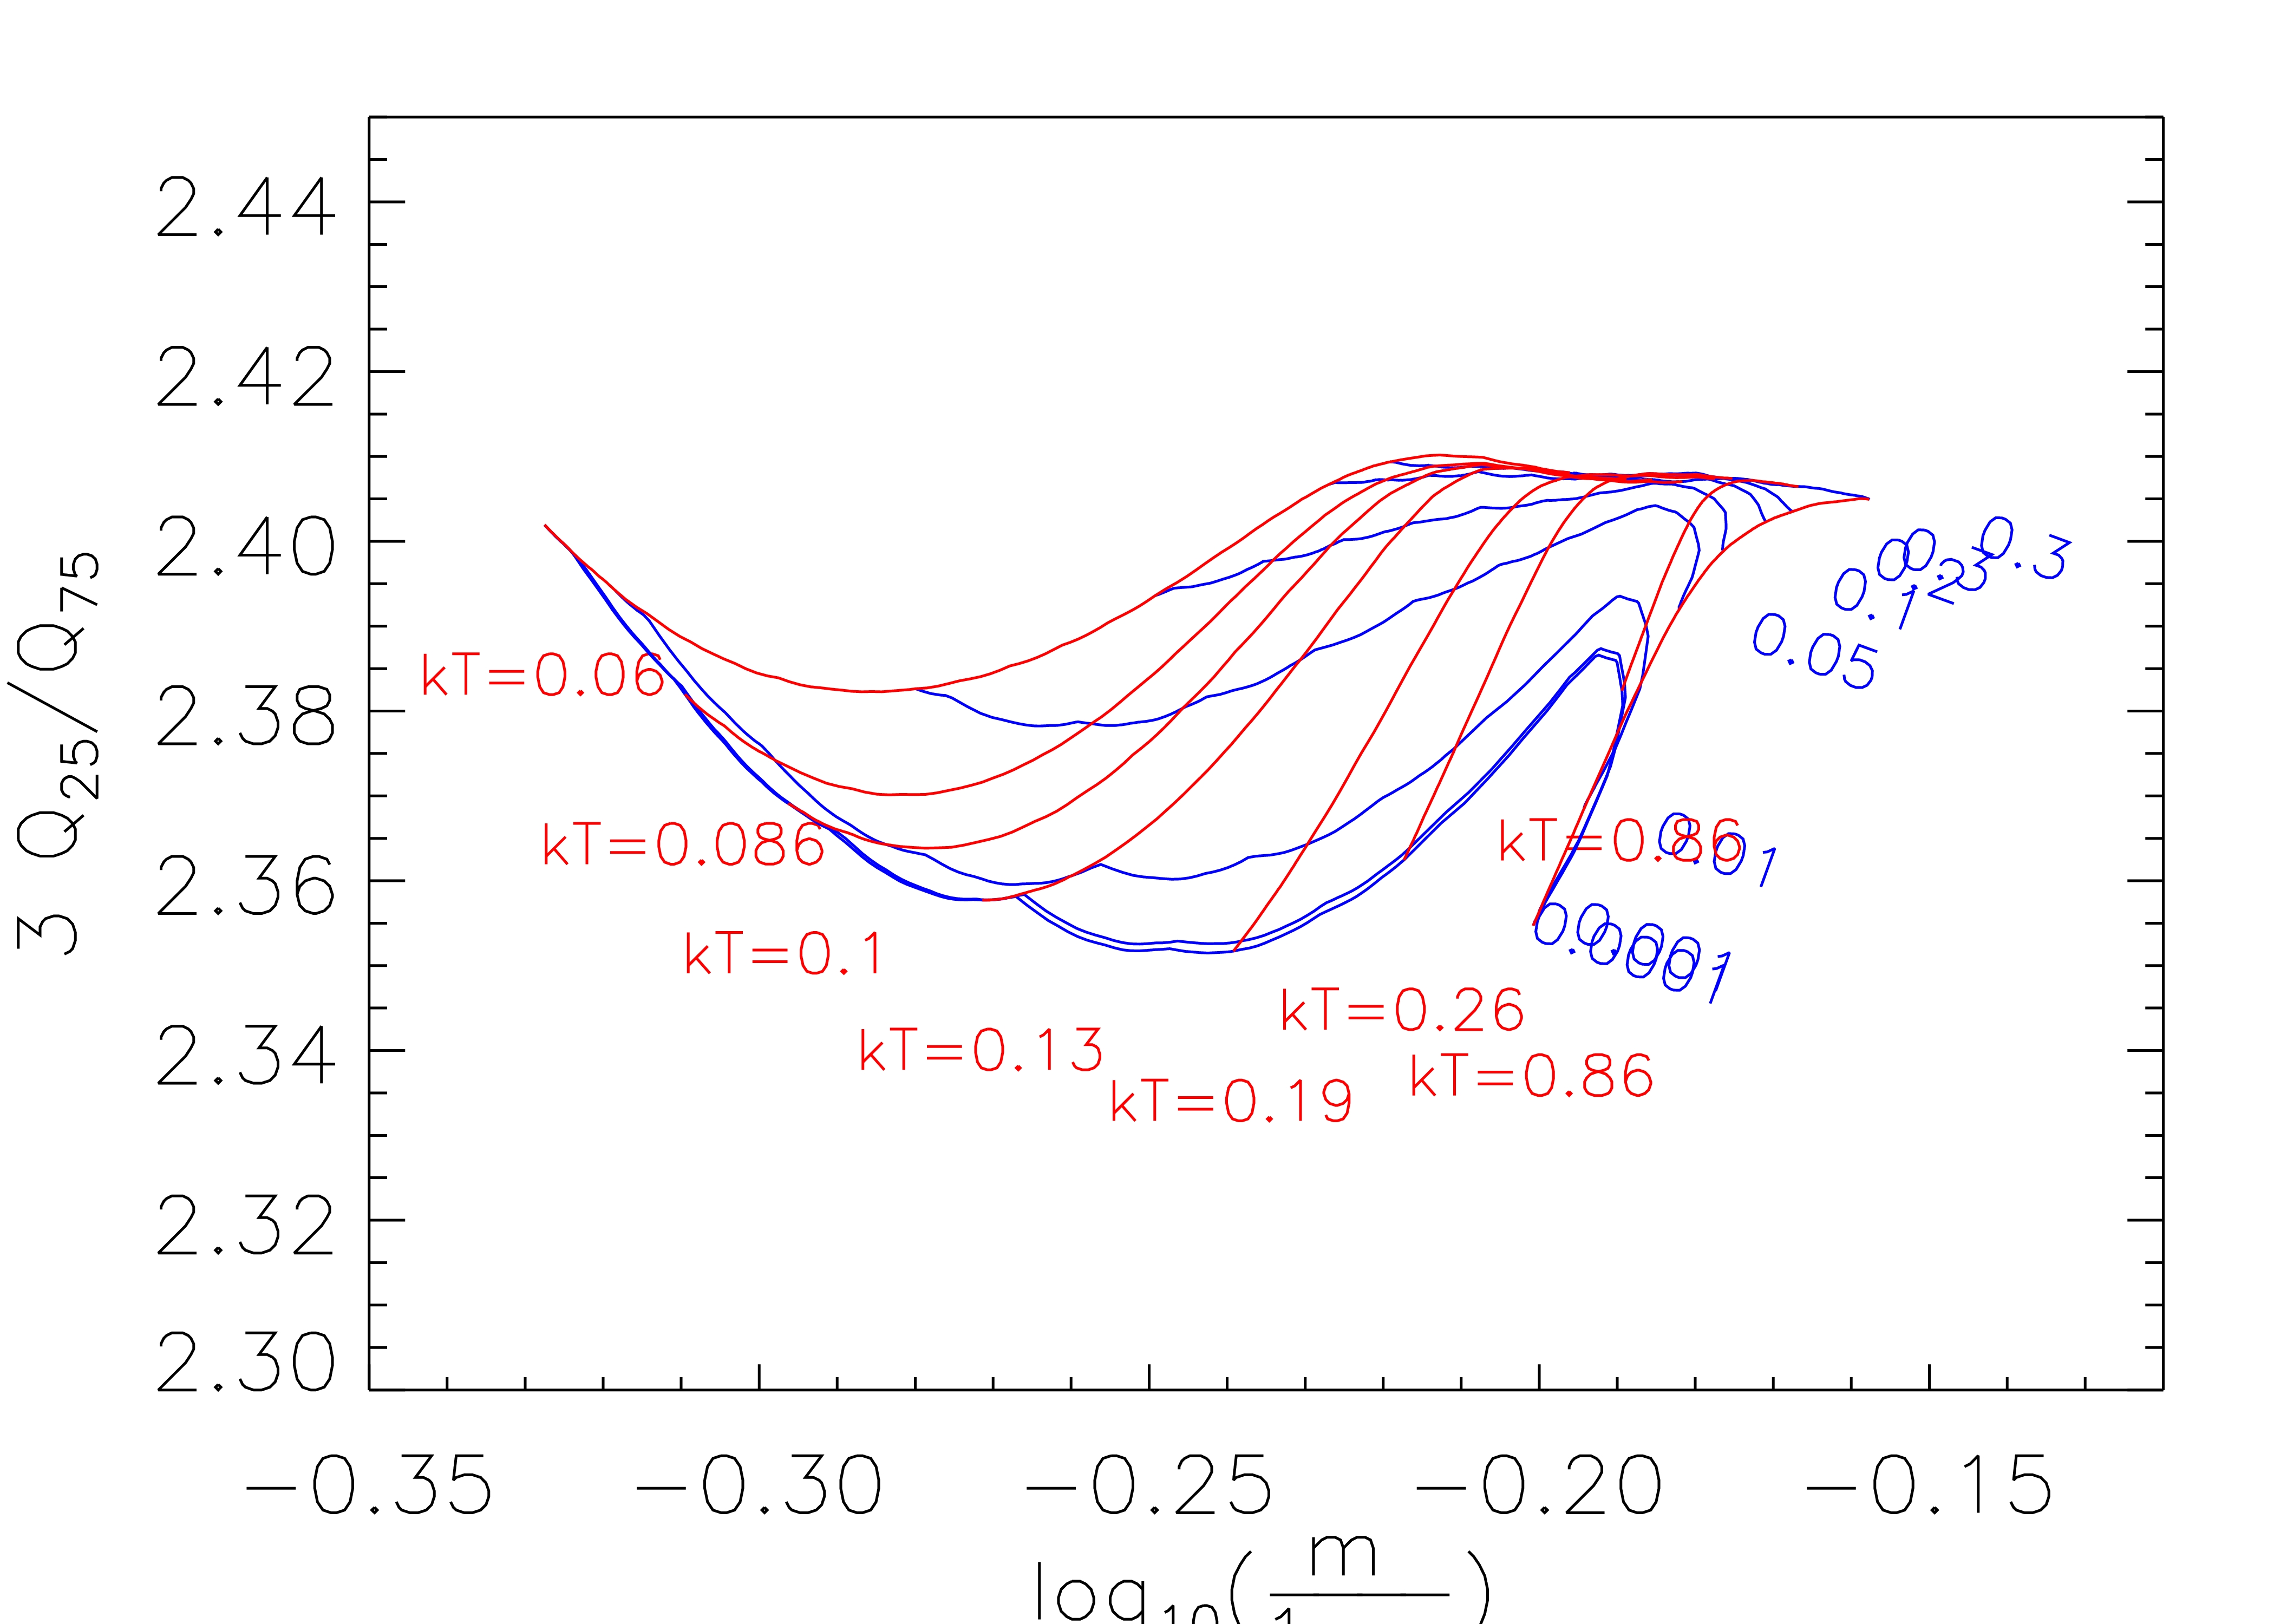
 The quantile-width grid for a Blackbody model, calculated for
various values of the
temperature kT [keV] (yellow loci) and
absorption column NH [1022 cm-2] (red loci).
The quantile-width grid for a Blackbody model, calculated for
various values of the
temperature kT [keV] (yellow loci) and
absorption column NH [1022 cm-2] (red loci).
Vinay Kashyap & Jennifer Posson-Brown
November 2006
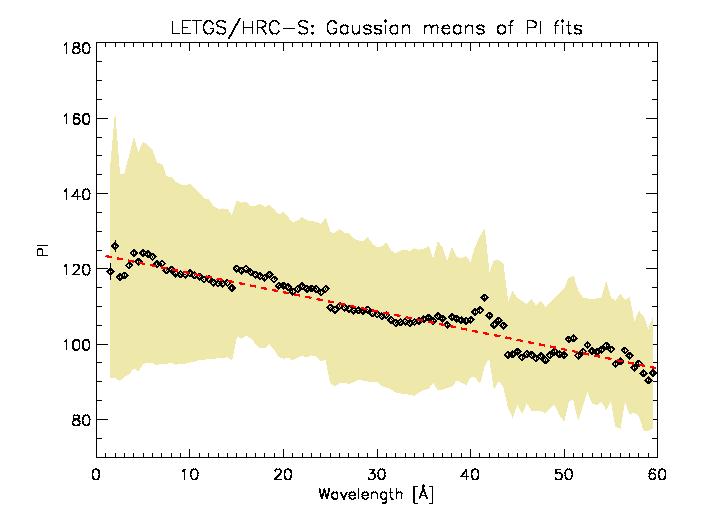 Results of fitting Gaussians to wavelength "slices" of co-added
HRC-S/LETG observations of RXJ1856, PKS 2155-304, Capella, V4743Sgr,
and Mkn 421. The best-fits means are shown by diamond
points, with one sigma error bars. The shaded region shows the best-fit
Gaussian sigmas. The dashed line shows a linear fits to the means. We
constructed the RMF from this linear fit.
Results of fitting Gaussians to wavelength "slices" of co-added
HRC-S/LETG observations of RXJ1856, PKS 2155-304, Capella, V4743Sgr,
and Mkn 421. The best-fits means are shown by diamond
points, with one sigma error bars. The shaded region shows the best-fit
Gaussian sigmas. The dashed line shows a linear fits to the means. We
constructed the RMF from this linear fit.
Here we provide grids in hardness-ratio and quantile-width spaces for some common spectral models, as calculated using the HRC-S RMF derived above and a nominal on-axis ARF (v2.2). The grids were calculated using Sherpa. For the hardness ratio, we choose three bands in PI,
 The color-color grid for a powerlaw model, calculated for
various values of the
powerlaw index Gamma (green loci) and
absorption column NH [1022 cm-2] (yellow loci).
The color-color grid for a powerlaw model, calculated for
various values of the
powerlaw index Gamma (green loci) and
absorption column NH [1022 cm-2] (yellow loci).
 The color-color grid for a MEKAL model, calculated for
relatively low values of the plasma temperature kT [keV] (green loci) and
absorption column NH [1022 cm-2] (yellow loci).
The color-color grid for a MEKAL model, calculated for
relatively low values of the plasma temperature kT [keV] (green loci) and
absorption column NH [1022 cm-2] (yellow loci).
 The color-color grid for a MEKAL model, calculated for
relatively high values of the plasma temperature kT [keV] (green loci) and
absorption column NH [1022 cm-2] (yellow loci).
The color-color grid for a MEKAL model, calculated for
relatively high values of the plasma temperature kT [keV] (green loci) and
absorption column NH [1022 cm-2] (yellow loci).
 The color-color grid for a Blackbody model, calculated for
various values of the
temperature kT [keV] (green loci) and
absorption column NH [1022 cm-2] (yellow loci).
The color-color grid for a Blackbody model, calculated for
various values of the
temperature kT [keV] (green loci) and
absorption column NH [1022 cm-2] (yellow loci).
 The quantile-width grid for a powerlaw model, calculated for
various values of the
powerlaw index Gamma (red loci) and
absorption column NH [1022 cm-2] (blue loci).
The quantile-width grid for a powerlaw model, calculated for
various values of the
powerlaw index Gamma (red loci) and
absorption column NH [1022 cm-2] (blue loci).
 The quantile-width grid for a MEKAL model, calculated for
a variety of plasma temperature kT [keV] (red loci) and
absorption column NH [1022 cm-2] (blue loci).
The quantile-width grid for a MEKAL model, calculated for
a variety of plasma temperature kT [keV] (red loci) and
absorption column NH [1022 cm-2] (blue loci).
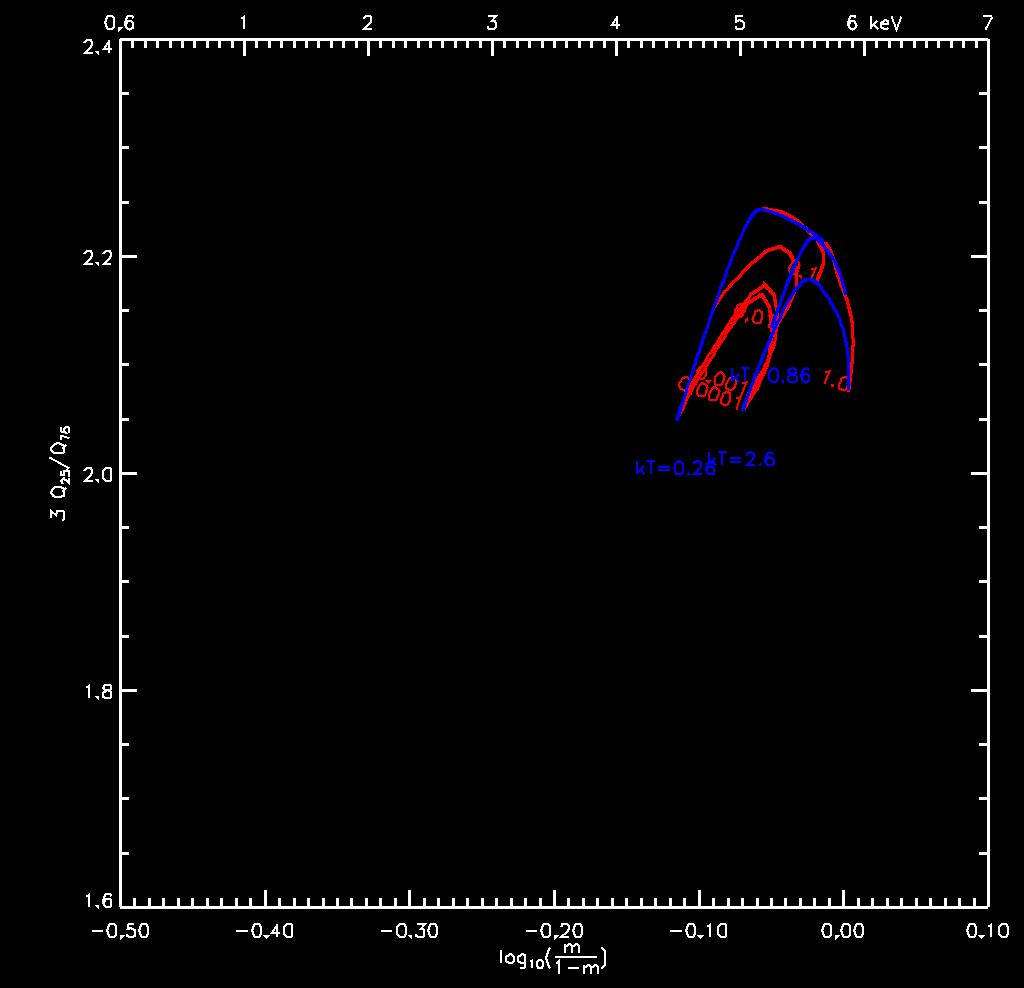
 The quantile-width grid for a Blackbody model, calculated for
various values of the
temperature kT [keV] (red loci) and
absorption column NH [1022 cm-2] (blue loci).
The quantile-width grid for a Blackbody model, calculated for
various values of the
temperature kT [keV] (red loci) and
absorption column NH [1022 cm-2] (blue loci).
We thank Hong Jae Sub, Doug Burke, and Andreas Zezas for assistance with generating the grids, Peter Freeman for useful discussions on the structure of RMFs, and Brad Wargelin for help with generating the HRC-S RMF.
Last modified: 09/25/12
|
The Chandra X-Ray
Center (CXC) is operated for NASA by the Smithsonian Astrophysical Observatory. 60 Garden Street, Cambridge, MA 02138 USA. Email: cxcweb@head.cfa.harvard.edu Smithsonian Institution, Copyright © 1998-2004. All rights reserved. |