| CCD0 | CCD1 | CCD2 | CCD3 | CCD4 | CCD5 | CCD6 | CCD7 | CCD8 | CCD9 | |
|---|---|---|---|---|---|---|---|---|---|---|
| Previously Unknown Bad Pixels | (52,386) | |||||||||
| Current Warm Pixels | (143,700) (154,9) | (802,665) (910,239) | (178,149) (526,66) (726,537) | (21,95) | (335,412) | |||||
| Flickering Warm Pixels | (427,125) | (665,25) | (670,387) (1000,214) (884,31) | (275,393) | ||||||
| Current Hot Pixels | ||||||||||
| Flickering Hot Pixels | ||||||||||
| Warm column candidates | 512 1022 510 | 512 1022 | ||||||||
| Flickering Warm column candidates |
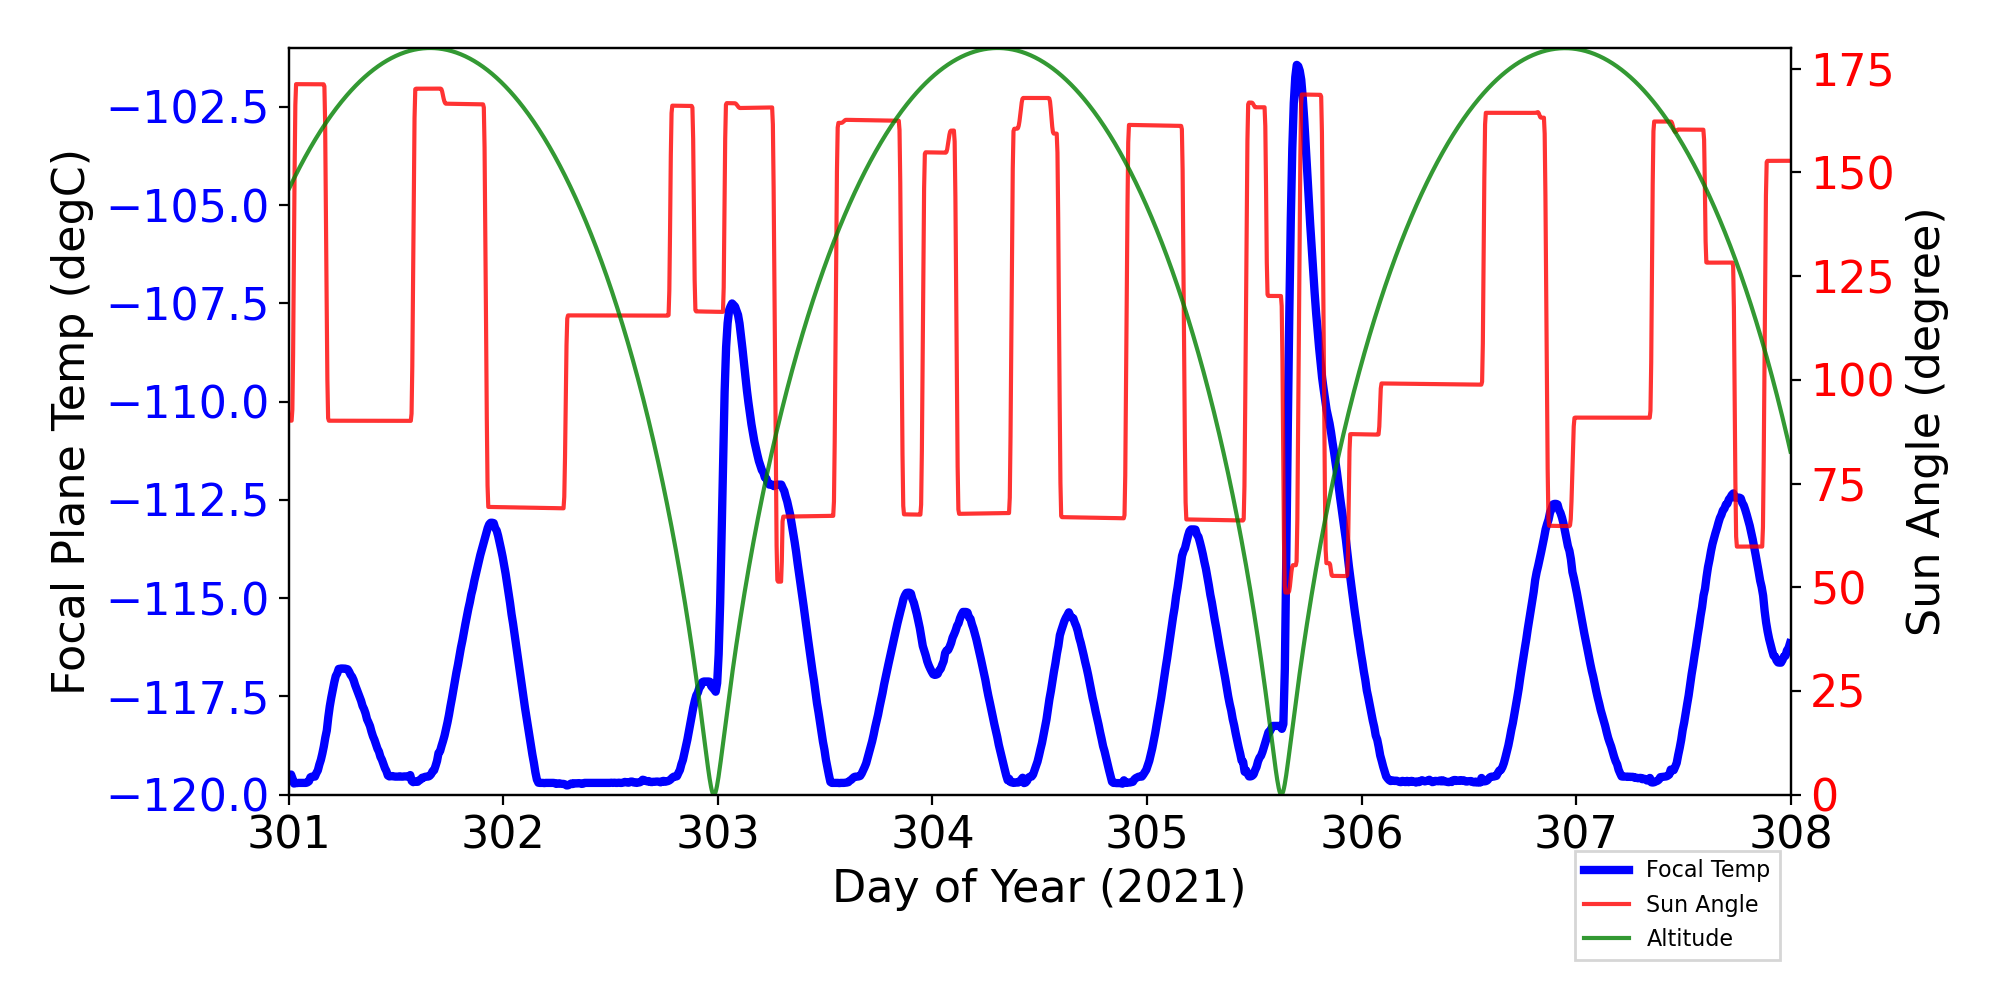
ACIS Focal Plane Temperature
For this period, 10 peaks are observed.
| Day (DOY) | Temp (C) | Width (Days) | |
|---|---|---|---|
| 301.25 | -116.80 | 0.43 | |
| 301.95 | -113.09 | 0.58 | |
| 303.07 | -107.54 | 0.54 | |
| 303.90 | -114.88 | 0.44 | |
| 304.16 | -115.36 | 0.34 | |
| 304.64 | -115.45 | 0.42 | |
| 305.23 | -113.25 | 0.55 | |
| 305.70 | -101.47 | 0.51 | |
| 306.91 | -112.61 | 0.65 | |
| 307.74 | -112.44 | 0.50 |
Weekly focal plane temperature with sun angle, earth angle, and altitude overplotted. Sun angle is the solar array angle, that is the angle between the sun and the optical axis (+X axis). The earth angle is the angle between earth and the ACIS radiator (+Z axis). Altitude varies from 34 kkm to 128 kkm.
SIM Movements
8 TSC moves this period
| weekly average time/step | 0.00136 s |
|---|---|
| mission average time/step | 0.00132 s |
Telemetry
New violations or new extrema are shown in blue cells.
| MSID | 10/29/21 | 10/30/21 | 10/31/21 | 11/01/21 | 11/02/21 | 11/03/21 | 11/04/21 | yellow limits (lower) upper | red limits (lower) upper | Units | Description |
| ELBI | 66.09 | (20.0) 60.0 |
(13.0) 66.0 |
AMP | LOAD BUS CURRENT (HIGH RANGE) | ||||||
| ESAMYI | (0.06) | (0.06) | (0.06) | (6.0) 27.0 |
(5.62) 33.0 |
AMP | S/A -Y CURRENT | ||||
| OBADIAGRAD | 4.16 | 4.07 | 4.33 | 4.34 | 4.30 | 4.28 | 4.14 | (-1.11) 3.5 |
(-2.78) 3.9 |
K | OBA DIAM GRAD |
| OBACONEAVG | 305.45 | 302.42 | 301.39 | 306.48 | 305.82 | 304.00 | (282.5) 300.0 |
(281.8) 301.0 |
K | OBA CONE AVG TEMP | |
| TSCTSF3 | (267.70) | (268.06) | (268.06) | (267.70) | (278.15) 359.15 |
(269.15) 483.15 |
K | SC-TS FITTING -3 TEMP | |||
| OBAAVG | 303.60 | 301.89 | 302.53 | 302.01 | (282.5) 300.0 |
(281.4) 301.0 |
K | OBA/TFTE TEMP | |||
| MZOBACONE | 309.89 | 308.93 | 308.38 | (260.2) 303.0 |
(250.2) 308.0 |
CONE | -Z SIDE OBA CONE | ||||
| CTXBPWR | (0.00) | (0.00) | (36.12) 37.0 |
(36.0) 38.0 |
DBM | TRANSMITTER B OUTPUT POWER | |||||
| TCM_TX1 | (268.79) | (268.43) | (268.79) | (267.70) | (283.15) 348.15 |
(269.15) 404.15 |
K | TRANSPONDER-1 EXT BPL TEMP | |||
| HRMAAVG | 309.26 | 309.28 | 309.03 | (306.0) 308.0 |
(305.0) 309.0 |
K | AVG OF HRMA METRICS |
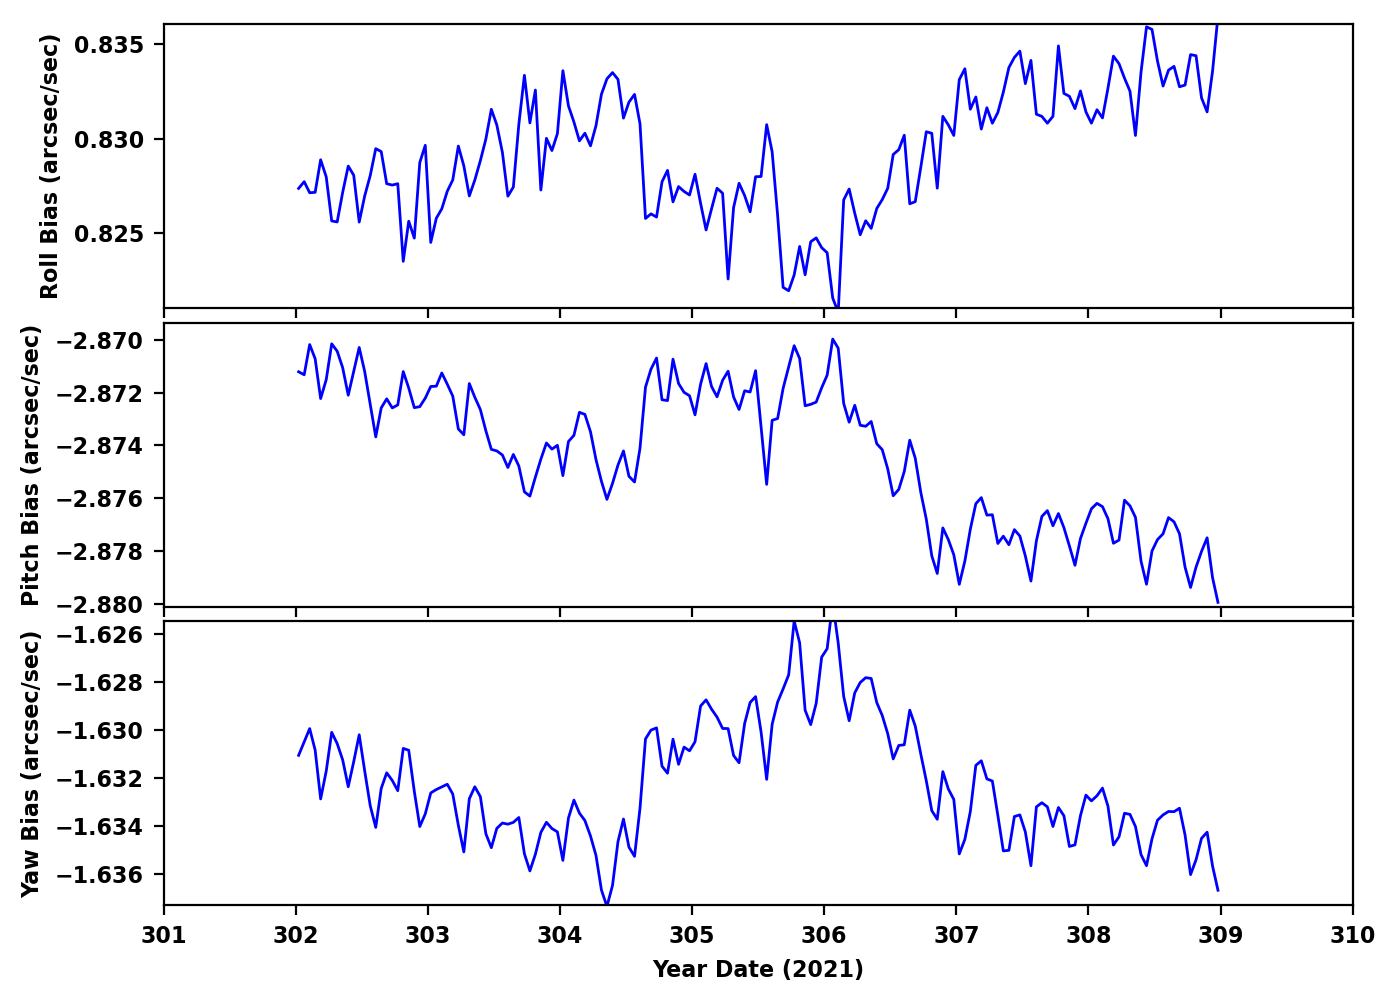
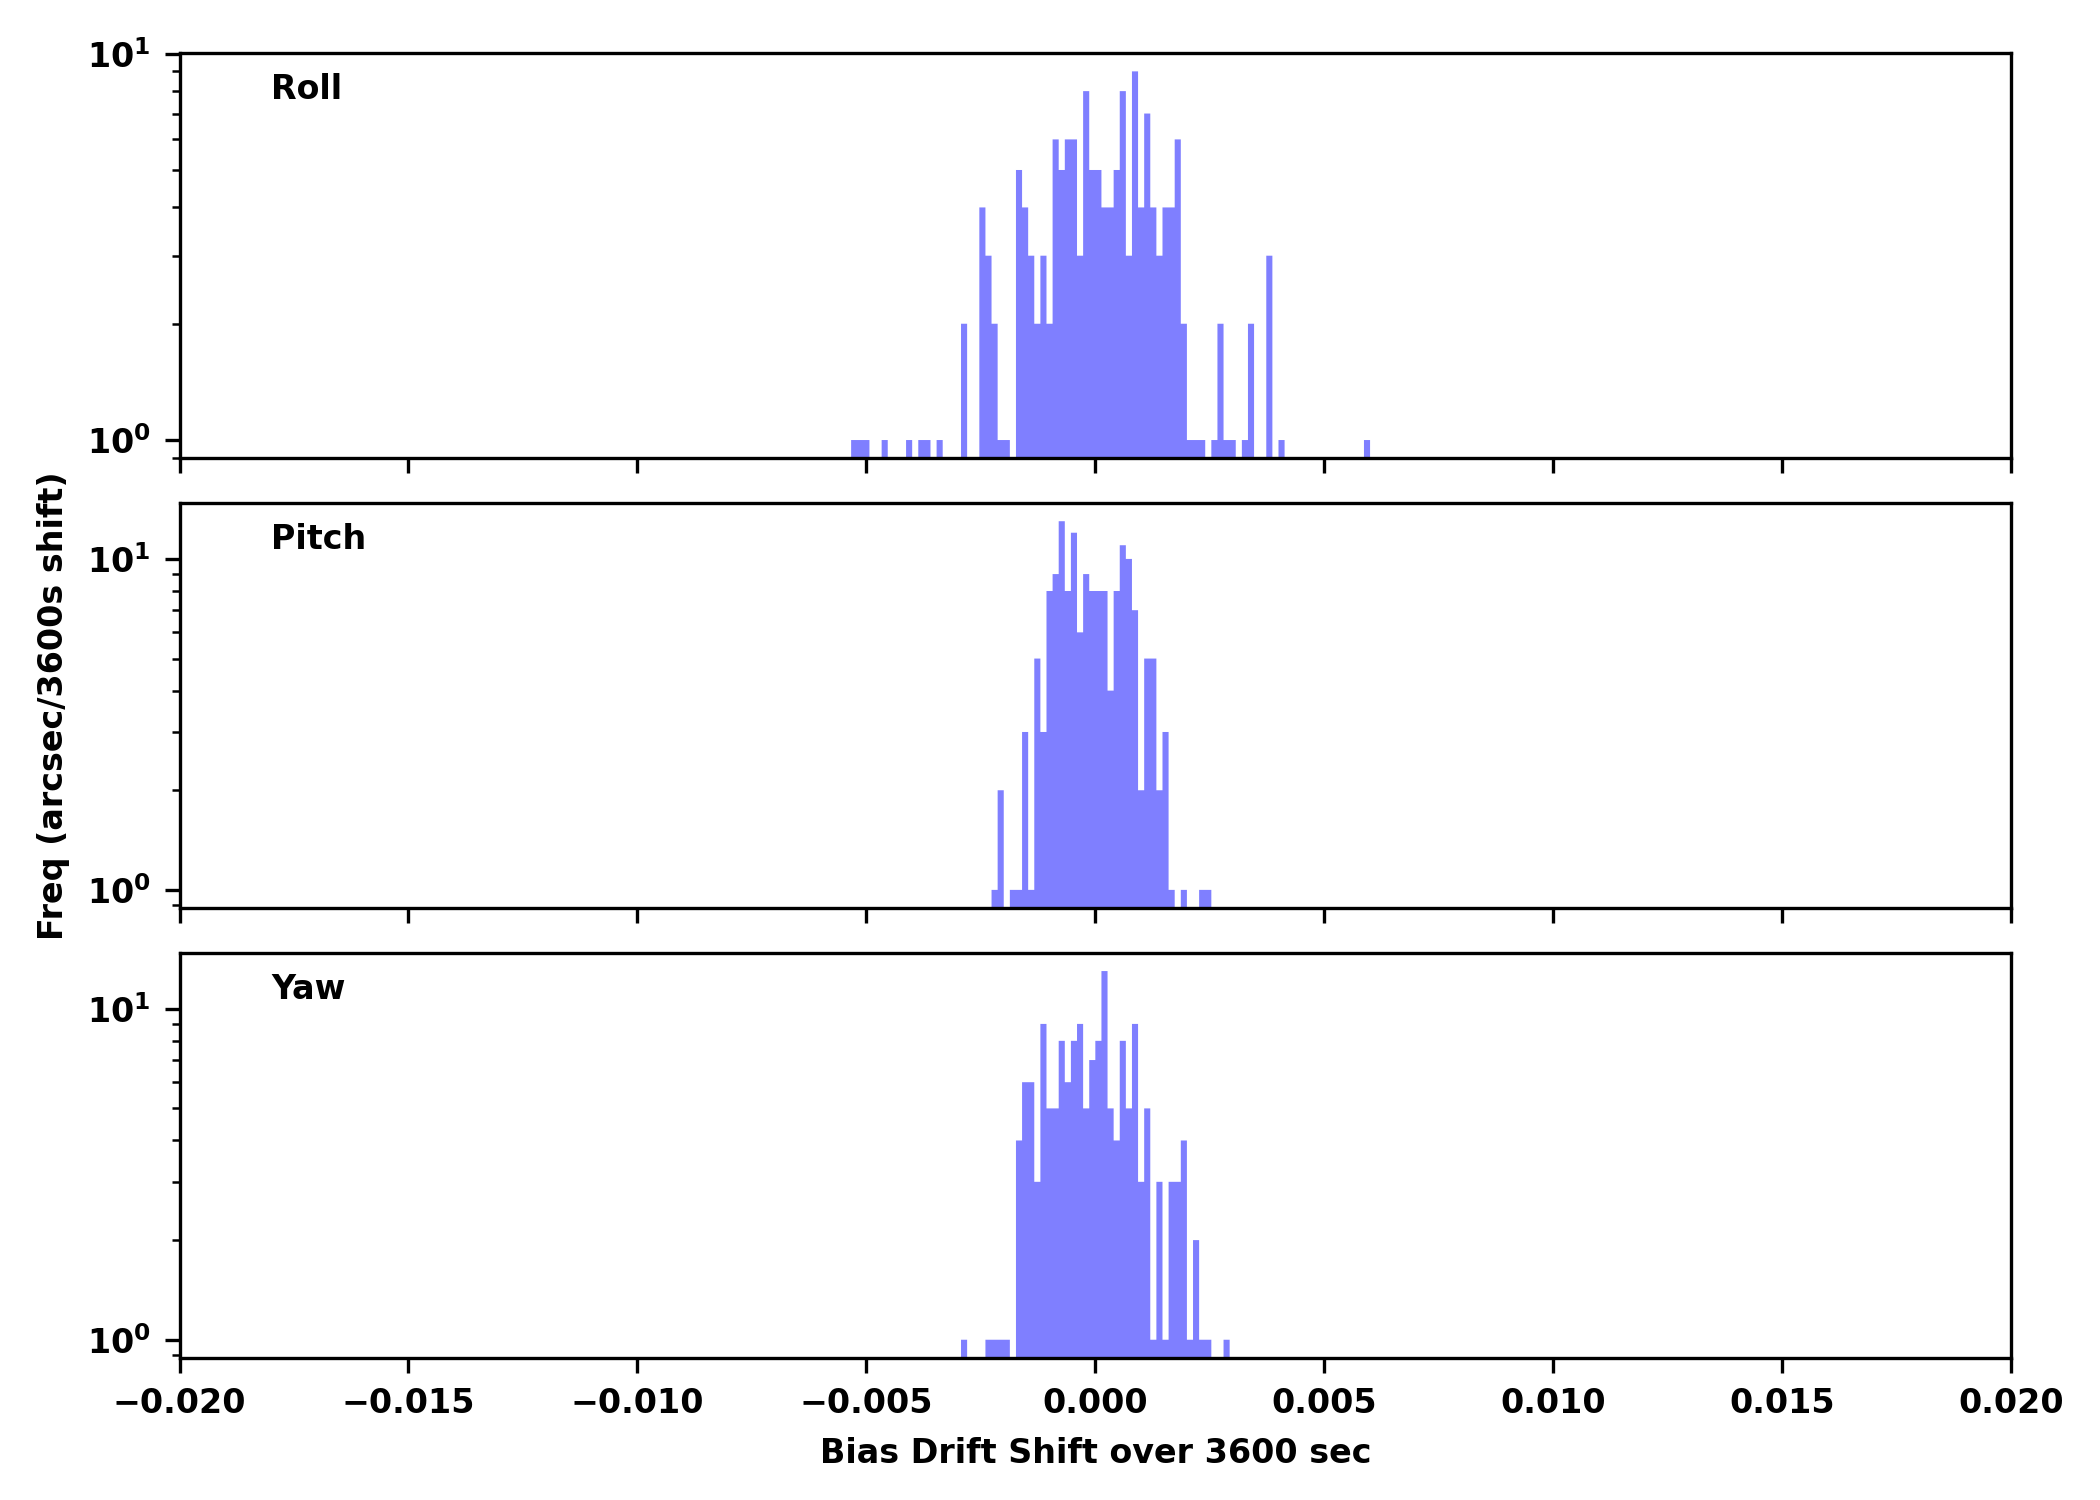
IRUs
| Gyro Bias Drift | Gyro Bias Drift Histogram |
|---|---|
|
|
Recent Observations
| OBSID | DETECTOR | GRATING | TARGET | ANALYSIS | ACA |
|---|---|---|---|---|---|
| 26166 | ACIS-0123 | NONE | RMJ022905.6+043003.1 | OK | OK |
| 23579 | ACIS-7 | NONE | GRB211023B | OK | OK |
| 26183 | ACIS-7 | NONE | IGR J02341+0228 | OK | OK |
| 26169 | ACIS-7 | NONE | MAXI J1848-015 | OK | OK |
| 26187 | ACIS-7 | NONE | MAXI J1848-015 | OK | OK |
| 26186 | ACIS-0123 | NONE | RMJ010721.8+141623.6 | OK | OK |
| 25295 | ACIS-23567 | NONE | ESO 528-G 036 | OK | OK |
| 23856 | ACIS-01236 | NONE | SPT-CLJ2355-6002 | OK | OK |
| 25444 | ACIS-23678 | NONE | NGC 1090 | OK | OK |
| 25459 | ACIS-23678 | NONE | NVSS J003659+183203 | OK | OK |
| 23458 | ACIS-7 | NONE | MAXI J1848-015 | OK | OK |
| 26067 | ACIS-0123 | NONE | PSZ2G176.25-52.57 | OK | OK |
| 25460 | ACIS-678 | NONE | B2 0135+29 | OK | OK |
| 25061 | ACIS-3678 | NONE | SNR 0519-69.0 | OK | OK |
| 25464 | ACIS-678 | NONE | B3 1520+437 | OK | OK |
| 24481 | ACIS-5678 | HETG | 4U0114+65 | OK/NA | OK |
| 25179 | ACIS-7 | NONE | SN1986J | OK | OK |
| 26174 | ACIS-678 | NONE | B2.1 0241+30 | Missing | Missing |
| 26116 | ACIS-0123 | NONE | eMACSJ1508.1+5755 | OK | OK |
| 26180 | ACIS-456789 | HETG | 4U0114+65 | OK/NA | OK |
Trending
This week's focus is Gratings
Last reported on
Aug 19.
Only the most interesting or representative msids are shown below.
For a full listing choose the bulletted link.
| MSID | Mean | RMS | Delta/Yr | Delta/Yr/Yr | Unit | Description | |
|---|---|---|---|---|---|---|---|
| 4hposaro | -0.010 | 0.033 | 68.52 +/- 19.85 | 1.17 +/- 0.94 | na | NA | |
| 4hposbro | -0.005 | 0.033 | 69.11 +/- 20.07 | 1.18 +/- 0.95 | na | NA | |
| 4lposaro | 0.013 | 0.021 | 73.81 +/- 12.86 | 0.39 +/- 0.56 | na | NA | |
| 4lposbro | 0.022 | 0.022 | 72.88 +/- 13.23 | 0.30 +/- 0.57 | na | NA | |
| 4mp28av | 0.010 | 0.001 | 0.38 +/- 0.72 | 0.00 +/- 0.03 | V | MCE A: +28 VOLT MONITOR | |
| 4mp28bv | 0.064 | 0.005 | 1.88 +/- 3.06 | 0.01 +/- 0.13 | V | MCE B: +28 VOLT MONITOR | |
| 4mp5av | 0.016 | 0.001 | 0.45 +/- 0.74 | 0.01 +/- 0.03 | V | MCE A: +5 VOLT MONITOR | |
| 4mp5bv | 0.011 | 9.126e-04 | 0.34 +/- 0.56 | 0.00 +/- 0.02 | V | MCE B: +5 VOLT MONITOR |
If you have any questions, please contact: swolk@head.cfa.harvard.edu