CIAO and DS9: a powerful pair through DAX
Kenny Glotfelty, Antonella Fruscione
What is DAX (DS9 Analysis EXtension)?
SAOImageDS9 (or DS9 in short) is the popular image display and visualization tool for astronomical data which has been in development at the Smithsonian Astrophysical Observatory since the 1990s (the about DS9 page tells the story from the start) and is now developed within the CIAO (Chandra Interactive Analysis of Observations; Fruscione et al. 2006) system.
Every DS9 user knows the basics: how to load files, display regions, change the color scheme, and adjust the scaling. However, expert users of DS9 know that there is much more functionality if you dig a little deeper into the menu hierarchy: for example the ability to access archive servers, perform catalog cross matching, visualize plots, just to name a few. This is especially true for CIAO users.
Open the Analysis menu and at the bottom of the list is the CIAO tools (DAX) menu item.
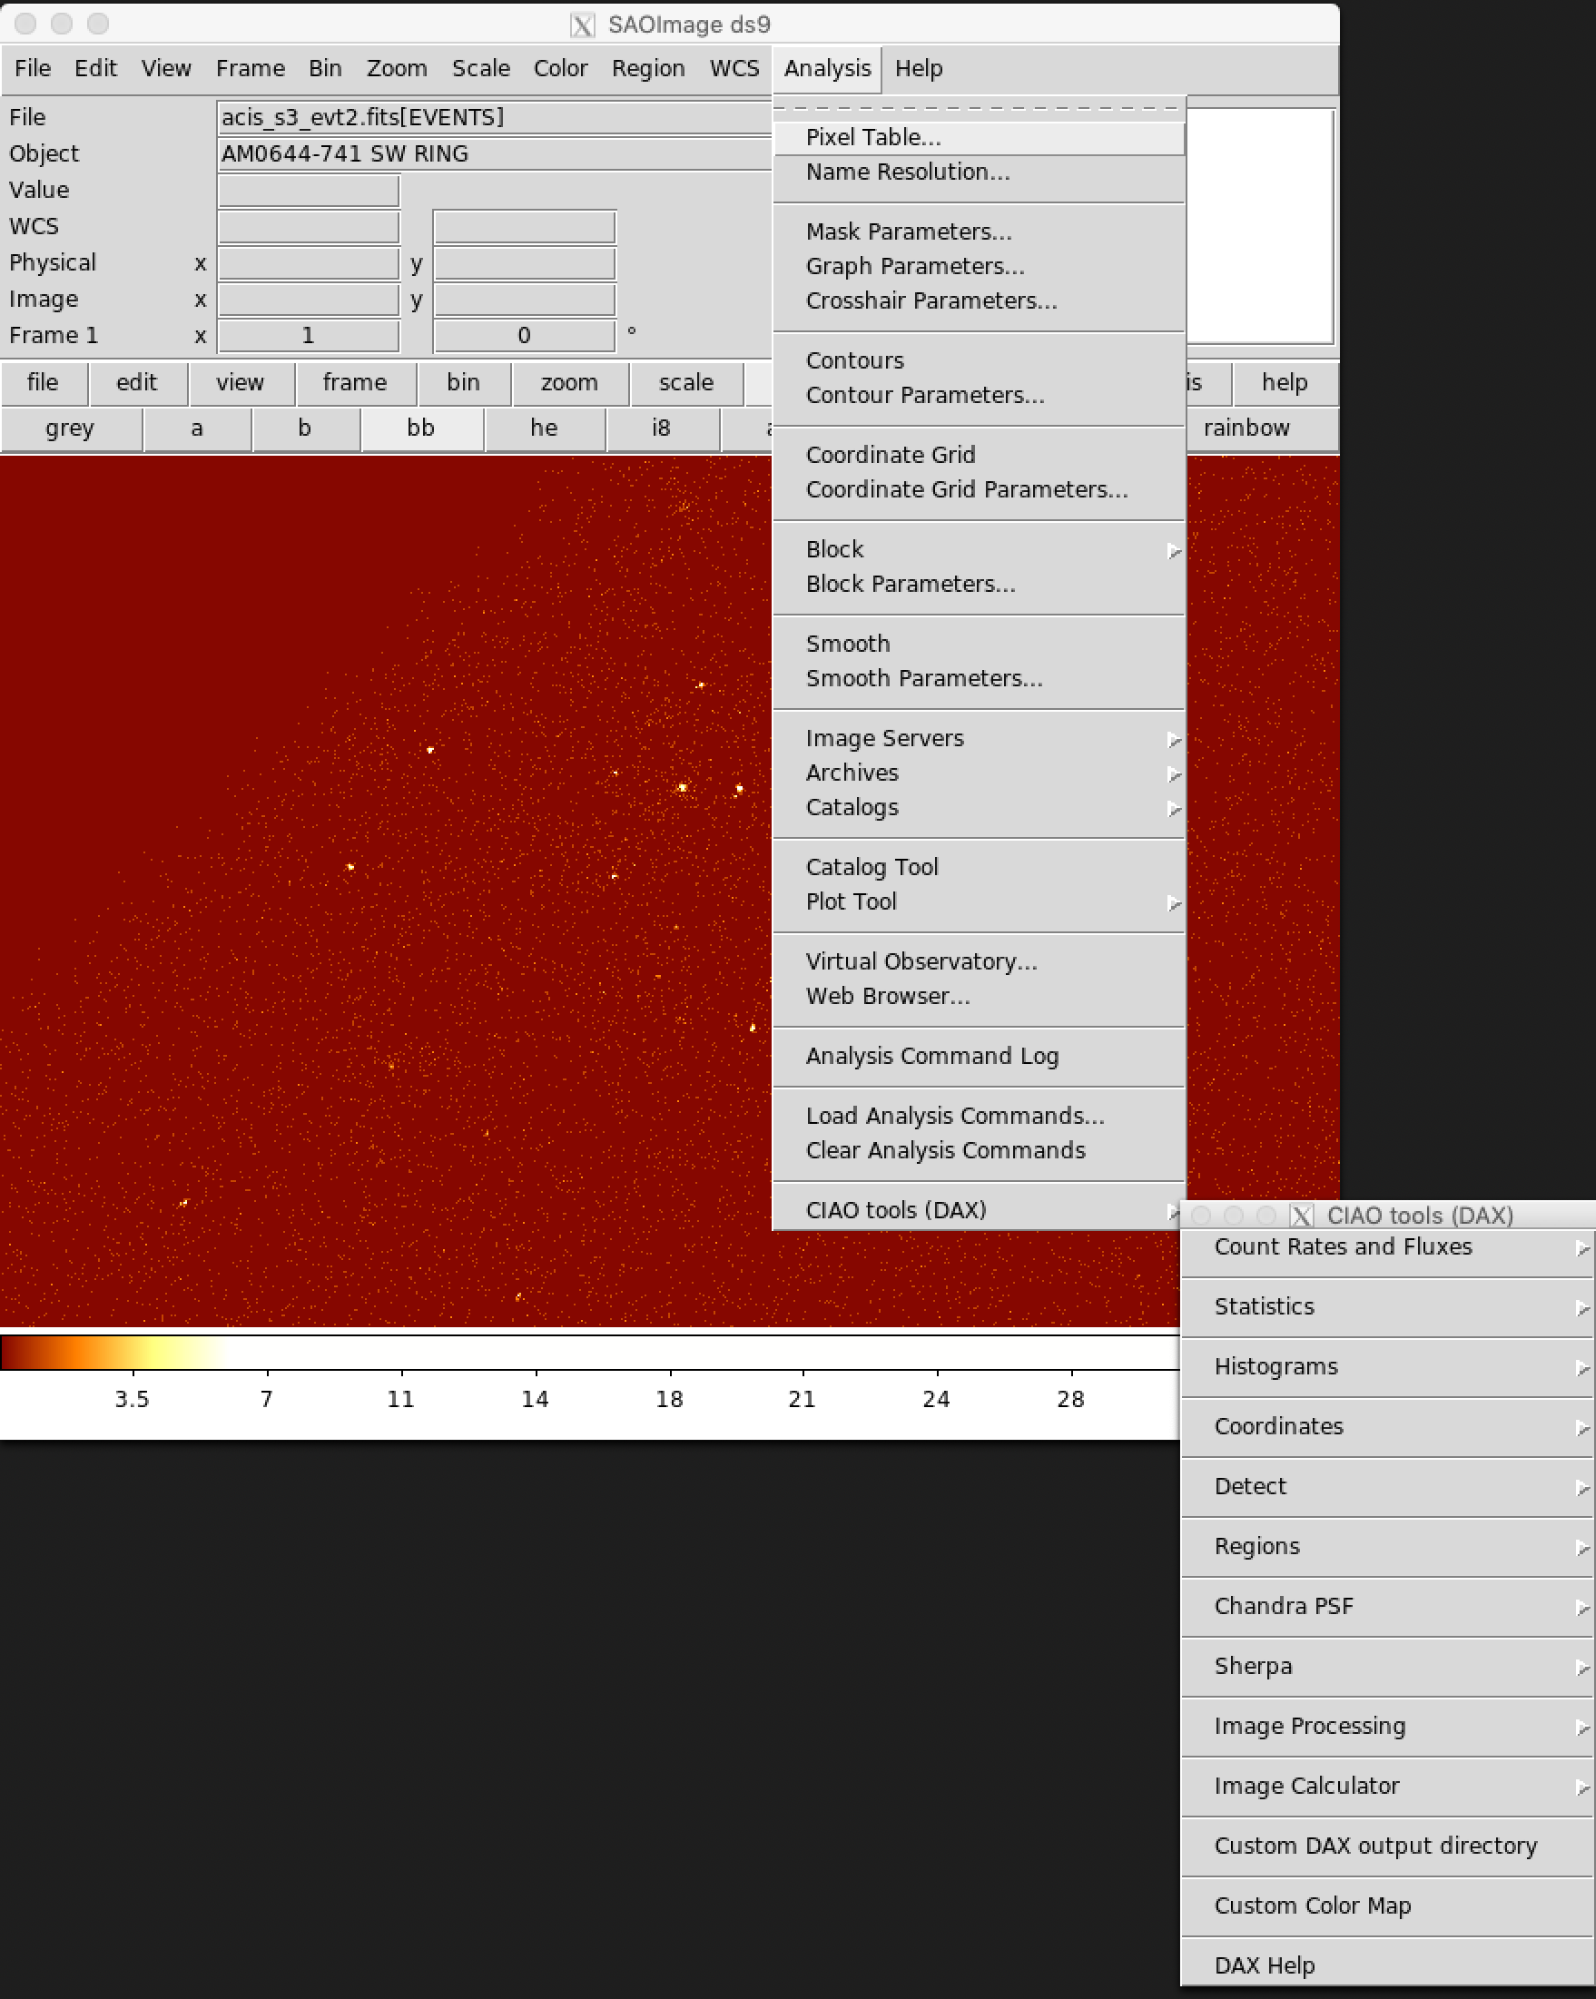
Figure 1: Location of CIAO tools (DAX) in the DS9 environment.
Given its location at the bottom of the menu hierarchy, one might underestimate the functionality it represents. In reality, by expanding the menu, users gain access to a host of CIAO tools that can be run directly from DS9.
With DAX, it is possible to quickly compute net-counts in an image, extract lightcurves, adaptively smooth an image, and even extract spectra and interactively fit it using the Sherpa application. Many CIAO tools are included in the latest major release of DAX (part of the CIAO contributed script release 4.12.4 of 18 September 2020) and the schematic below shows them all (don’t worry, there won’t be a test on this):
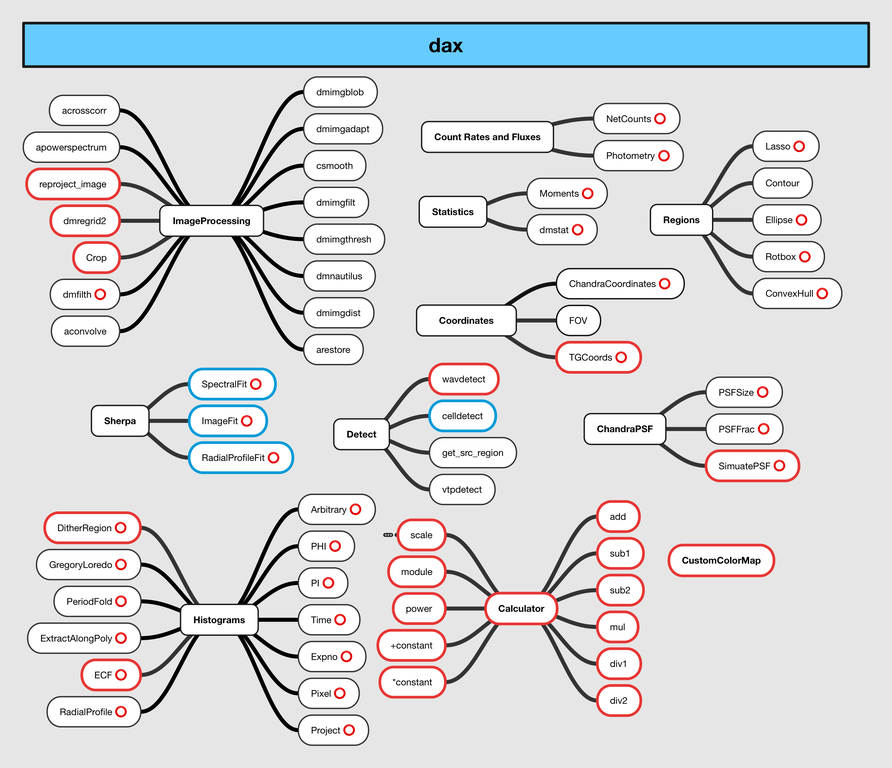
Figure 2: Schematic of the CIAO tools included in the latest major release of DAX. Tasks outlined in red are new to the latest DAX release and those outlined in blue have had significant updates. The small red circles next to a task name indicates that the task either requires or will use region(s) when run.
Each of these DAX tasks runs one or more CIAO tools. The tasks which are outlined in red are new to the latest DAX release, and the tasks outlined in blue have had significant updates. The red circle identifies tasks that either require or will use region(s) when running.
Why DAX?
Sometimes you just want something quick and simple!
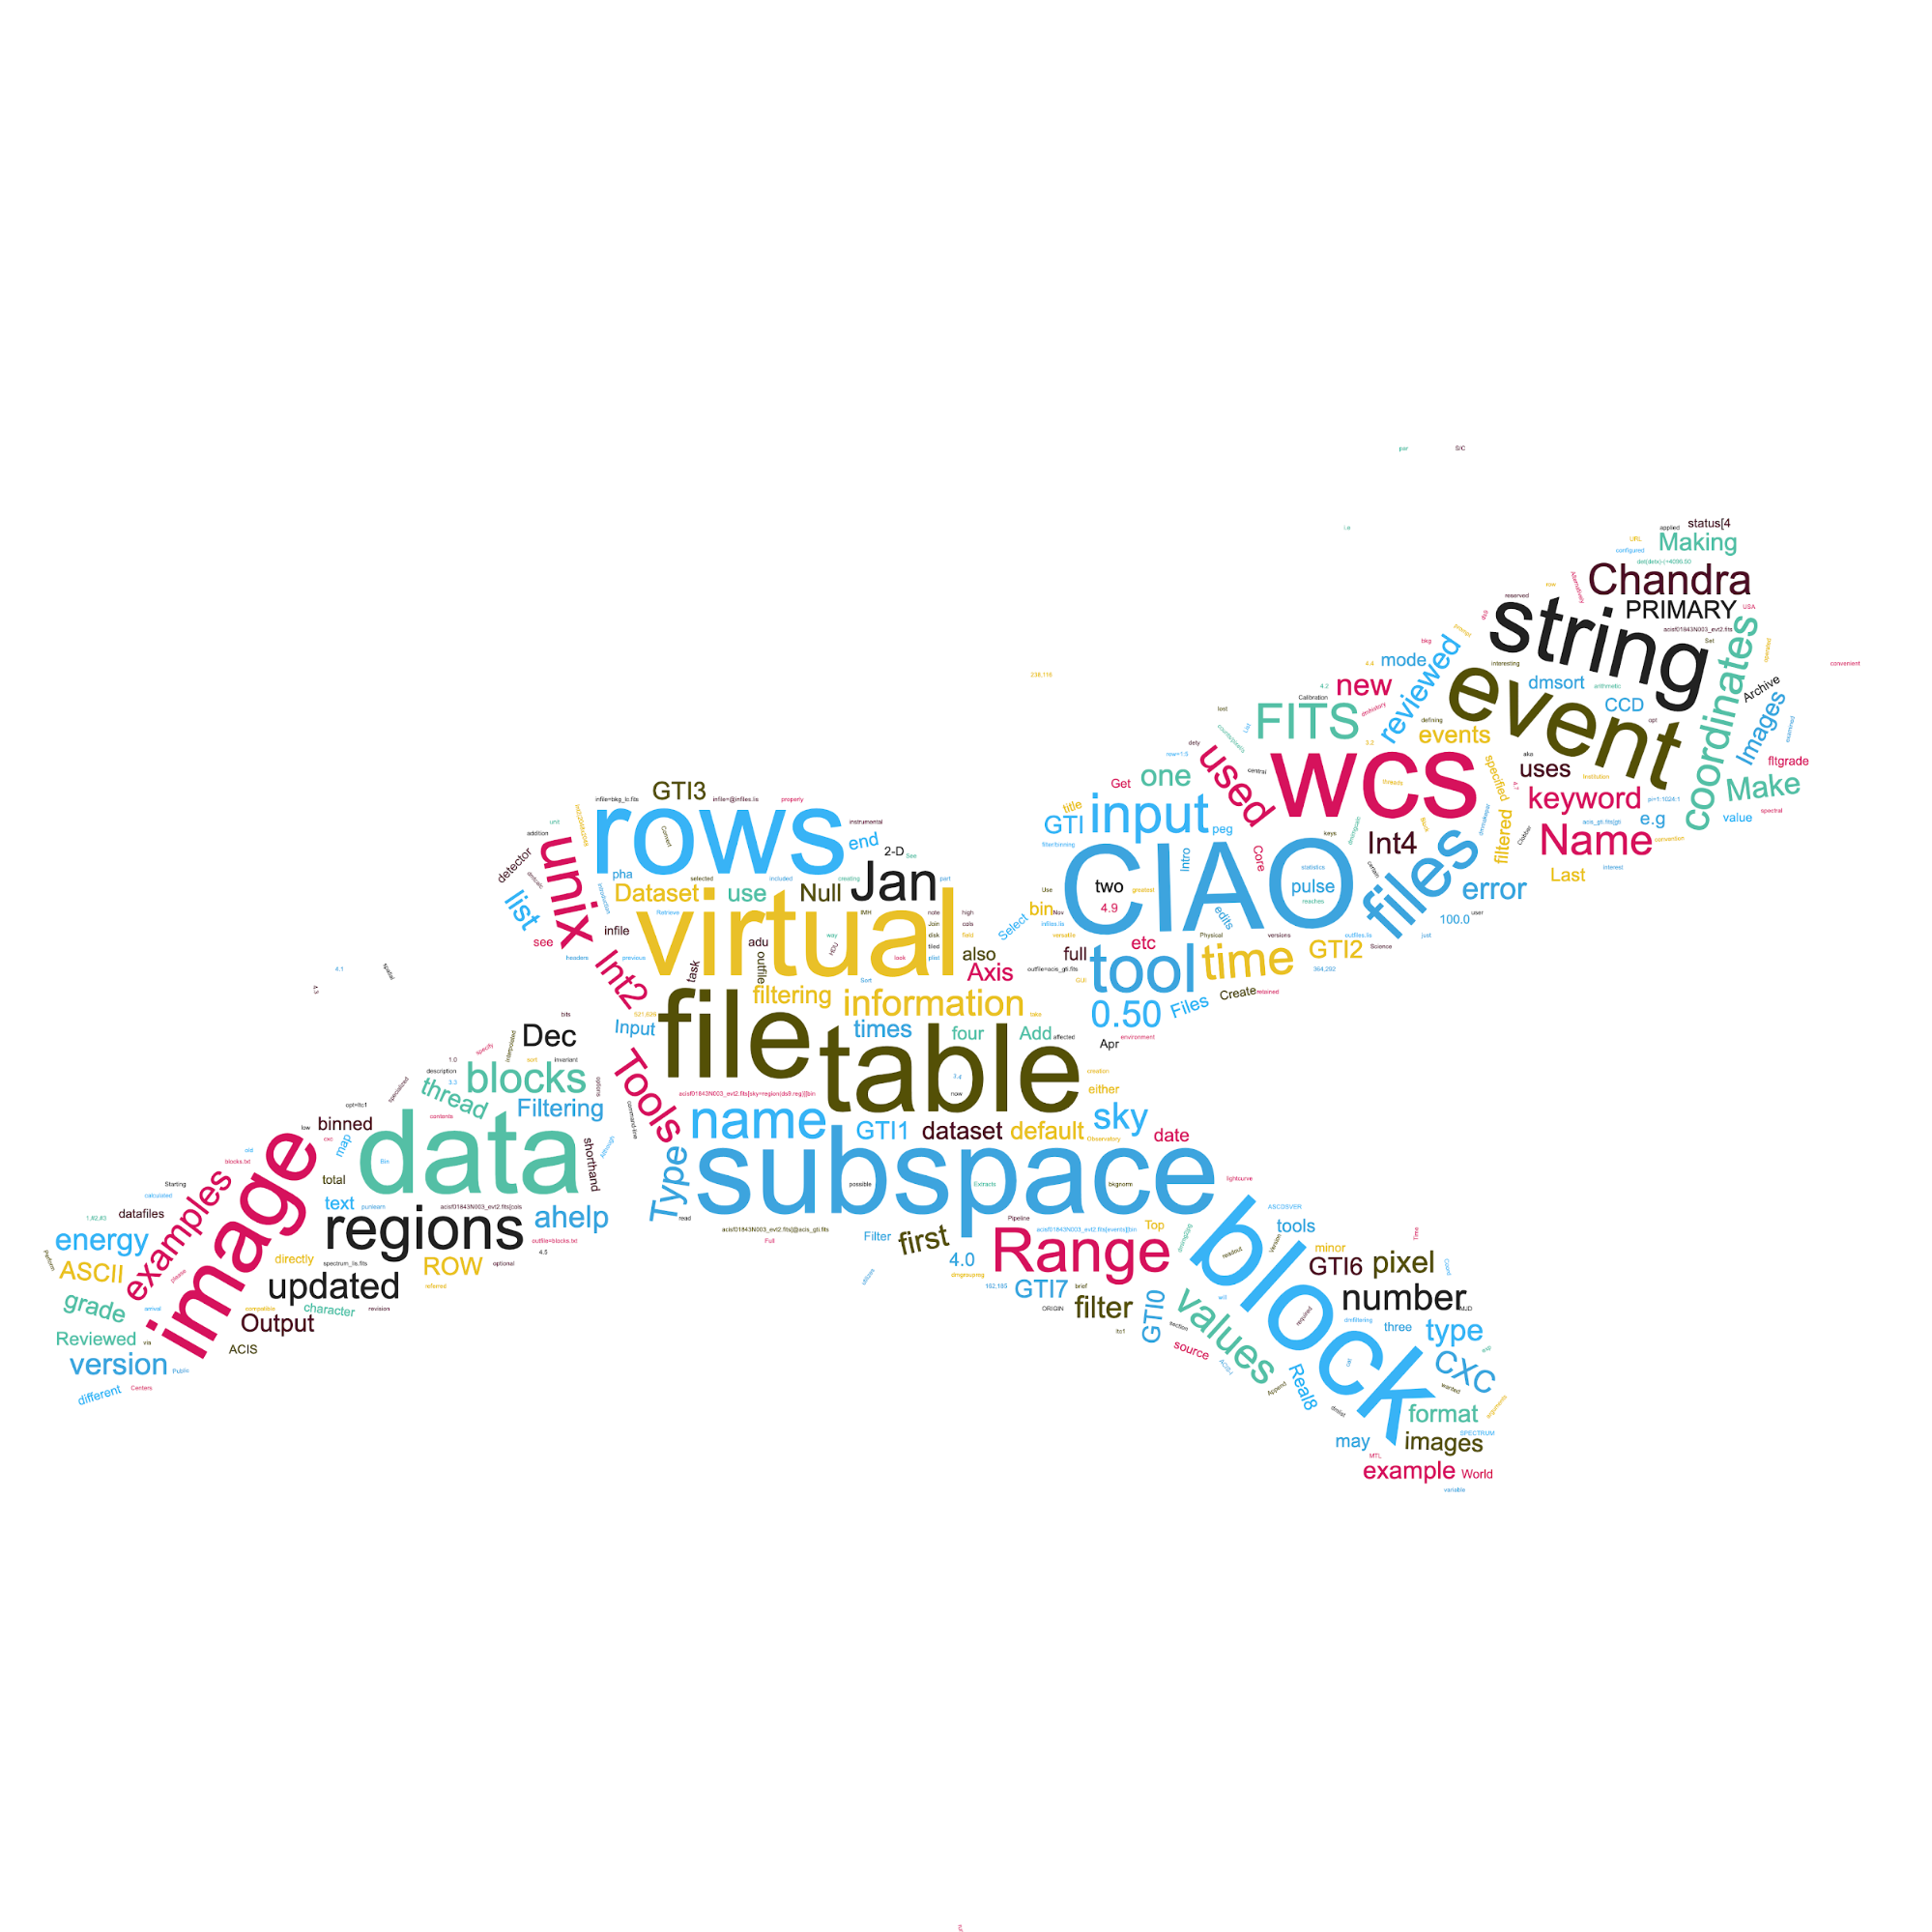
Figure 3: This image shows many of the concepts that a typical user will encounter when using CIAO. While some of the concepts are generic (“image”), some are specific to X-ray data analysis (“event”), or even more specific to CIAO data analysis (“subspace”). The large number of unique concepts in the CIAO vocabulary is a significant stumbling block for many new users. DAX provides a simplified interface which lowers this hurdle.
CIAO is a very powerful data analysis software package with over 200 tools and applications. The CIAO “Data Model” (DM) is also very powerful with its capability to filter multi-dimensional datasets on-the-fly. All this power and functionality comes at a cost to users: there is a steep learning curve to assimilate the syntax and concepts needed to perform common tasks.
DAX was started as a way to simplify the user experience (Glotfelty et al. 2011) via an easy-to-use and familiar DS9 interface. Users would have access to the core CIAO data analysis tools with a limited set of parameters and without needing to learn the DM’s virtual file syntax. While this simplified approach does inhibit some of the CIAO capabilities, it provides sufficient functionality to perform many common data analysis tasks. We soon realized that DAX could be useful beyond the initial basic tasks and gradually development has expanded to many more sophisticated tasks as shown below.
What is new?
DAX was first released in CIAO 4.1 (December 2008) with approximately 10 tasks. Today there are over 50 different CIAO analysis tasks that can be performed directly from DS9 via DAX. Here we illustrate three:
- Fitting with Sherpa and the new model parameter editor (see Figure 4)
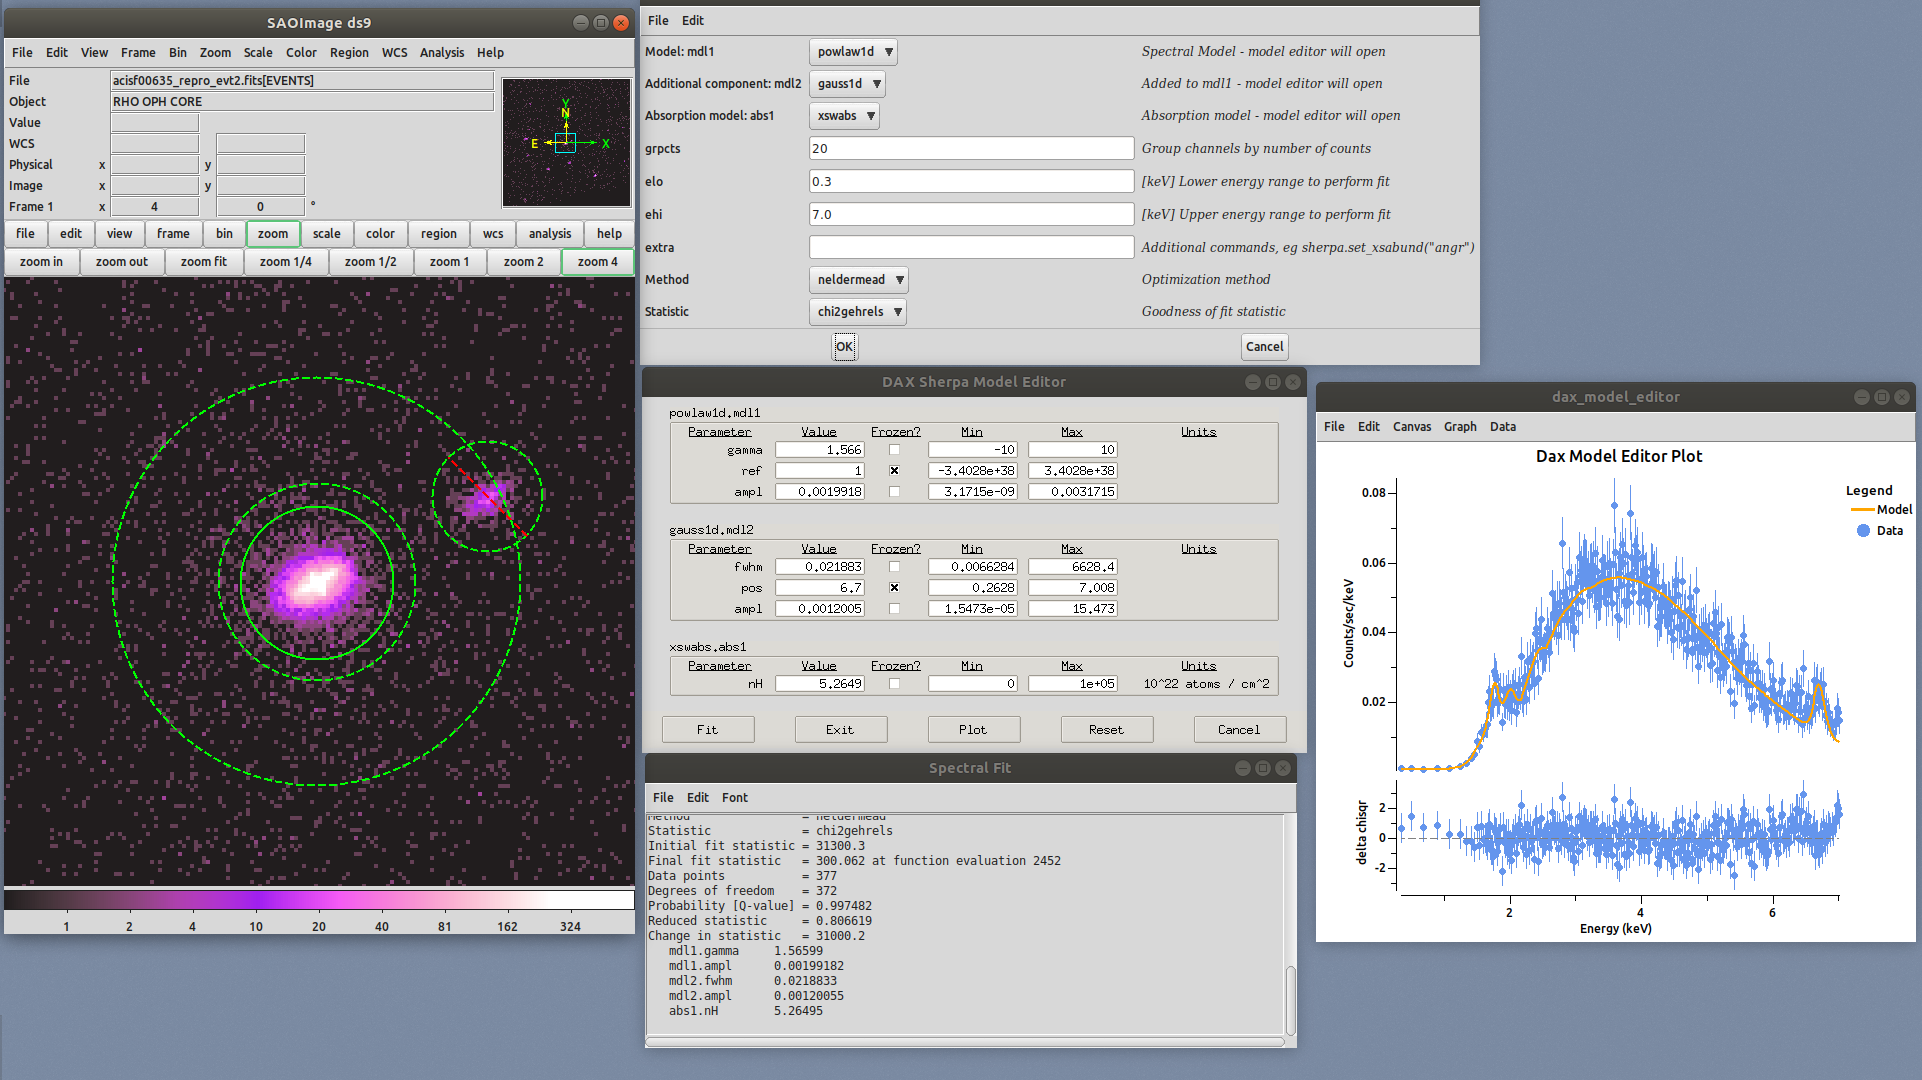
Figure 4: A view of the new DAX Model Parameter Editor in use.
One of the major new features in DAX is the Model Parameter Editor. When using any of the Sherpa fitting tasks (Spectral Fit, 2D Image Fit, or Radial Profile Fit) a new window opens during the fitting process that allows users to interactively adjust the model parameter (including setting limits and freezing/thawing), fit, and plot, repeatedly. This interactivity allows for fitting more complex models than was previously possible. Note that this DAX task takes full advantage of the recently updated plot support in the newest version of DS9.
- Image Calculator (see Figure 5)
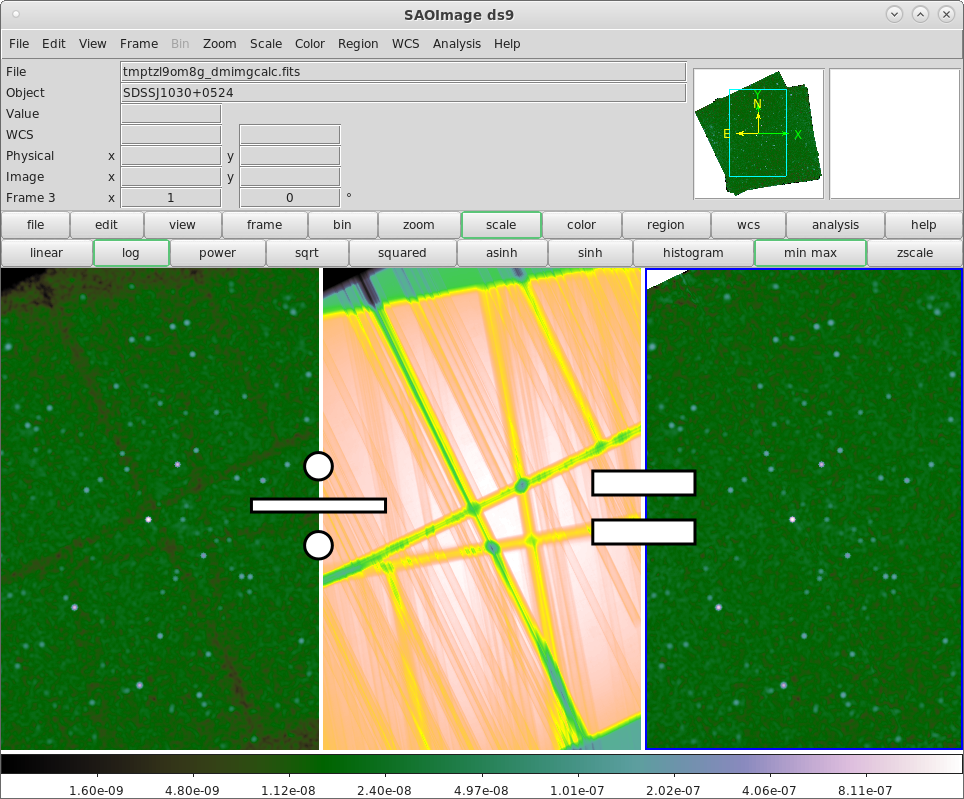
Figure 5: A schematic illustration of the new DAX Image Calculator capabilities.
Have you ever wanted to add images displayed in different DS9 frames? Or – as shown in the example above – to divide a counts image by an exposure map? You can perform the action with the CIAO tool dmimgcalc from the command line; but now you can perform the same action directly in DS9. The new DAX Image Calculator task allows users to perform common arithmetic operations between frames. This can be especially useful if the images have been smoothed by DS9 or when working with the output from other DAX image processing tasks (e.g., Adaptive Smoothing).
- Grating coordinates calculator (see Figure 6)
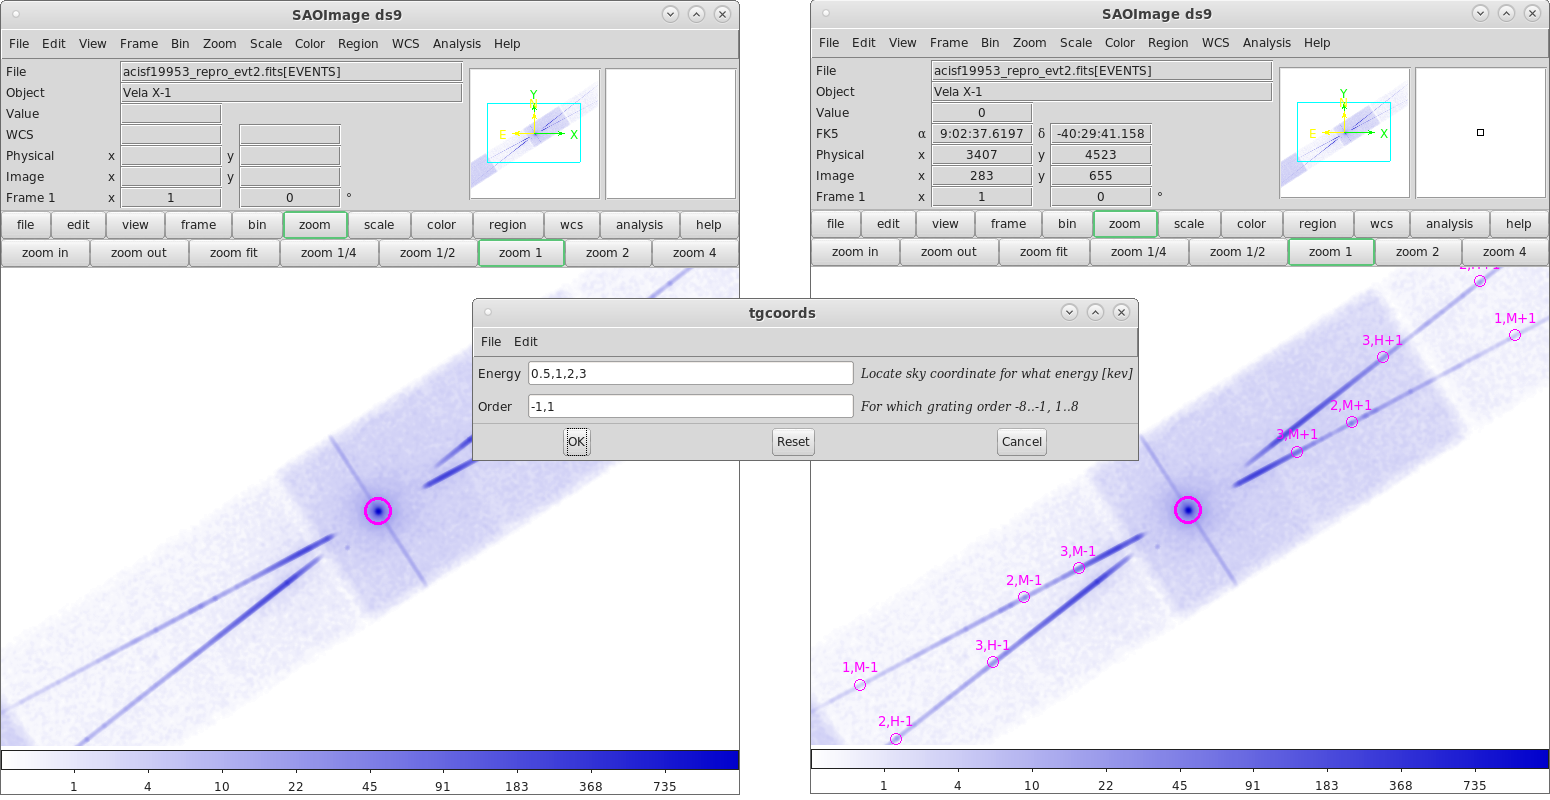
Figure 6: The DAX Chandra Gratings coordinate calculator in use.
A new Chandra Gratings coordinate calculator lets users identify where the user-supplied energies are imaged on the detector (and so identify specific features in a grating spectrum like, for example, the location of chip-gaps).
And lots more
- A new progress bar lets users know which tool is running. Users can run multiple, different DAX tasks at the same time.
- Several new CIAO tools are available including wavdetect, simulate_psf, reproject_image, ecfcalc, dither_region, and dmregrid2
How does it work? (if you really want to know the details)
DS9 was designed with an open concept and a large part of DS9 is written in the Tcl (aka “tickle”) scripting language using a set of specialized TK widgets (Joye & Mandel 1999). From the beginning, DS9 has allowed users to implement their own add-on analysis tasks.
DAX makes use of DS9’s Analysis Menu. When a CIAO user runs DS9 on the command line, they are actually running a shell script which launches DS9 and loads the CIAO analysis menu.
ds9 -analysis $ASCDS_CONTRIB/config/ciao.ds9
This analysis menu contains the DAX menu hierarchy and all the parameters used by the various tasks.
As of September 2020, most of the DAX tasks are now run from a single Python script. This provides the same look-and-feel to each task including starting the new progress bar, managing where the output files are stored, and parameter information displayed in the tasks’ window. Many of the DAX tasks map to a single CIAO tool though some may require a little extra work to present the outputs back to DS9.
Looking for more information?
The CIAO YouTube channel has a new DAX 2020 playlist with 20 instructional videos showing how to run most of the DAX tasks.
Users may also learn a thing or two (or many!) about DS9 along the way.
Finally, where does the name come from? (yes Star Trek!)
“Trekkies“ (the fans of the Star Trek franchise) will recognize “Dax” as the name of one (well, two) of the characters from Star Trek: Deep Space 9. DS9 is the third television series in the Star Trek franchise; just as SAOImageDS9 is the third generation of the popular SAOImager application: SAOImage, SAOTNG, and now SAODS9.
In the television series, Dax is a symbiotic life form carried by a Trill host: each retains its own character in a shared, collaborative existence. This describes the relationship between DAX and DS9: DAX exists as part of DS9, while providing valuable analysis capabilities beyond what DS9 provides!
References
Fruscione et al. 2006, SPIE Proc. 6270, 62701V, D.R. Silvia & R.E. Doxsey, eds.