HETG Update
David Huenemoerder, for the HETGS team
HETGS Usage and Performance
In the past year, the High Energy Transmission Grating Spectrometer (HETGS) has continued to be used at about the same level as in prior years. This is in spite of increasing ACIS filter contamination, which precludes use of interesting long-wavelength diagnostics, such as O VII (22 Å ) or N XVII (24.8 Å ). The community continues to find productive ways to probe the dynamics, energetics, and makeup of hot plasmas with high spectral resolution diagnostics. Between mid-March 2020 and mid-March 2021, 23 objects were observed for a total of 2.8 Ms, in 112 pointings. Observatory thermal constraints now break long exposures into several shorter ones, so there were 4-5 Observation IDs per source. Looking at the entire history of HETGS exposure per month in Figure 1, while we see large fluctuations, the cumulative exposure shows a fairly steady rate of a bit over 3 Ms/yr. The figure also shows the exposure per unique source, of which there are about 400, with a handful in the “Megasecond Club”. Most of these deep exposures are monitoring observations, and represent 20-70 observations per source.
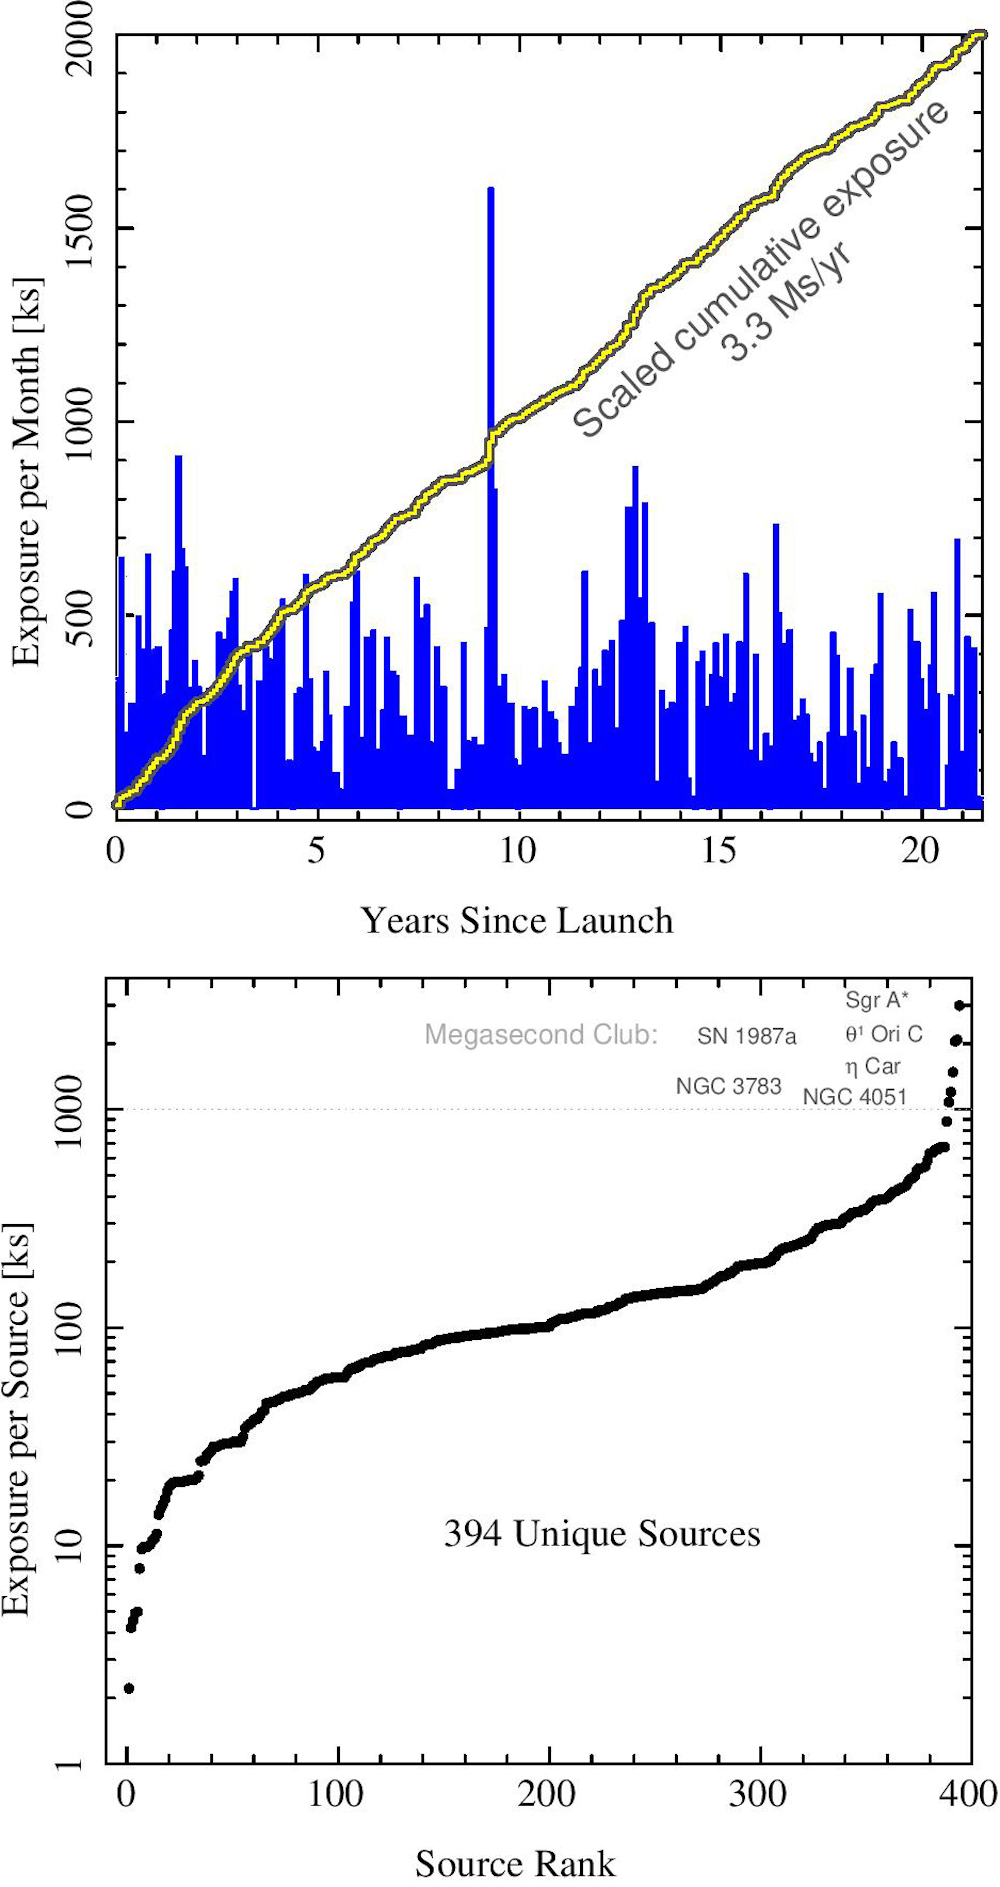
Figure 1 — Top: The exposure for HETGS on a monthly basis (dark histogram), and the cumulative exposure (diagonal line). Bottom: The total exposure per unique source, ranked by exposure.
Recent HETGS observations of the Orion Nebula Cluster have provided a unique dataset of deep exposures of fainter, unsaturated sources. These observations provide the opportunity to better calibrate the higher order spectra with the (unsaturated) first order spectra. Figure 2 shows the “out-of-the-box” flux calibration of the third order MEG vs first order for 1.5 Ms of θ1 Ori C. The calibration is certainly better than 10%. Higher orders are of interest because they provide proportionally higher spectral resolving power, though with more limited spectral coverage. Detailed review is in progress.
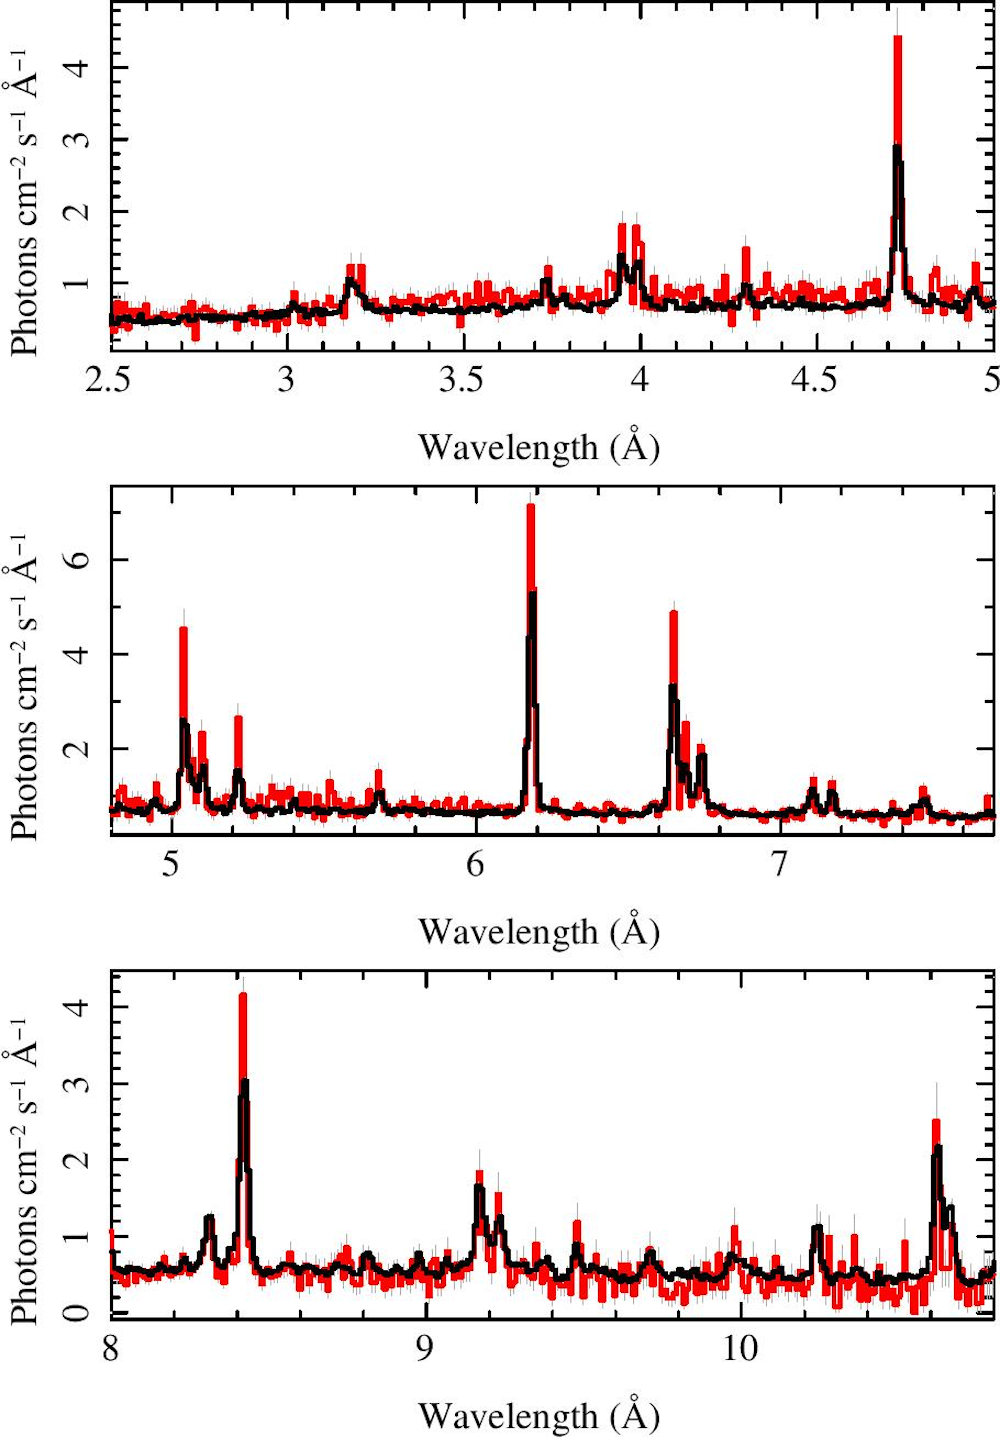
Figure 2 — θ1 Ori C in MEG 3rd order (red) and MEG 1st (black). Unresolved lines are sharper in higher orders, whereas resolved lines will show identical profiles. (Note: flux units were scaled up by a factor of 1000.)
Selected Scientific Results Published in the Past Year
Over the past year there were about 30 peer-reviewed works published which made substantial use of HETGS spectra. As a testament to the richness of high resolution spectra, half of these used archival data, and the rest were either archival plus current data, or solely used very recent observations. We highlight a few of these works here.
Stellar Winds
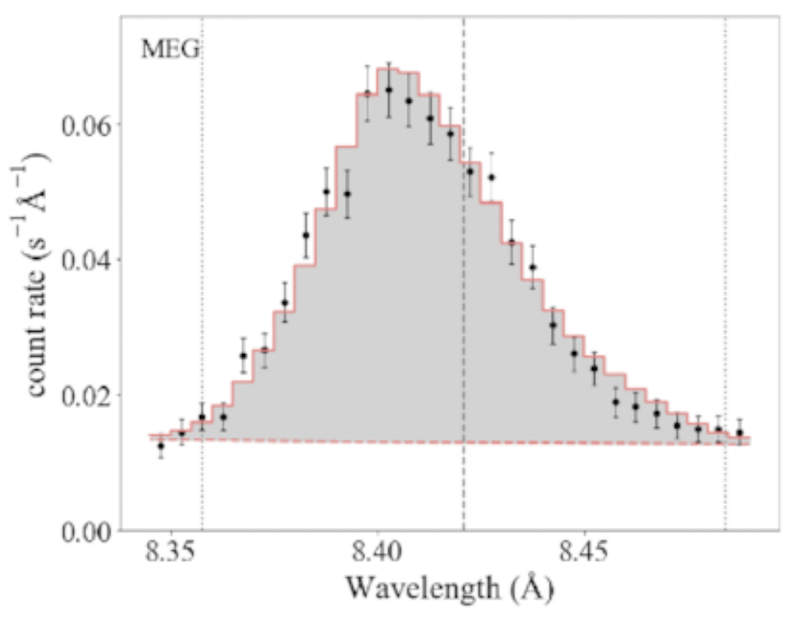
Figure 3 — The Mg XII emission line in ζ Pup, broadened by wind outflow, and more absorbed redward of the rest wavelength by wind absorption, is sensitive to the mass-loss rate. The black points with errorbars are the data for the 800 ks observation in Cycle 19; the red histogram is the best-fit model. The central vertical line marks the rest wavelength; the outer pair of vertical lines mark the Doppler shifts from rest for a terminal velocity of 2250 km s-1. (From Cohen et al. 2020)
Several papers were devoted to the O4 supergiant, ζ Puppis, a single star with a strong stellar wind. In Cycle 19 (2018-2019; PI W. Waldron) ζ Pup was observed for over 800 ks with the HETGS—a great improvement over the Cycle 1 observation of 70 ks. Line profiles are key to determining wind mass loss rates. The X-ray emitting plasma is carried along with the cooler, X-ray absorbing plasma, so the profiles are not only sensitive to the velocity of the flow, but also to the absorbing column to each emitting parcel at its local velocity, and hence to a wavelength in the profile. The profile, being defined by both the velocity and the absorbing column, is thus a mass-loss diagnostic. Cohen et al. (2020) modeled the ensemble of line profiles available in the HETGS spectrum, one of which, for the H-like and relatively isolated Mg XII, is shown in Figure 3.
It shows an asymmetric shape caused by stronger absorption on the red wing, due to the longer path-length to the receding X-ray emitting plasma through the cooler wind material. By fitting the line profiles, they derived a mass-loss rate Ṁ = 2.5 (±0.1) ×10-6 M⊙ yr-1. More interesting, however, is that they performed the same analysis on the spectrum from 2000 and found that over the 18 year interval, Ṁ increased by 40% (with a 4σ confidence level). This was an unexpected result, since this star is not known to be exceptionally variable, no more than at a few percent, in a stochastic or periodic manner, rather than with systematic secular changes.
Composition of the ISM
The dense matter regions in the Galactic disk and bulge provide a perfect laboratory to study nearly all phases of the interstellar medium. X-ray absorption from bright background sources show specific imprints related to atomic neutral and ionized gas as well as the various dust compositions. The superb spectral resolving powers of the HETGS at Mg K (R = λ/Δλ = 860) and Si K (R = 610) are specifically suited to study the highly resolved structure of the X-ray K edges and identify chemical composition, crystallinity and structure of dust grains populating the inner region of the Galaxy. Rogantini et al. (2020) applied extinction cross sections of silicates measured at the synchrotron facility Soleil (France) in order to study common edge properties in bright X-ray binaries. Figure 4 shows the result of these two edges for the case of GX 3+1. The study finds that Mg and Si are highly depleted from the gas phase and that amorphous olivine is the most representative compound in all sources.
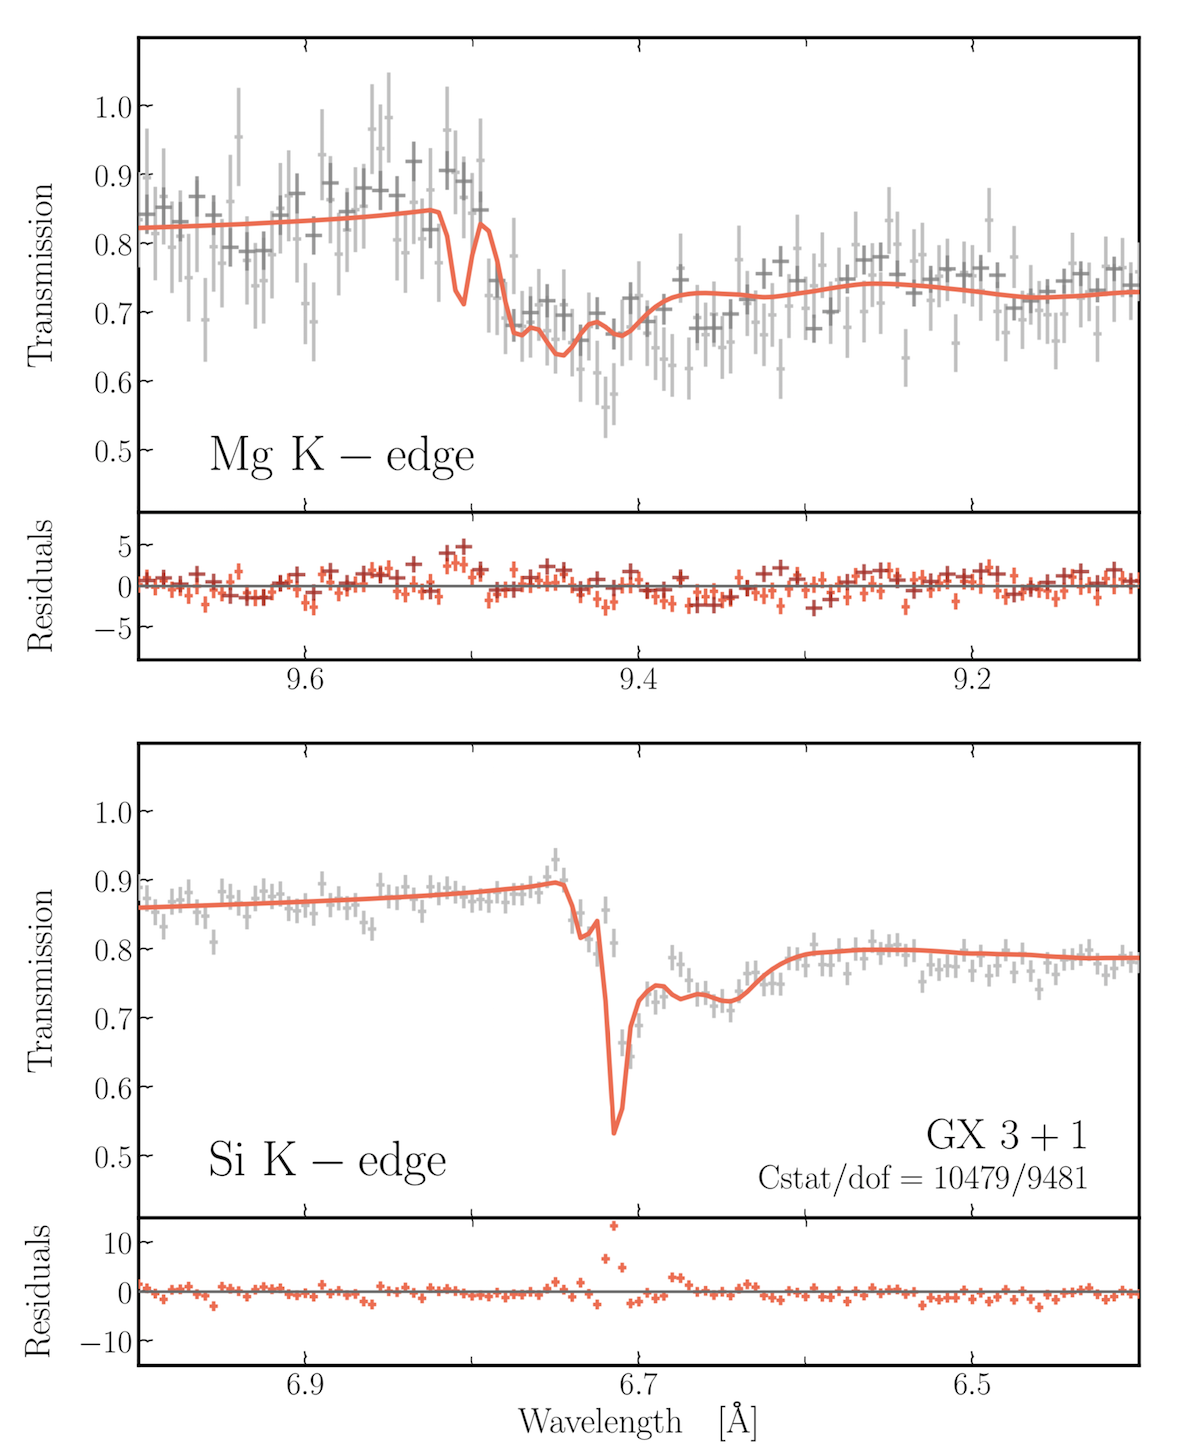
Figure 4 — The magnesium (top) and silicon K-edge (bottom) for GX 3+1. The fit (red) to the data (HEG, gray; MEG, black) consists of a dust mixture without any olivinic compounds, which leaves strong residuals specifically in the Si K-edge and which emphasizes the need for amorphous olivine to sufficiently describe the edge structure. Rogantini et al. (2020)
LMXB Disk Dynamics
The HETGS can be used to probe dynamic astrophysical phenomena in geometrically complex systems such as Ultra Compact X-ray Binaries (UCXB). In recent work by Trueba et al. (2020) HETGS observations are presented for 4U 1916-053, a relatively X-ray-bright short-period binary (P ≃ 50 minutes) consisting of a neutron star and a likely helium-rich white dwarf (donor) companion. UCXB are unique systems to study disk accretion and outflows as they host very small accretion disks. The 4U 1916-053 system is viewed at high inclination as demonstrated by dipping events in its X-ray light curve likely associated with structures in the outer disk. Trueba et al. (2020) present three HETGS observations of 4U 1916–053 (two new 250 ks observations and one archival 50 ks observation) with the aim of investigating disk atmospheres, winds and wind driving mechanisms.
After separating the 4U 1916–053 spectra into “non-dip” and “dip” spectra (Figure 5), they fit models to the data to investigate changes in absorption between these two states. Analysis of the absorption feature from the strongest, most highly ionized lines of Si XIV (Figure 5) and Fe XXVI demonstrate a redshifted absorption component associated with the disk atmosphere (red line; non-dip spectrum) that is not present in the absorption feature from the outer disk alone (blue line; dip spectrum). The lack of velocity shifts from the outer disk serves as a local standard of rest indicating that the redshift observed is intrinsic to the inner disk atmosphere and not a result of radial motion in the galaxy or a kick. This 220-290 km s-1 redshift corresponds to a gravitational redshift at radius of R ≃ 1200GM/c2. The authors also find evidence of a more strongly red-shifted absorption component (R ≃ 70 GM/c2) in two of their spectra and evidence of a transient disk wind with a blueshift of -1700+1700-1200 km s-1 which, if real, would require some form of magnetic driving.
The authors argue that this work provides evidence for perhaps the largest gravitational redshift ever detected in absorption at ∼250 km s-1; they find comparable redshifts in archival HETGS observations of other sources that have not been previously reported. While they caution interpreting their results given possible alternative explanations for the observed redshifts, they claim their results suggest that UCXBs have disk atmospheres with similar properties where the bulk absorption occurs at R ≃ 1000GM/c. This could result in a new class of absorbers where distance from the compact object could be directly measured with unprecedented accuracy.
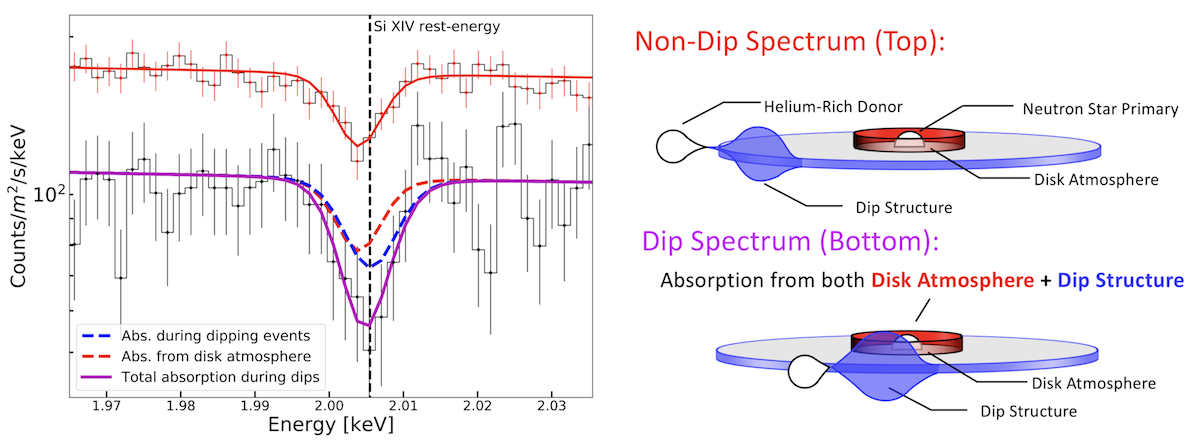
Figure 5 — Top: HETGS data (black) of this highly-inclined system have been used to demonstrate a redshifted absorption feature (identified in the highly-ionized lines of Si XIV) present in the disk atmosphere (red) that is not present in the outer disk (blue). Bottom: Schematic showing the Ultra Compact X-ray Binary (UCXB) composed of a neutron star primary with a helium-Rich donor, with the upper and lower graphics corresponding to the upper and lower spectra in the upper part of the figure. (From Trueba et al. (2020))
Extended Source Spatial-Spectral Analysis (Knot So Easy?)
With an objective transmission grating, a spatially extended source becomes a series of overlapping images in the strong emission lines, or a smear for continuum emission. Analysis can be difficult, and relies on customized methods, since there are not any generalized fitting packages for such cases. Millard et al. (2020) have undertaken such a task with a 148 ks HETGS observation of the Kepler supernova remnant (SNR), and have been approved for 450 ks more. Figure 6 shows an image of the dispersed spectrum. The zeroth order is in the center (in “white” light), and the most prominent displaced images to either side are the MEG-arm images in mostly Si XIII (the outer green images are from the HEG arm, at a 10° angle relative to MEG and twice the dispersion). By measuring the dispersion angle of 17 individual knots, the authors were able to determine radial velocities. Combined with historical ACIS imaging observations over a 14 year span, they could combine these with proper motion measurements, they can derive a three-dimensional model of an SNR which appears to be in free expansion, and from an improved distance estimate, conclude that the remnant is that of a Type Ia supernova.
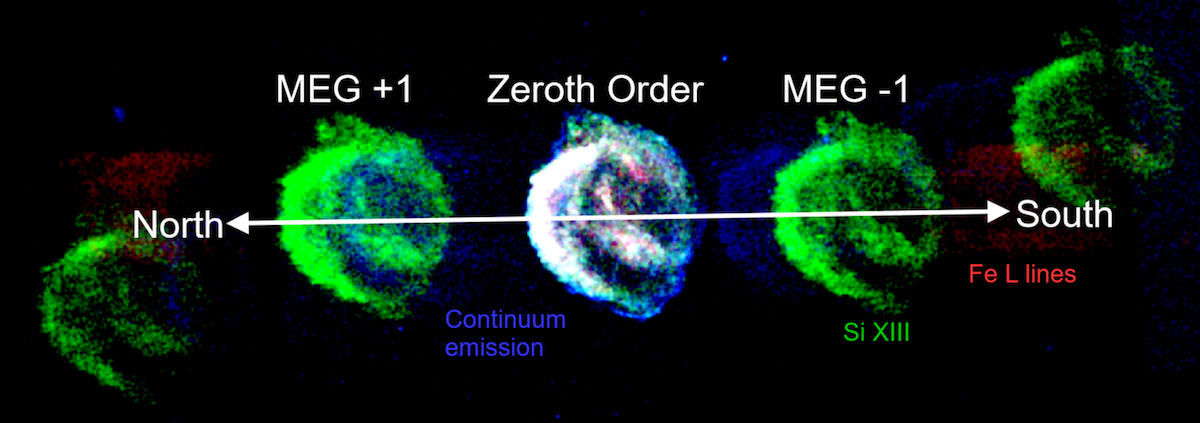
Figure 6 — An image of the HETGS dispersed spectrum of the emission-line rich Kepler SNR. (From Millard et al. 2020)
References
Cohen, D. H., Wang, J., Petit, V., et al. 2020, MNRAS, 499, 6044
Millard, M. J., Bhalerao, J., Park, S., et al. 2020, ApJ, 893, 98
Rogantini, D., Costantini, E., Zeegers, S. T., et al. 2020, A&A, 641, A149
Trueba, N., Miller, J. M., Fabian, A. C., et al. 2020, ApJ, 899, L16