Chandra Source Catalog
Ian Evans, Rafael Martínez-Galarza, for the Chandra Source Catalog team
Release 2.1 Processing
Production of release 2.1 of the Chandra Source Catalog (CSC 2.1) began in April 2022 and is expected to be completed in the first quarter of 2023, after which the full, frozen CSC 2.1 catalog release will be made available to end users. Datasets that have completed processing are made available immediately and can be accessed by interested users now.
CSC 2.1 is an incremental release that expands on the existing CSC 2.0 data by adding observations released publicly between January 1, 2015 and December 31, 2021. Except for astrometric updates (see below), CSC 2.0 data for observation stacks that are not modified by the addition of new data will be unchanged in CSC 2.1. As a reminder, observations obtained using the same instrument with pointings that all fall within 1 arcmin of each other are co-added to form observation stacks prior to source detection.
The new catalog release will include more than 15,000 observations that have been co-added to form about 10,000 observation stacks (up from 10,382 observations and 7,287 stacks in CSC 2.0) and will increase the number of X-ray sources in the catalog by about one-third. Many of the newly added observations include new sky regions that are not present in CSC 2.0, and so the total sky coverage of CSC 2.1 will expand from the approximately 560 square degrees in the current release to roughly 800 square degrees.
What is New in CSC 2.1
Besides the significant increase in the number of processed observations, CSC 2.1 includes several algorithmic updates. Key improvements include:
Observation Stack-level astrometric updates: CSC 2.1 observation stacks with sufficient CSC/Gaia matches (most stacks) are tied to the Gaia astrometric reference frame, which provides an absolute astrometric reference for the entire catalog. The resulting coordinate shifts are typically 0.1–0.2 arcsec but can exceed 2.0 arcseconds in a very small percentage of the cases. This update includes observation stacks unchanged since the release of CSC 2.0 that are not otherwise updated in CSC 2.1.
Improved MCMC sampling for aperture photometry: In the CSC 2.0 catalog, photometry for some faint sources failed to converge with the CSC 2.0 photometry algorithms. In CSC 2.1, the marginalized posteriors for the fluxes and hardness ratios are sampled using a more robust MCMC algorithm, improving flux estimates in the low-count regime.
Improved detection fitting: Candidate detected sources that are spatially close together are now fitted simultaneously with a model that accounts for the multiplicity; previously, these candidate detections were fitted individually in order of decreasing observed counts. This new analysis allows fitting to be more efficient and ensures that computed likelihoods for adjacent candidate detections are more robustly evaluated.
Accessing Release 2.1 Production Data
Data that have completed processing are made immediately available to the end users via the Current Database view of the catalog. Release 2.1 processing prioritizes new sky coverage while also interweaving stacks with many observations that take longer to complete. The Current Database view can be accessed using the CSCview application as well as via Virtual Observatory-aware tools such as astroquery. Interested users are encouraged to review the documentation and read the caveats on the release 2.1 catalog web site https://cxc.cfa.harvard.edu/csc/about2.1.html, which also provides examples of how to determine the processing status of an observation stack or source of interest.
At the start of CSC 2.1 production, the Current Database view contained copies of all the sources, detections, and data products present in CSC 2.0. As stacks are processed through the CSC 2.1 pipelines, the Current Database view is updated with the processed data. For new stacks (i.e., those consisting only of new observations not included in CSC 2.0) the new data are added to the Current Database view. However, for stacks that were present in CSC 2.0 but that have been modified by the addition of new observations, the existing data in the Current Database view are replaced with their CSC 2.1 counterparts. As a result, at any instant in time, the Current Database view will therefore contain sources, detections, and data products in different states of completion, depending on the processing status of their associated stacks.
To support users in their interpretation of Current Database view entries, we provide a list of all the CSC 2.1 stacks and their current processing status, updated daily. This list is accessible through the release 2.1 catalog web site on a dedicated page.
Science Case: Looking for Obscured AGN in the COSMOS Field
Active Galactic Nuclei (AGN) are the most powerful, non-explosive events in the Universe, and they function as an effective probe into the cosmic history of accretion and galaxy assembly (Hickox & Alexander, 2018). According to the unified AGN model, a toroidal dust structure surrounds the accreting black hole, and, depending on the viewing angle, the observer can expect different levels of obscuration. In the most extreme cases, dust obscuration is so intense that not only are optical and UV photons absorbed, but also soft X-ray photons. A complete census of obscured AGN is necessary in order to account for the properties of the entire population. And for obscured AGN, X-ray observations are important because, among many other reasons, they can be used for redshift determination when optical information is not available (e.g., Sicilian et al. 2022). Using the CSC, one can identify obscured AGN in particular extragalactic fields and obtain a full characterization of their spectral and time-domain properties.
The COSMOS field is one of the largest and deepest extragalactic fields in the Chandra archive, covering an area of 2.2 square degrees. Obscured AGN can be identified in COSMOS by performing a simple query in the CSC. For example, obscured AGN typically have high values of their hard-to-soft hardness ratios, because soft (0.5–1.2 keV) photons are preferentially absorbed. Modeling of their spectra with an absorbed power law often results in high values of the hydrogen column density (NH > 1022 cm-2). Both the hardness ratio between the hard and the soft bands, hard_hs, and the NH value derived from a power law spectral model fit, powlaw_nh, are properties listed in the CSC. The left panel of Figure 1 shows a plot of the hardness ratios for all COSMOS field point sources with more than 50 counts (yellow dots) and those that are candidates to be obscured AGN (blue dots), selected by setting hard_hs > -0.2 and powlaw_nh > 100 (in units of 1020 cm-2).
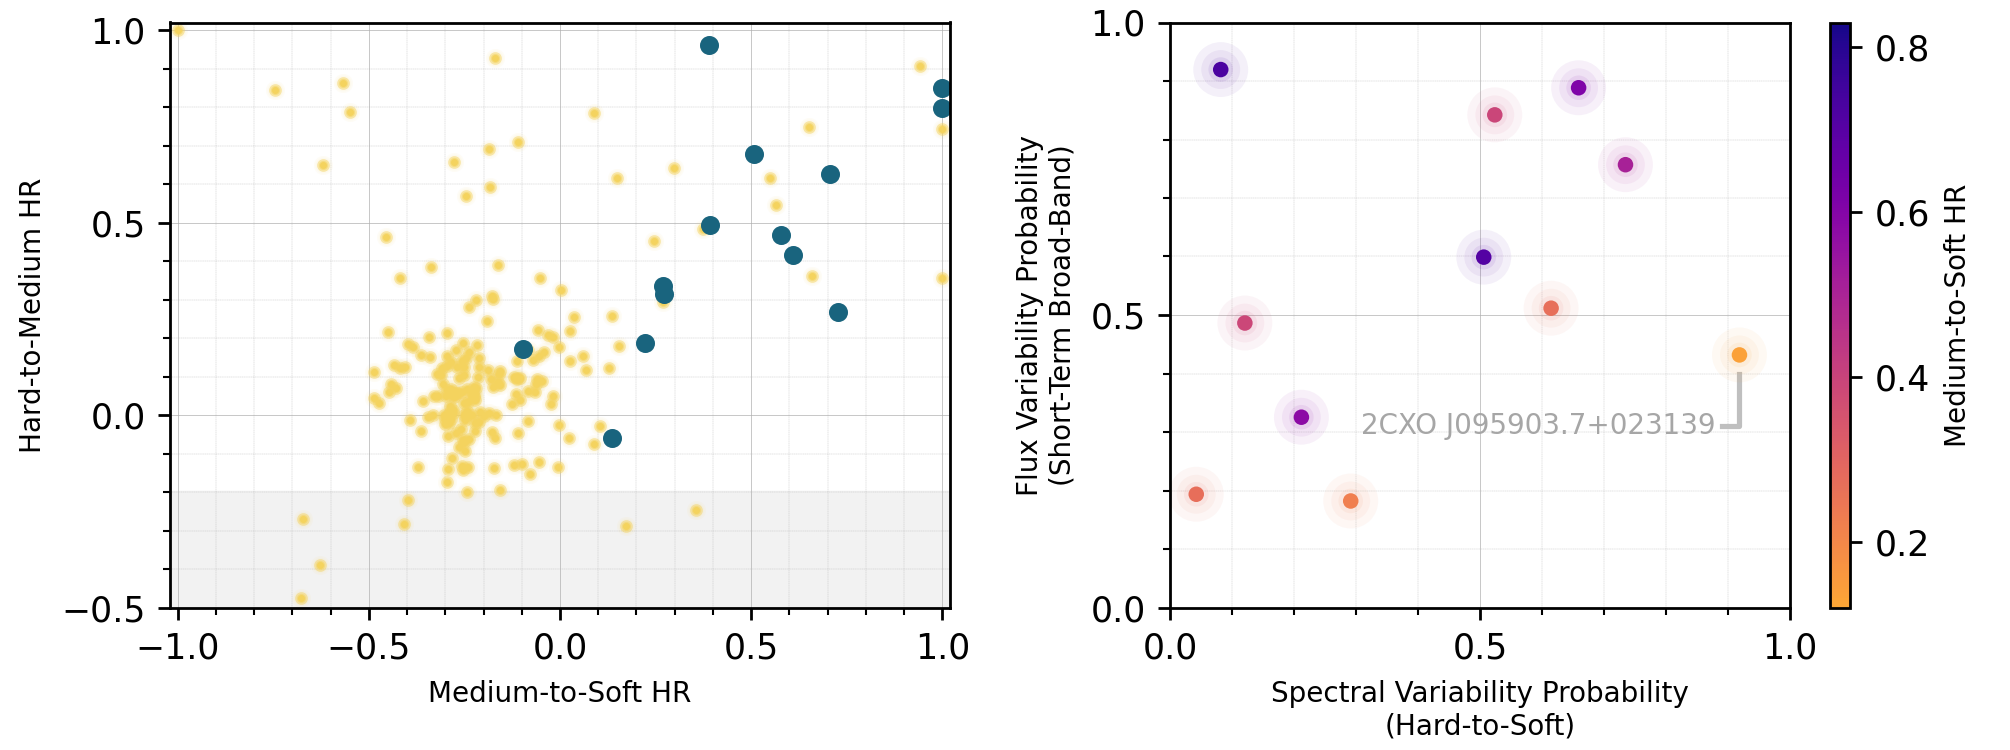
Figure 1: Left: the hardness ratios of obscured AGN candidates (blue dots) selected from the CSC COSMOS sample (yellow dots). Right: the short-term flux variabilities and long term spectral variabilities of the obscured AGN candidates. The location of 2CXO J095903.7+023139, the most spectrally variable source in this sample, is highlighted.
The search for spectral variability in obscured AGN is relevant in the context of changing-looking AGN and as a test for the unified AGN model. More generally, spectral variability in X-ray sources reveal interesting transitions in accreting systems, including phase transitions in X-ray binaries. The CSC provides measures of spectral variability probability that can be used to select those sources that show strong spectral variability, as detailed in the documentation. The right panel of Figure 1 shows a plot of the spectral variability probability between the hard and soft bands, var_inter_hard_prob_hs, and the short term flux variability probability in the broad band, var_intra_prob_b, which indicates variability on timescales comparable with the duration of a single Chandra observation. Some of these obscured AGN show significant spectral variability.
CSC also provides science-ready X-ray spectra of detected sources. Figure 2 shows the spectrum of 2CXO J095903.7+023139, which is the most spectrally variable source among the selected obscured AGN, in two different epochs. There is a significant hardening of the spectrum in the later epoch. The question of whether the hardness difference results from geometrical effects due to irregularities in the obscuring material or from changes in the non-thermal processes related to the accretions is at the core of investigations into changing look AGN.
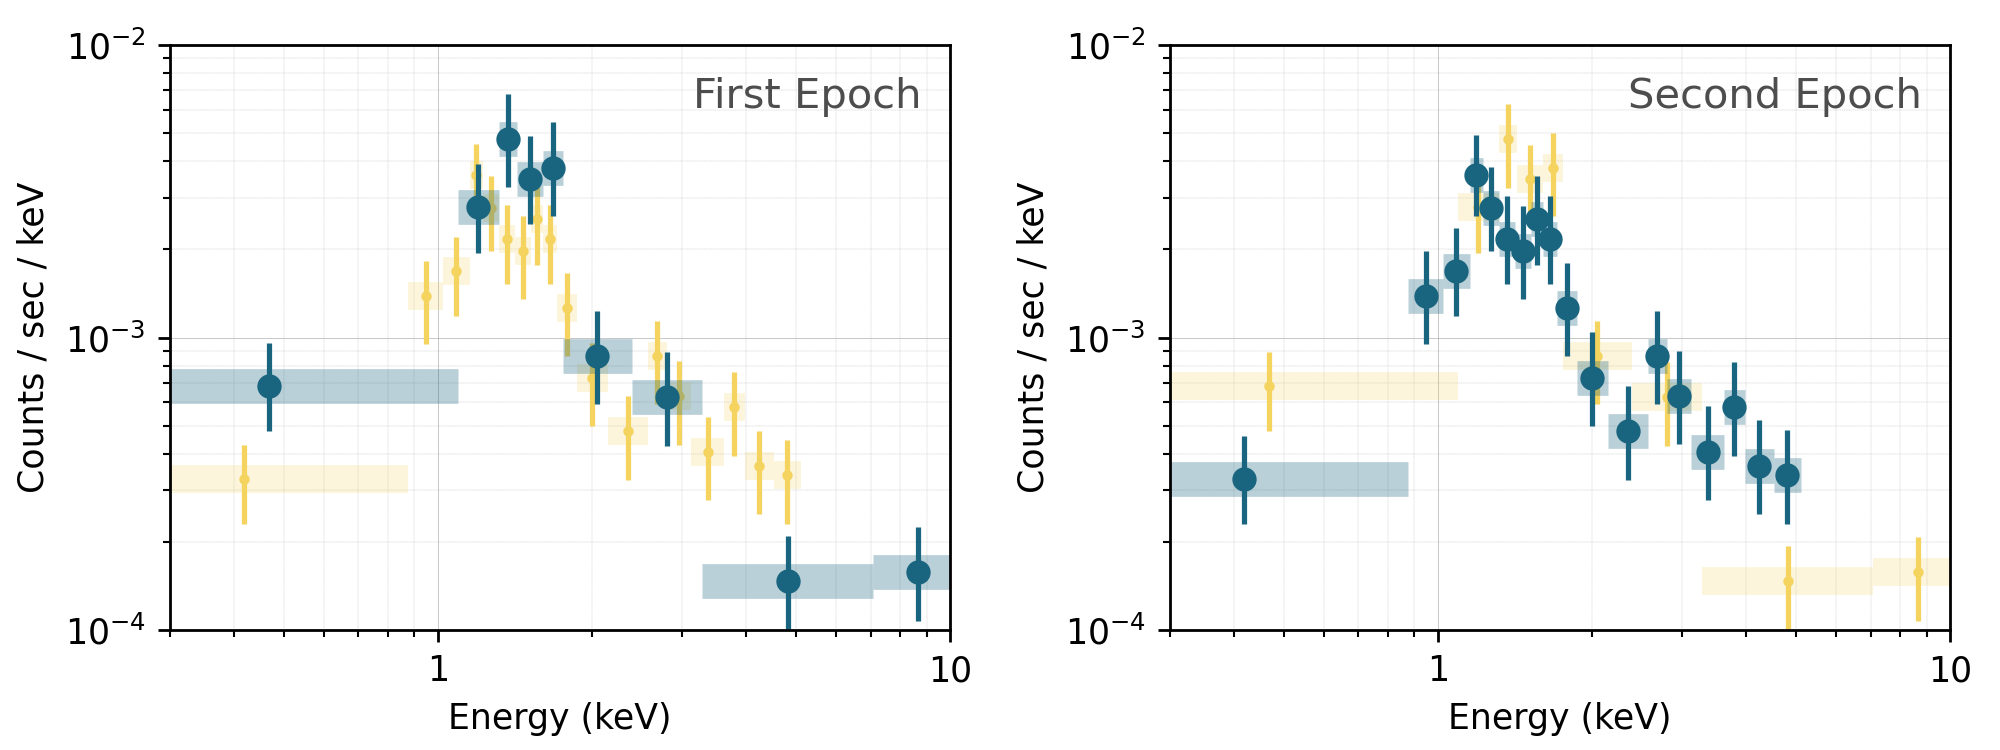
Figure 2. CSC-obtained X-ray spectra of 2CXO J095903.7+023139, the most spectrally variable obscured AGN candidate in our sample, as obtained at two different epochs. The alternate epoch is shown in both panels in yellow for comparison purposes.