ACIS
ACIS DOSE Registered-Photon-Map
The steps we took to compute the dose map are;
- Level 1 Event files for a specified month are obtained from archive.
- Image data including I2, I3, S2, S3 CCDs are extracted from all event files.
- All the extracted image data were merged to create a month long exposure map for the month.
- The exposure map is opened with ds9, and check a distribution of count rates against energy. From this, estimate the upper threshold value. Any events beyond this upper threshold are assumed erroneous events such as bad pixels.
- Using this upper threshold, the data is filtered, and create a cleaned exposure map for the month.
- The exposure map from each month from the Sep 1999 is added up to create a cumulative exposure map for each month.
- Using fimgstatistic, we compute count rate statistics for each CCDs.
- For observations with high data drop rates (e.g., Crab nebula, Cas A), we corrected the observations by adding events.
-
Note: Counts and RMS's of Cumulative maps are lower than the previous months.
This is because we excluded extreme outliers.
Please check more detail plots at Telemetered Photon Dose Trend page.
)
)
)
Statistics:
# IMAGE     NPIX        MEAN           RMS              MIN     MAX
ACIS_nov09 6004901      12.07          20.66            0.0     9074

 I2 node 0  262654      12.862488       5.959898        0.0      85.0
 I2 node 1  262654      12.712817       15.457648       0.0     7410.0
 I2 node 2  262654      12.261024       4.650003        0.0      85.0
 I2 node 3  262654      12.121113       4.978214        0.0     472.0

 I3 node 0  262654      13.465173       5.779261        0.0      56.0
 I3 node 1  262654      13.140781       11.653978       0.0     268.0
 I3 node 2  262654      11.615707       4.433487        0.0      81.0
 I3 node 3  262654      12.004364       26.312263       0.0     9074.0

 S2 node 0  262654      11.403451       20.758624       0.0     6203.0
 S2 node 1  262654      12.029587       4.727526        0.0      84.0
 S2 node 2  262654      13.181319       5.009930        0.0     116.0
 S2 node 3  262654      12.836345       5.815853        0.0     756.0

 S3 node 0  262654      17.311543       13.180438       0.0     278.0
 S3 node 1  262654      39.102046       31.576410       0.0     261.0
 S3 node 2  262654      37.348767       34.654438       1.0     239.0
 S3 node 3  262654      14.073257       4.233212        1.0      56.0
)
)
)
Statistics:
 IMAGE        NPIX      MEAN          RMS              MIN    MAX
ACIS_total  6004901    1332.01          1803.85         0.0    81173.0

 I2 node 0  262654      1053.664768     194.190163      0.0     4953.0
 I2 node 1  262654      1116.361855     265.616987      0.0     19474.0
 I2 node 2  262654      1153.730377     248.182949      0.0     8610.0
 I2 node 3  262654      1152.154212     294.141069      0.0     27440.0

 I3 node 0  262654      1217.417725     301.355870      0.0     5961.0
 I3 node 1  262654      1277.459671     926.996907      0.0     24153.0
 I3 node 2  262654      1101.199781     194.206128      0.0     4933.0
 I3 node 3  262654      1086.725220     207.041747      0.0     20012.0

 S2 node 0  262654      1595.113526     213.853965      793.0   19914.0
 S2 node 1  262654      1693.479816     352.055746      824.0   9011.0
 S2 node 2  262654      1878.044558     346.056695      1067.0  12796.0
 S2 node 3  262654      1812.627514     250.696112      1044.0  25958.0

 S3 node 0  262654      2737.050425     1326.903048     1128.0  11206.0
 S3 node 1  262654      3980.070187     1821.282541     0.0     12054.0
 S3 node 2  262654      2967.457954     848.142853      1036.0  6869.0
 S3 node 3  262654      2244.870604     356.013049      1190.0  8615.0
)
|
)
|
)
|
)
|
| Aug 2009 | May 2009 | Feb 2009 | Nov 2008 |
|---|
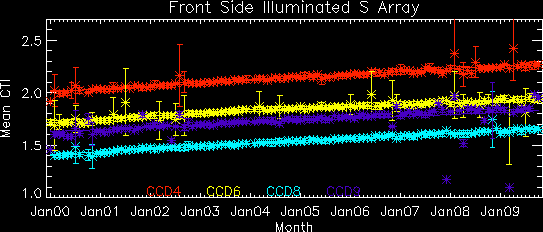
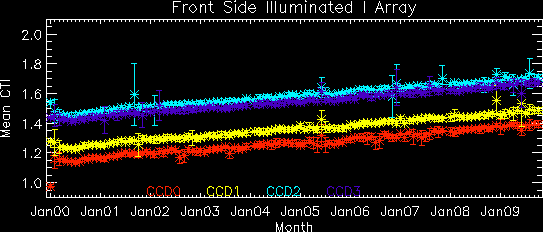
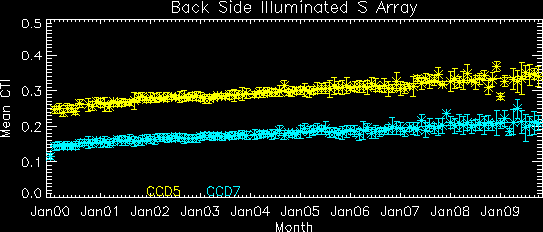
The Mean Detrended CTI
We report CTIs with a refined data definition. CTIs were computed for the temperature dependency corrected data. Please see CTI page for detailed explanation. CTI's are computed for Mn K alpha, and defined as slope/intercept x10^4 of row # vs ADU. Data file: here
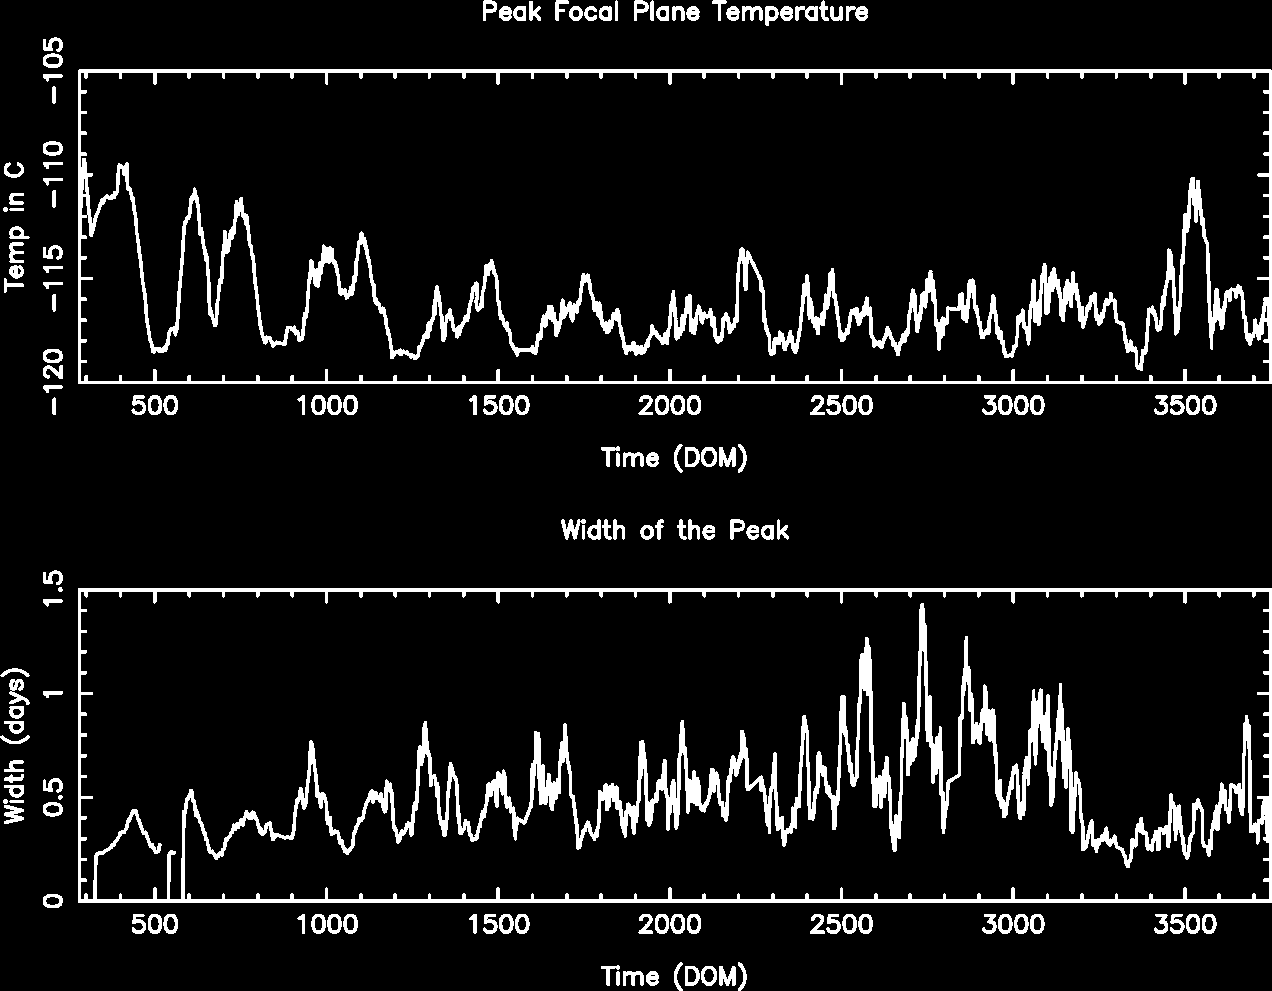
Focal Plane Temperature
November 2009 Focal Temperature

| The Mean (max) FPT: | |
|---|---|
| -111.76 | +/- 4.02 C |
| Mean Width: | |
| 0.22 | +/- 0.09 days |
Averaged Focal Plane Temperature
We are using 10 period moving averages to show trends of peak temperatures and peak widths. Note, the gaps in the width plot are due to missing/corrupted data.
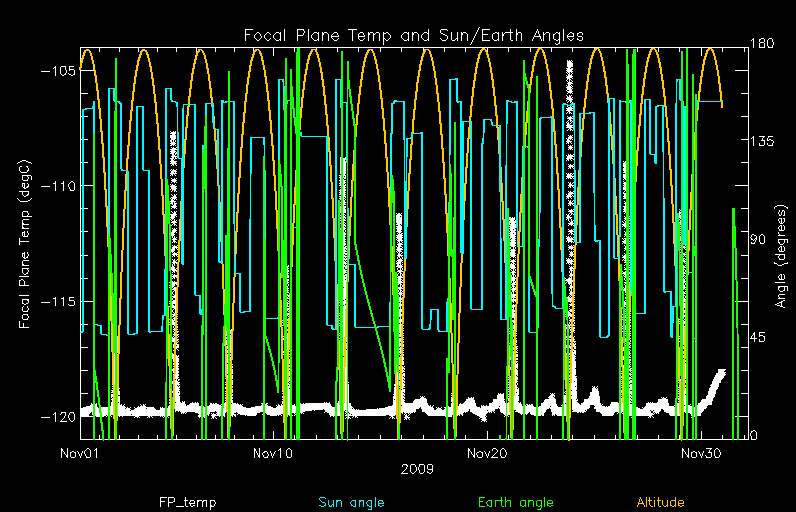
Focal Plane Temperature and Sun Angle, Earth Engle, and Altitude
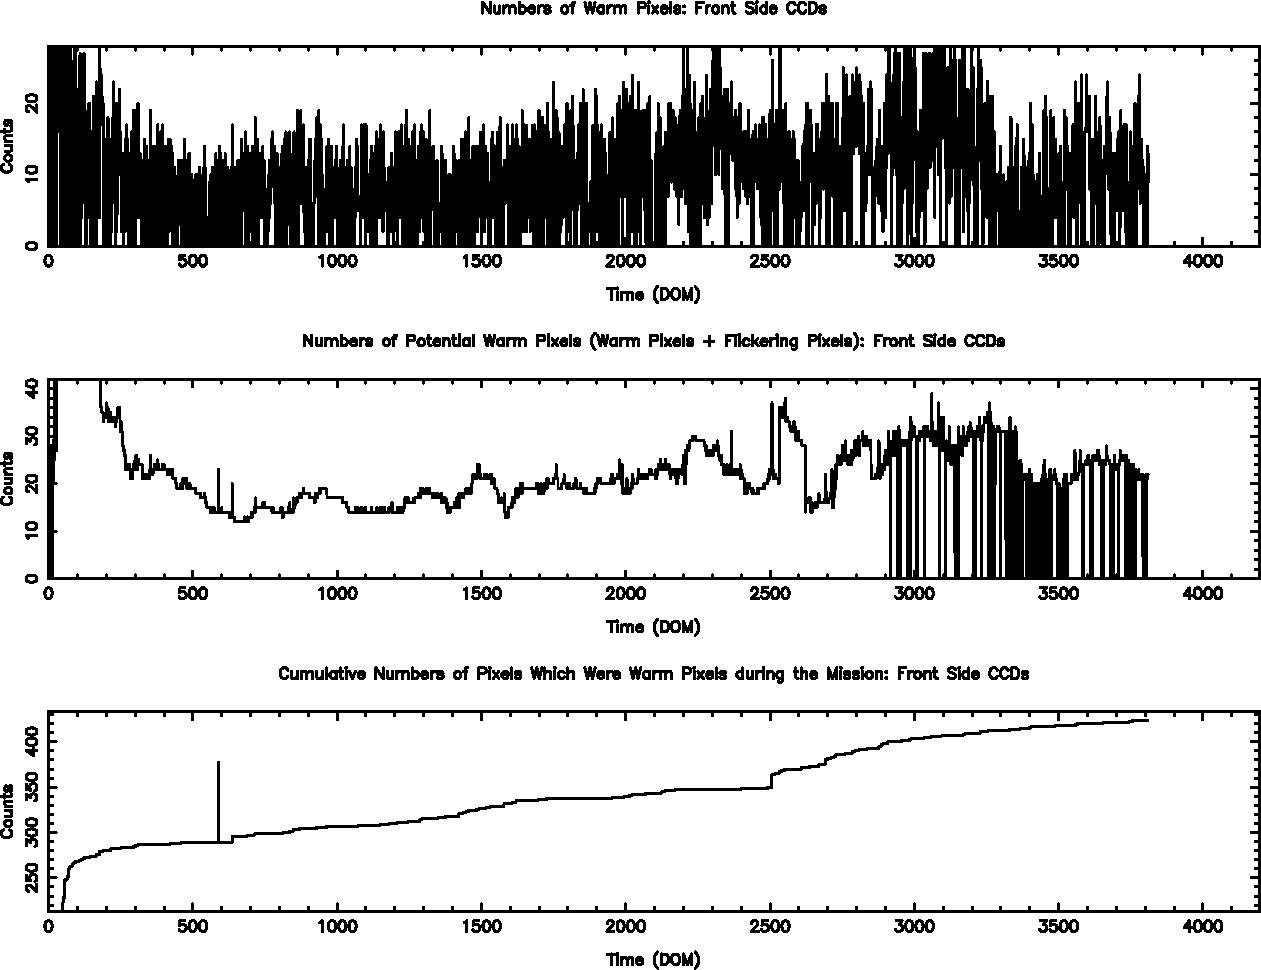
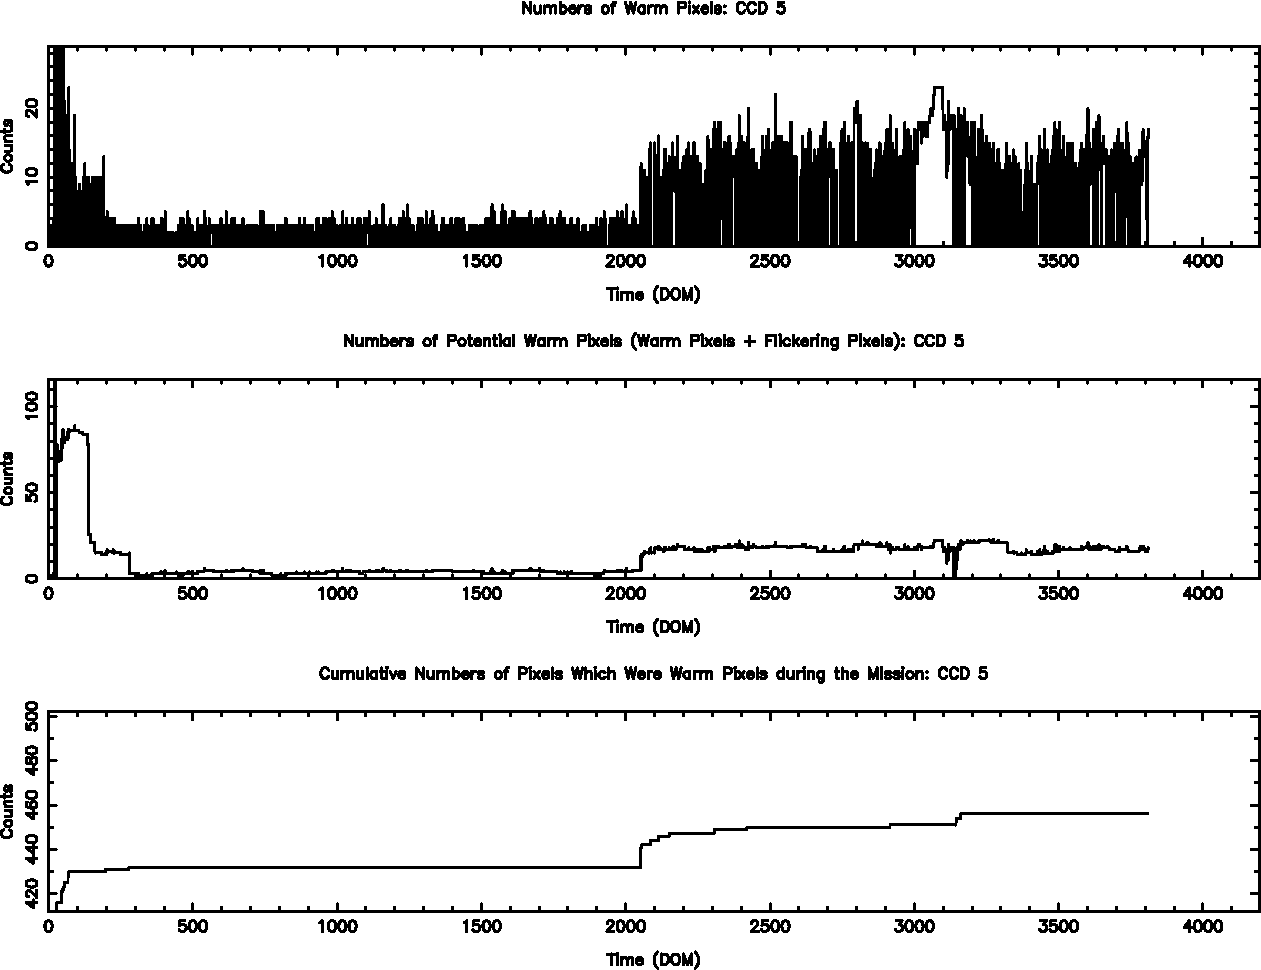
Bad Pixels
The plots below were generated with a new warm pixel finding script. Please see Acis Bad Pixel Page for details.
Front Side CCDs
Back Side CCD (CCD5)
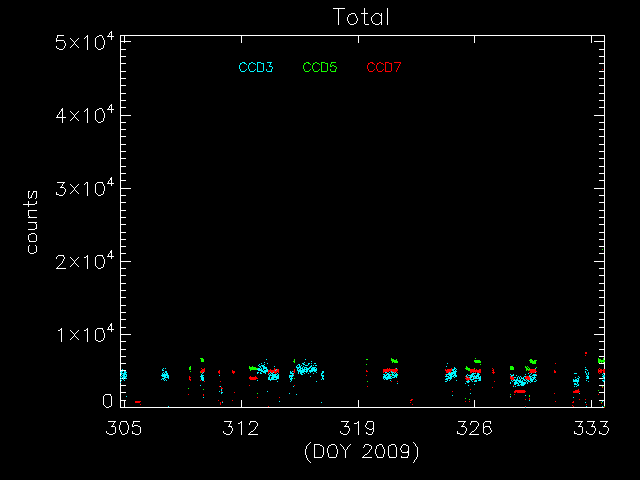
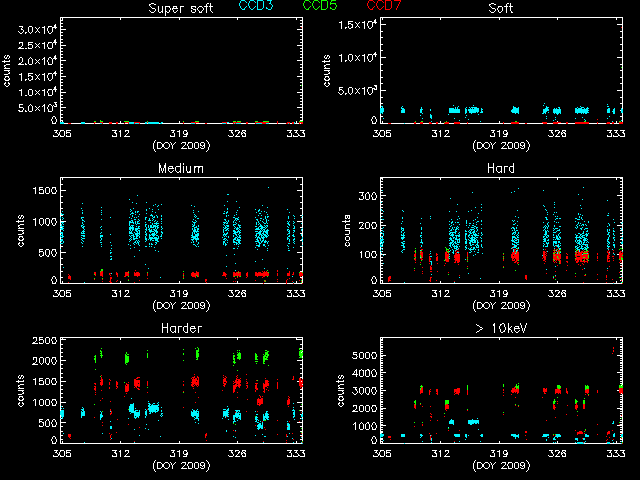
Science Instrument Background Rates
| Name | Low (keV) | High(KeV) | Description |
|---|---|---|---|
| SSoft | 0.00 | 0.50 | Super soft photons |
| Soft | 0.50 | 1.00 | Soft photons |
| Med | 1.00 | 3.00 | Moderate energy photons |
| Hard | 3.00 | 5.00 | Hard Photons |
| Harder | 5.00 | 10.00 | Very Hard photons |
| Hardest | 10.00 | Beyond 10 keV |
HRC
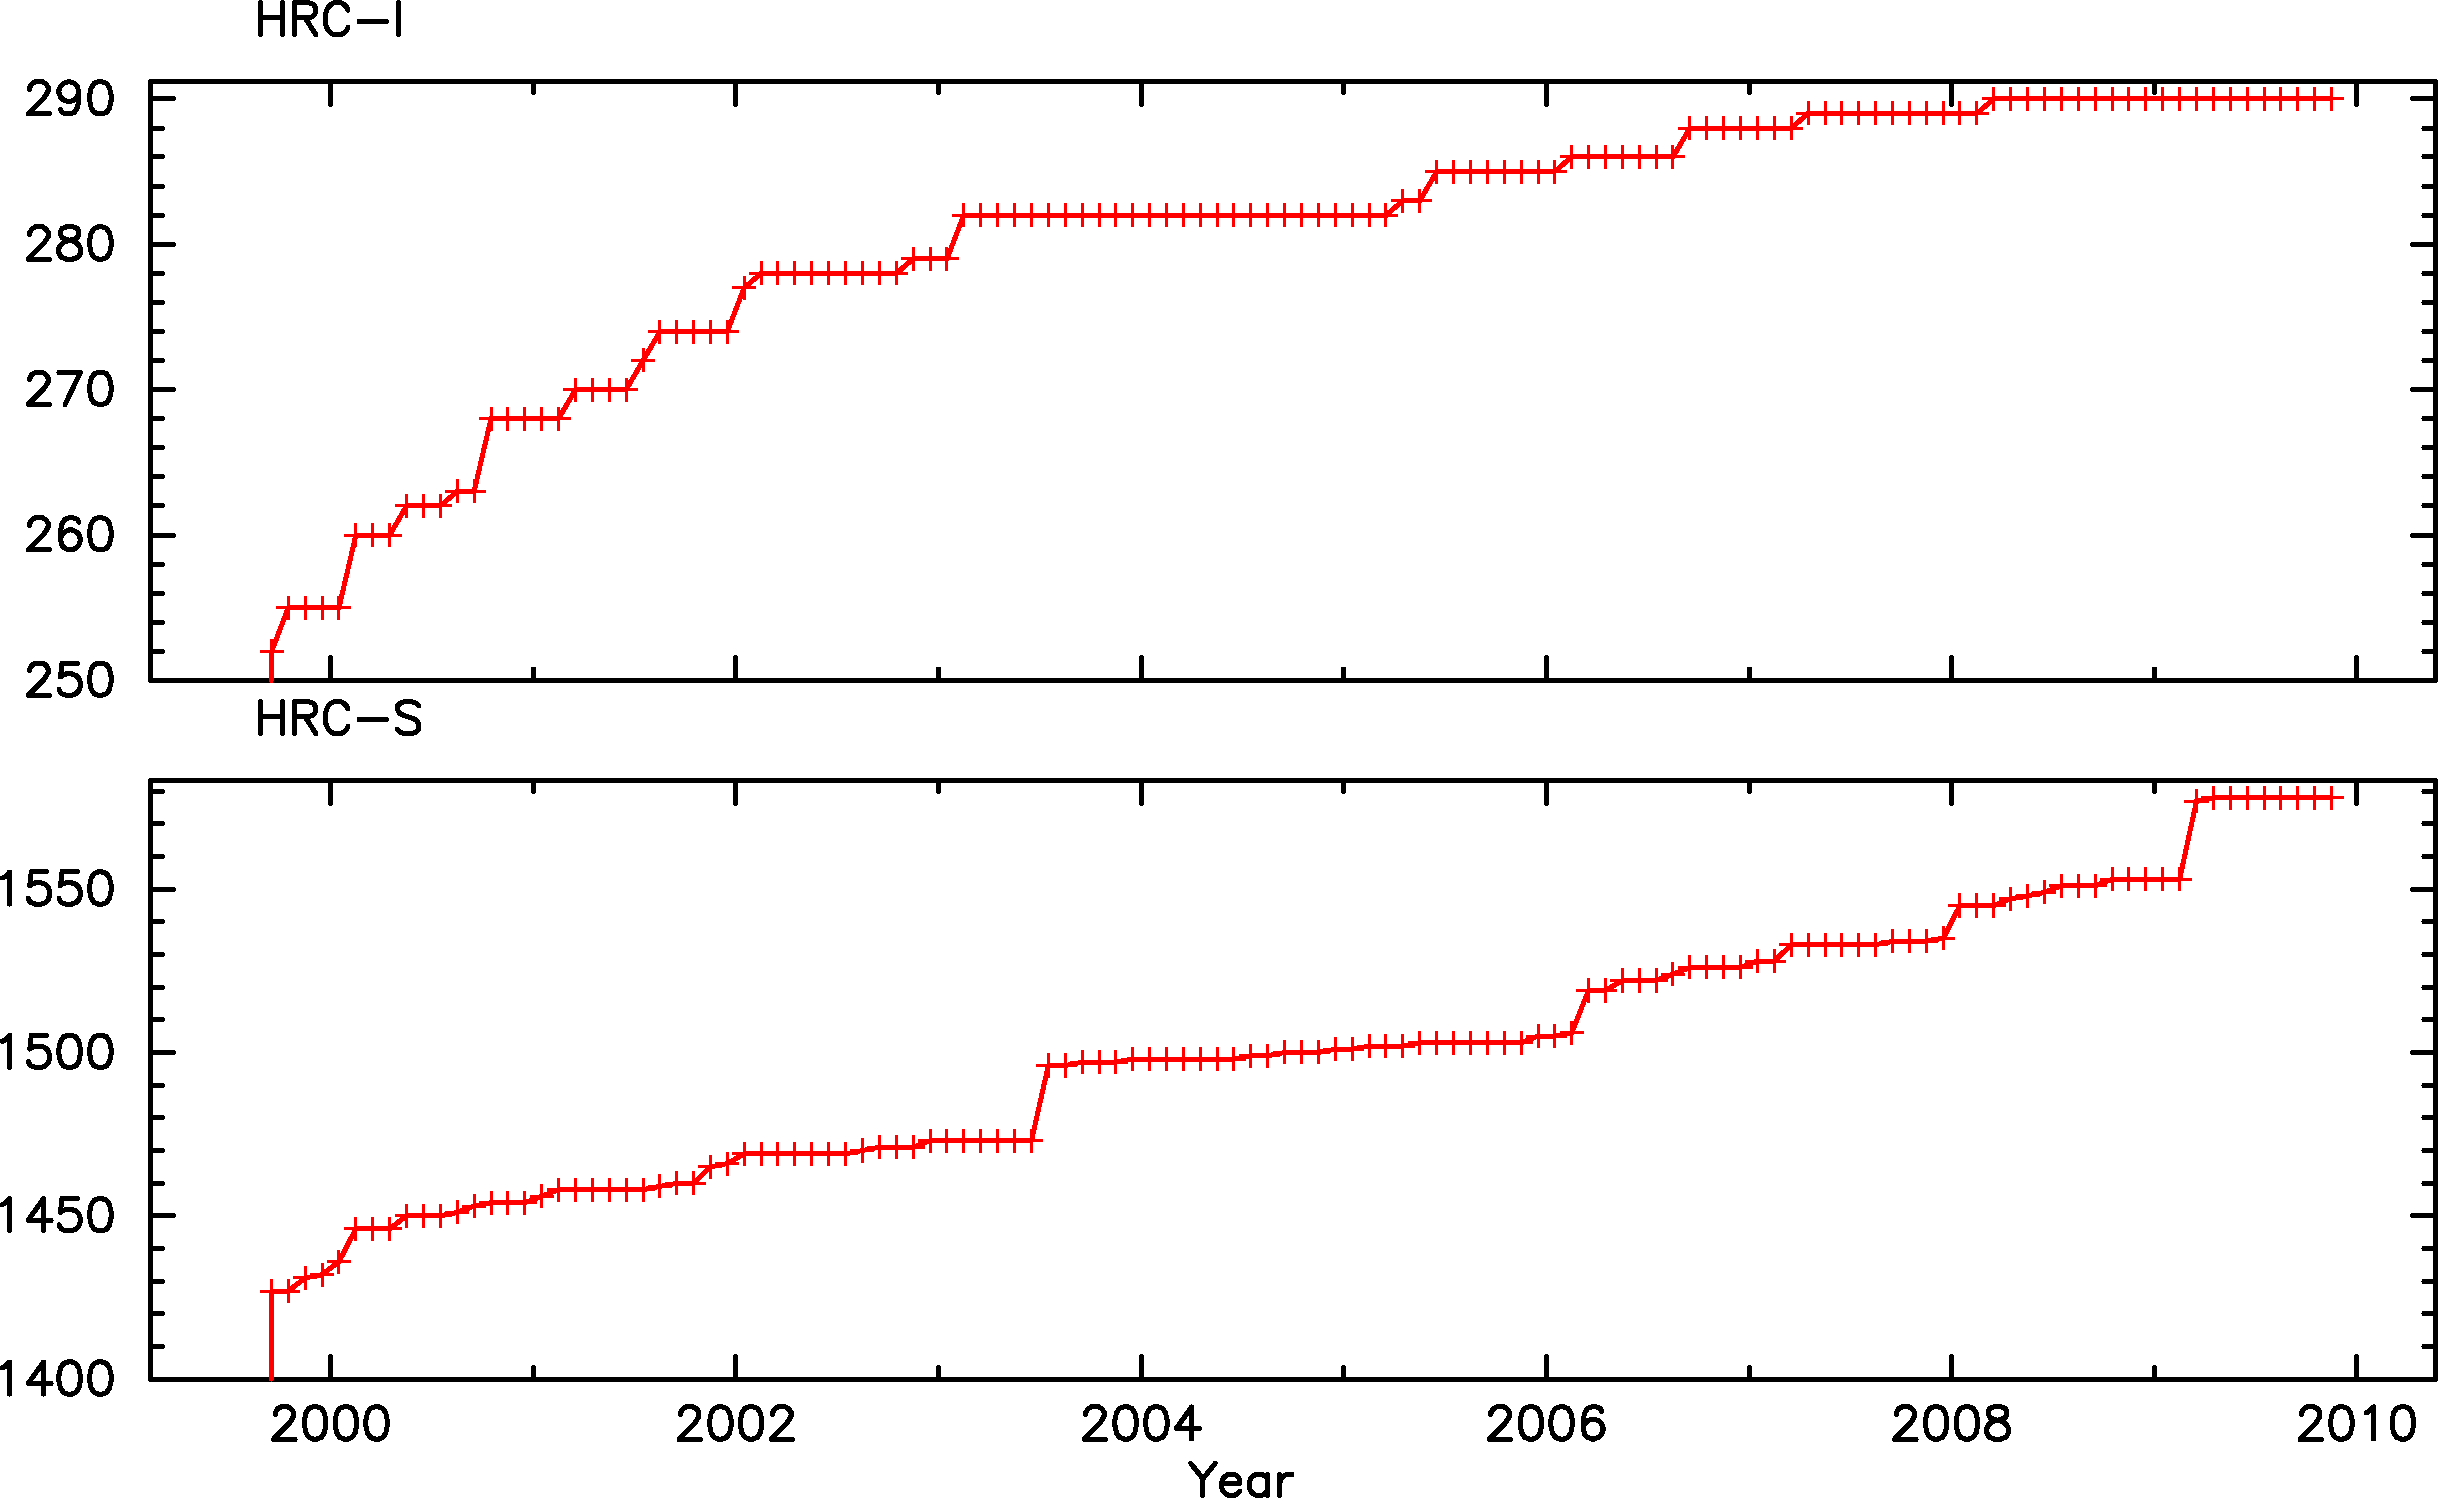
DOSE of Central 4K Pore-Pairs
Please refer to Maximum Dose Trends for more details.
)
        IMAGE                NPIX      MEAN    STDDEV      MIN       MAX
HRCI_11_2009.fits          16777216   0.015    0.038       0.0        2.0
)
        IMAGE                NPIX      MEAN    STDDEV      MIN       MAX
HRCI_08_1999_11_2009.fits  16777216   2.831    3.694       0.0       290.0
)
        IMAGE                NPIX      MEAN    STDDEV      MIN       MAX
HRCS_11_2009.fits          16777216   0.005    0.070       0.0        3.0
)
        IMAGE                NPIX     MEAN      STDDEV      MIN      MAX
HRCS_08_1999_11_2009.fits  16777216  12.491      20.630      0.0      1578.0
|
|
Max dose trend plots corrected for events that "pile-up"
in the center of the taps due to bad position information.
|
)
|
)
|
)
|
)
|
| Aug 2009 | May 2009 | Feb 2009 | Nov 2008 |
|---|
)
|
)
|
)
|
)
|
| Aug 2009 | May 2009 | Feb 2009 | Nov 2008 |
|---|
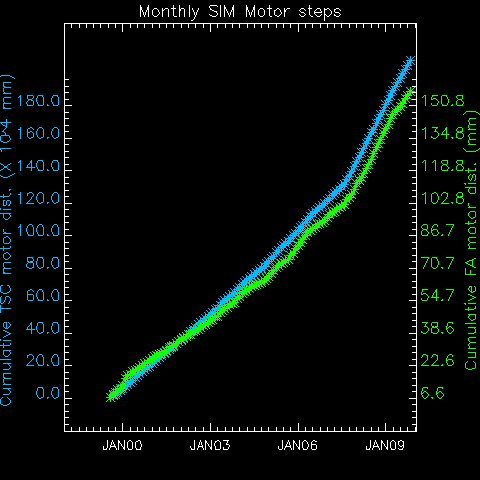
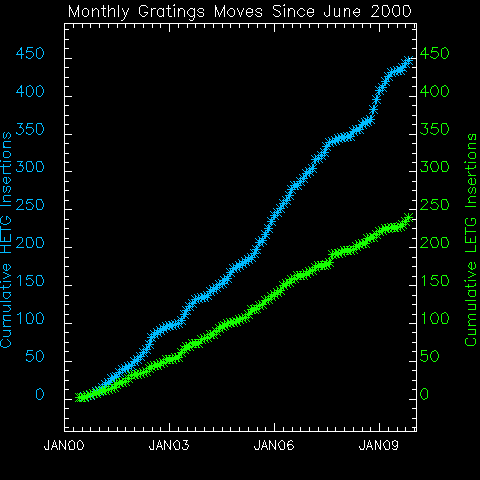
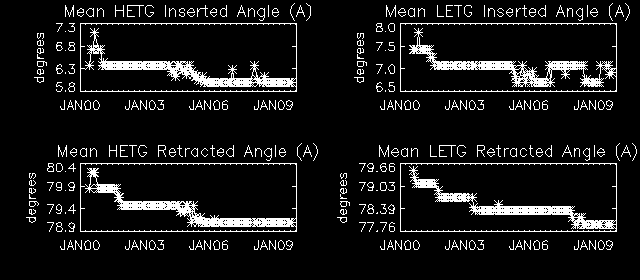
Gratings
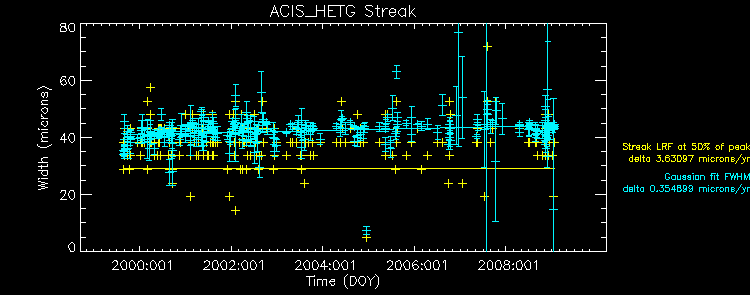
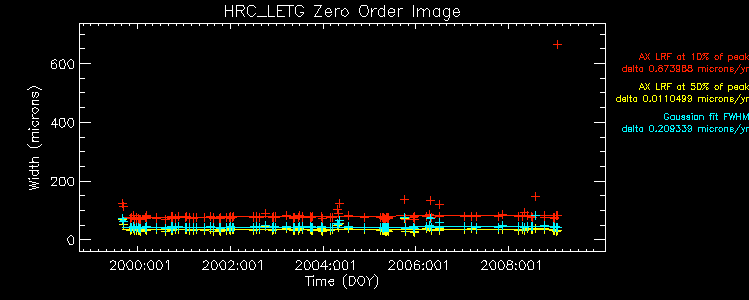
Focus
We plot the width of the zero order streak of ACIS/HETG observations and the width of the zero order image for HRC/LETG observations of point sources. No significant defocusing trend is seen at this time. See Gratings Focus pages. (NOTE: the figures are not updated from Mar 2009 due to a system problem.)
PCAD
ACA Trending
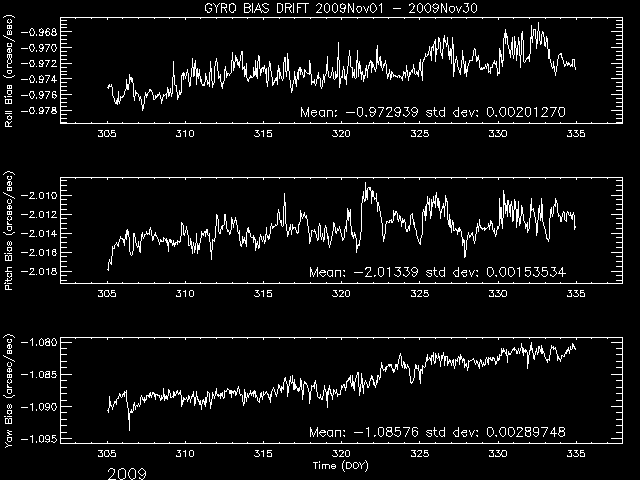
Gyro Bias Drift
-->
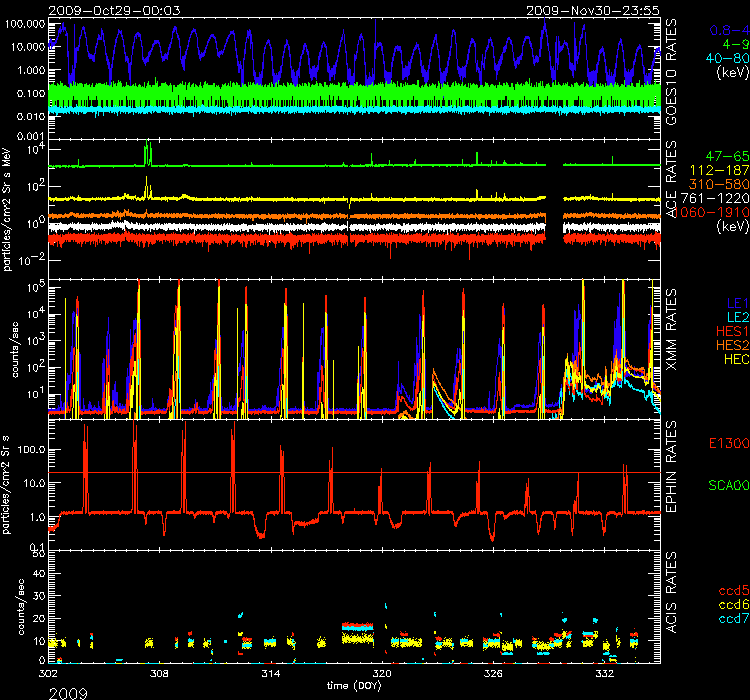
Radiation History
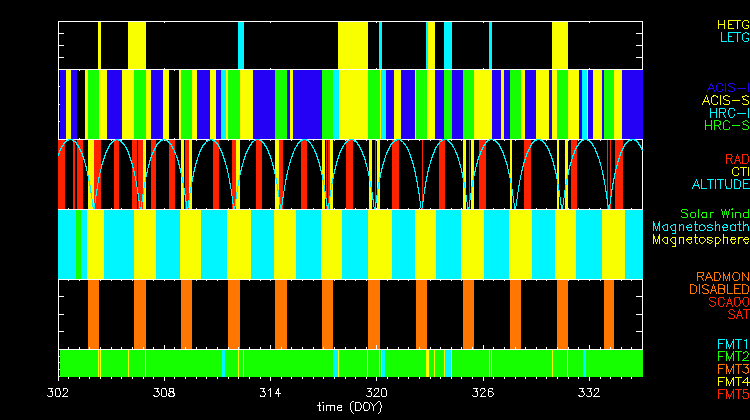
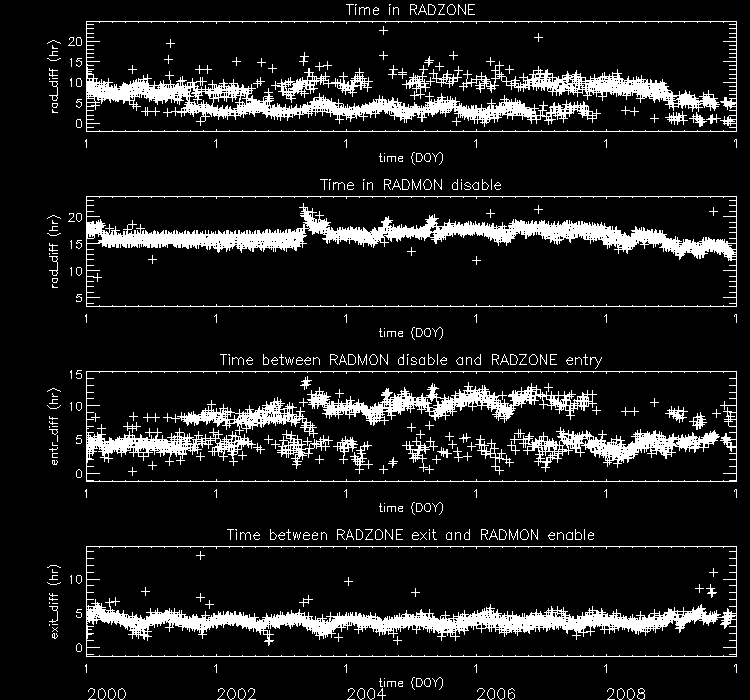
Radiation Zone Timing
Plotted below are radiation zone timing plots based on the following definitions of radiation zone:
- RADZONE - Ephin levels (in any of the E1300,P4GM,P41GM channels) are more than 1/3 of RADMON safing thresholds.
- RADMON - Radmon is disabled for radiation zone (as commanded based on OFLS model, for comparison with actual radiation levels).
- PERIGEE - Time of closest earth approach (for comparison)
Radiation Count Rates of Oct 2009
Trending
Quarterly Trends
| Ephin Temperature/Voltage | ||||||
|---|---|---|---|---|---|---|
| Previous Quarter | ||||||
| MSID | MEAN | RMS | DELTA/YR | DELTA/YR/YR | UNITS | DESCRIPTION |
| 5EIOT | 340.47 | 16.37 | -2.793e+01 | 2.872e+02 | K | EIO TEMP |
| 5EPHINT | 315.53 | 3.71 | 6.028e-01 | 1.727e+02 | K | EPHIN TEMP |
| HKEBOXTEMP | 320.13 | 3.75 | -2.972e-01 | 1.821e+02 | K | EPHIN HOUSEKEEPING EBOX: TEMPERATURE (5EHSE300) |
| HKGHV | 0.000e+00 | 0.000e+00 | 0.000e+00 | 0.000e+00 | HKGHV | |
| HKN6I | 73.16 | 0.31 | -9.759e-03 | 1.168e+01 | AMP | HK 6 Volts Rail - Current |
| HKN6V | -5.99 | 0.000e+00 | 0.000e+00 | 0.000e+00 | V | HK -6 Volts Rail - Voltage |
| HKP27I | 7.19 | 7.455e-02 | 5.448e-02 | 8.188e-01 | AMP | HK 27 Volts Rail - Current |
| HKP27V | 26.79 | 8.022e-04 | 1.978e-04 | 0.000e+00 | V | HK 27 Volts Rail - Voltage |
| HKP5I | 39.25 | 0.36 | -1.404e-01 | -9.134e-01 | AMP | HK 5 Volts Rail - Current |
| HKP5V | 5.10 | 0.000e+00 | 0.000e+00 | 0.000e+00 | V | HK 5 Volts Rail - Voltage |
| HKP6I | 135.89 | 0.53 | -1.297e-01 | 1.630e+01 | AMP | HK 6 Volts Rail - Current |
| HKP6V | 5.81 | 6.842e-03 | 9.491e-03 | -1.123e-01 | V | HK 6 Volts Rail - Voltage |
| TEIO | 313.60 | 18.67 | -3.086e+01 | 3.492e+02 | K | EPHIN ELECTRONICS HOUSING TEMP |
| TEPHIN | 315.58 | 3.85 | -1.221e+00 | 1.851e+02 | K | EPHIN SENSOR HOUSING TEMP |
)
)
)
)
)
)
)
)
)
)
)
)
)
)
Spacecraft Motions
|
|
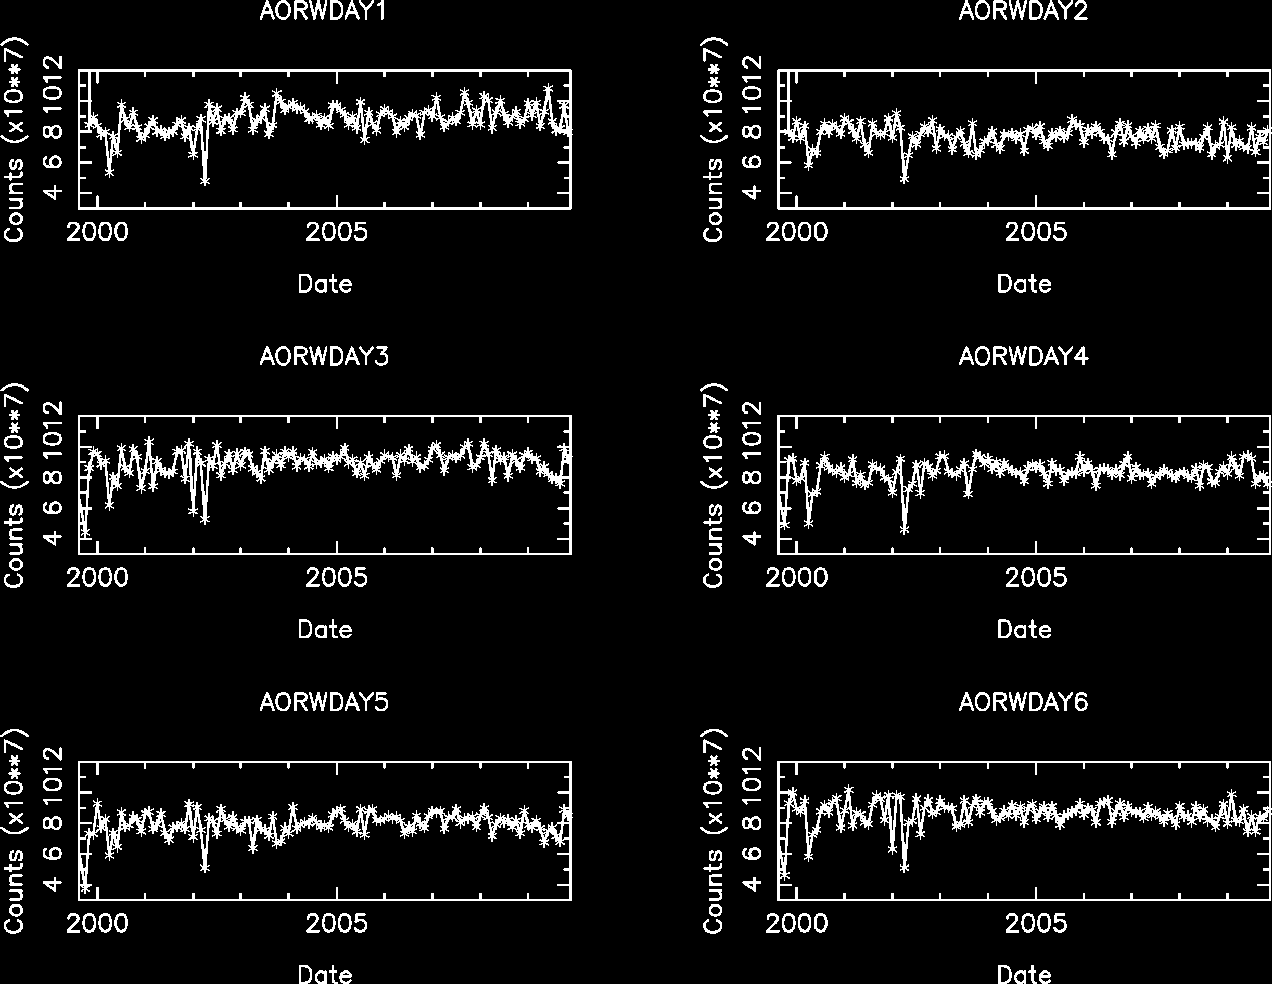
Reaction Wheel Rotations
Links to Past Monthly Reports
| Year | Month | |||||||||||
|---|---|---|---|---|---|---|---|---|---|---|---|---|
| 1999 | Jul | Aug | Sep | Oct | Nov | Dec | ||||||
| 2000 | Jan | Feb | Mar | Apr | May | Jun | Jul | Aug | Sep | Oct | Nov | Dec |
| 2001 | Jan | Feb | Mar | Apr | May | Jun | Jul | Aug | Sep | Oct | Nov | Dec |
| 2002 | Jan | Feb | Mar | Apr | May | Jun | Jul | Aug | Sep | Oct | Nov | Dec |
| 2003 | Jan | Feb | Mar | Apr | May | Jun | Jul | Aug | Sep | Oct | Nov | Dec |
| 2004 | Jan | Feb | Mar | Apr | May | Jun | Jul | Aug | Sep | Oct | Nov | Dec |
| 2005 | Jan | Feb | Mar | Apr | May | Jun | Jul | Aug | Sep | Oct | Nov | Dec |
| 2006 | Jan | Feb | Mar | Apr | May | Jun | Jul | Aug | Sep | Oct | Nov | Dec |
| 2007 | Jan | Feb | Mar | Apr | May | Jun | Jul | Aug | Sep | Oct | Nov | Dec |
| 2008 | Jan | Feb | Mar | Apr | May | Jun | Jul | Aug | Sep | Oct | Nov | Dec |
| 2009 | Jan | Feb | Mar | Apr | May | Jun | Jul | Aug | Sep | Oct | ||