CalDB 4.9.1 Public Release Notes
Public Release Date: 2020-04-03T16:00:00
SDP Installation Date: 2020-03-24T17:39:37 (UTC)
I. INTRODUCTION
CalDB 4.9.1 is an upgrade to the Chandra CalDB, which includes the following items:
- ACIS T_GAIN Epochs 79+80
- ACIS DET_GAIN/P2_RESP N0008
- HRC-S QEU Version N0013 file set
- ASPECT FDC N0004 Plate Scale Upgrades
For the CIAO 4.12 / CalDB 4.9.1 release notes see How CalDB 4.9.1 Affects Your Analysis.
II. SUMMARY OF CHANGES
A. ACIS T_GAIN Epochs 79+80
| Location: | $CALDB/data/chandra/acis/t_gain/ |
| Filename: | acisD2019-05-02t_gain_biN0002_revA.fits acisD2019-05-02t_gainN0002_revA.fits acisD2019-05-02t_gainN0005.fits acisD2019-05-02t_gainN0006.fits acisD2019-11-01t_gain_biN0002.fits acisD2019-11-01t_gainN0002.fits |
The ACIS Calibration team has released the semiannual time-dependent gain (T_GAIN) updates from analysis of External Calibration Source (ECS) data for the period Aug 01 2019 through Jan 31 2020 (epochs 79+80), and hence the above files have been generated as a result, for immediate release. The secular time variations in the corrections calculated from these new data are similar in magnitude and direction to previous upgrades, wherein maximal changes are a few percent or less of the deltaE/E value.
NOTE: Users with observations taken between (DATE-OBS=) 2019-05-02T12:00:00 and 2019-11-01T00:00:00 are advised to reprocess with their data with finalized versions of the applicable T_GAIN files. Users with observations taken since 2019-11-01T00:00:00 will have access to an updated provisional T_GAIN file (one of the version N0002 filenames above); They will not however have a finalized T_GAIN until after Epochs 81+82 (Feb 01 - Jul 31 2020) are completed.
For a presentation of the specific values, see the Technical Details Section below. For more information on the ACIS time-dependent gain in general, see the ACIS T_GAIN why page.
PIPELINES/TOOLS AFFECTED:
ACIS Level 1 pipeline tool acis_process_events.
CIAO script chandra_repro uses acis_process_events to reprocess ACIS observation data.
THREADS AFFECTED:
Reprocessing Data to Create a New Level=2 Event File
B. ACIS DET_GAIN/P2_RESP N0008
| Location: | $CALDB/data/chandra/acis/det_gain/ |
| Filename: | acisD2000-01-29gain_ctiN0008.fits |
| Location: | $CALDB/data/chandra/acis/p2_resp/ |
| Filename: | acisD2000-01-29p2_respN0008.fits |
A small depression in the gains at mid-chip (+/- 20 columns around CHIPX=512) of the ACIS Front-illuminated (FI) chips has persisted since the beginning of the mission, but has not yet been accounted for in the DET_GAIN or T_GAIN files for ACIS for these chips. The FI chips are ACIS-0, 1, 2, 3, 4, 6, 8, and 9. The gain depression appears as a 1-3% "droop" in the pulse heights with some energy dependence. The effect has been corrected in the DET_GAIN files version N0008 above, for non-GRADED mode cases only at this point.
Note that the back-illuminated (BI) chips are not affected by this gain droop in any case. Hence, ACIS-S1 (ACIS-5) and ACIS-S3 (ACIS-7) gains have not been altered.
The corrections have been effected using ACIS External Calibration Source (ECS) data only, specifically the available lines Mn-L complex, Al-Ka, Ti-Ka, and Mn-Ka and -Kb. Corrections have been implemented for all eight of the FI chips over the full chip. The tiling of the FI chips DET_GAIN data has been changed from 256 x 32 pixels (in chipx, chipy) to 32 x 32 pixels. It was original the tiling of the FI chip DET_GAIN data that in fact resulted in ignoring the gain droop as a matter of course in the ACIS FI chip gain calibrations; That is being addressed in DET_GAIN version N0008, which hence contains a considerably larger array of data for each FI chip. Hence the file size is much larger than its predecessors.
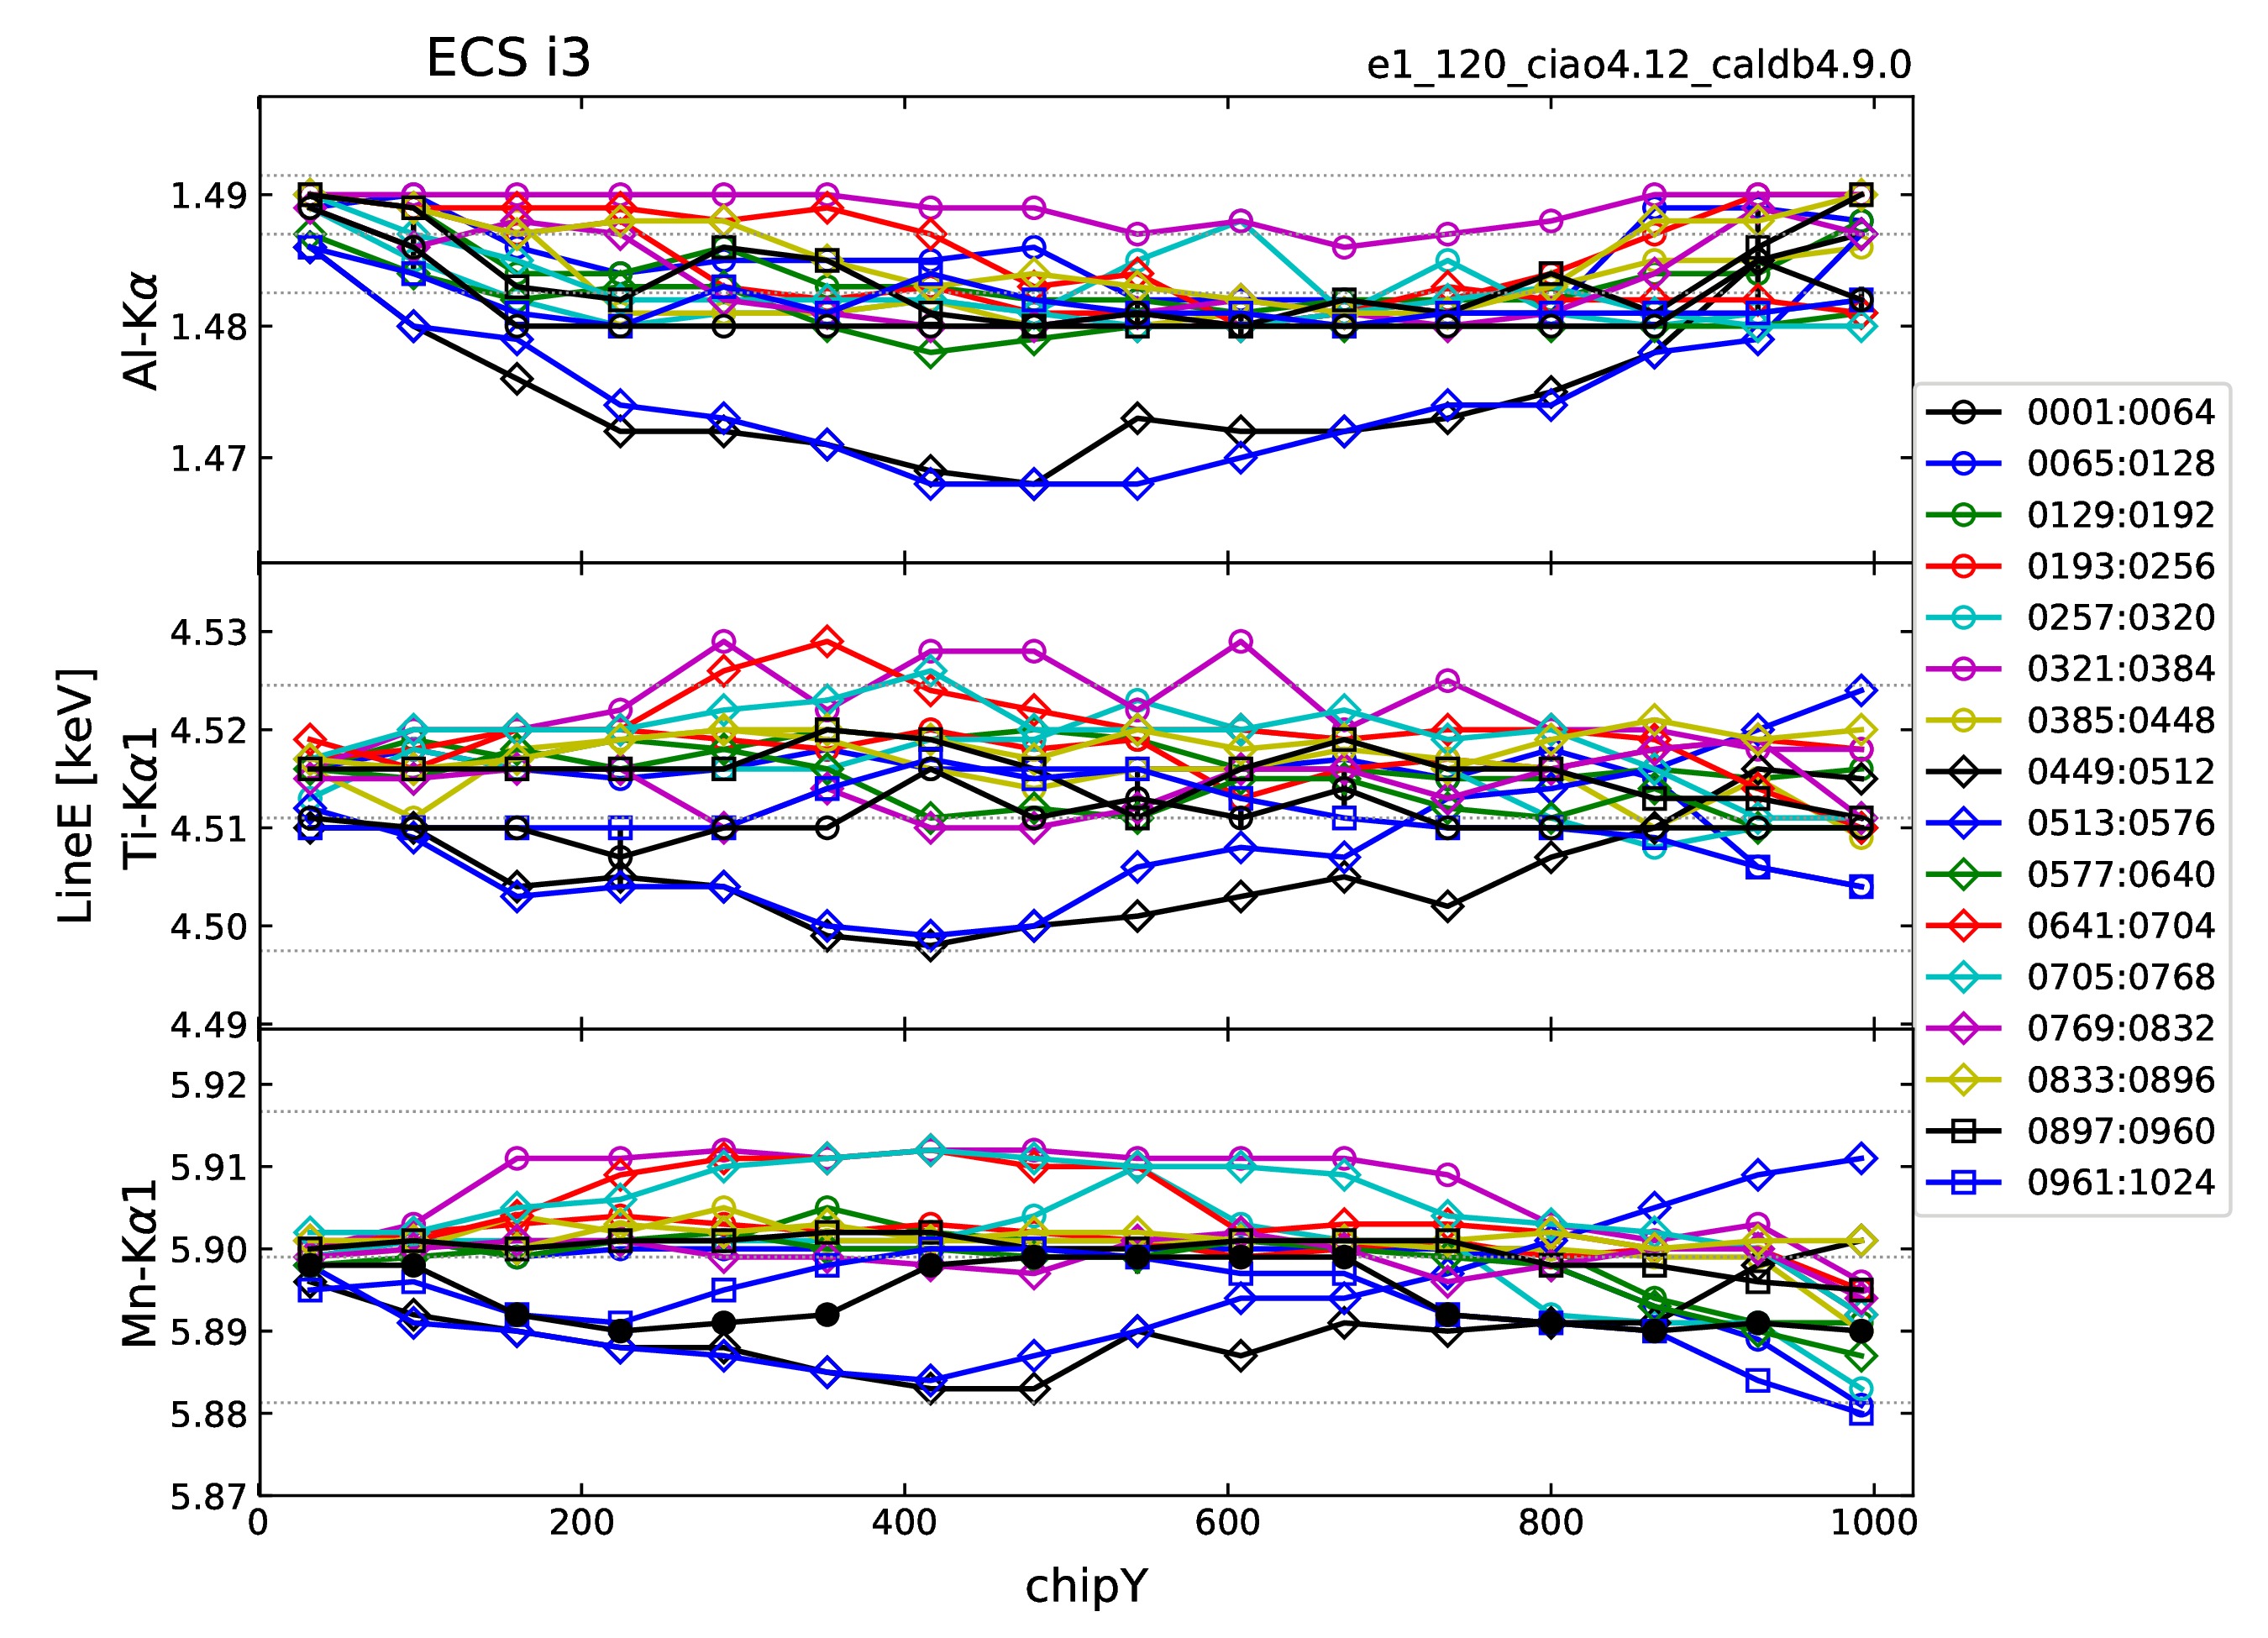
Fig. 1a: ACIS External Calibration Source line centroid energies as a function of CHIPY using the uncorrected ACIS DET_GAIN file (version N0007) in CalDB v4.9.0 and earlier releases. A depression in the gain values at near mid-CHIPX values (black and blue traces with diamond symbols) is evident. |
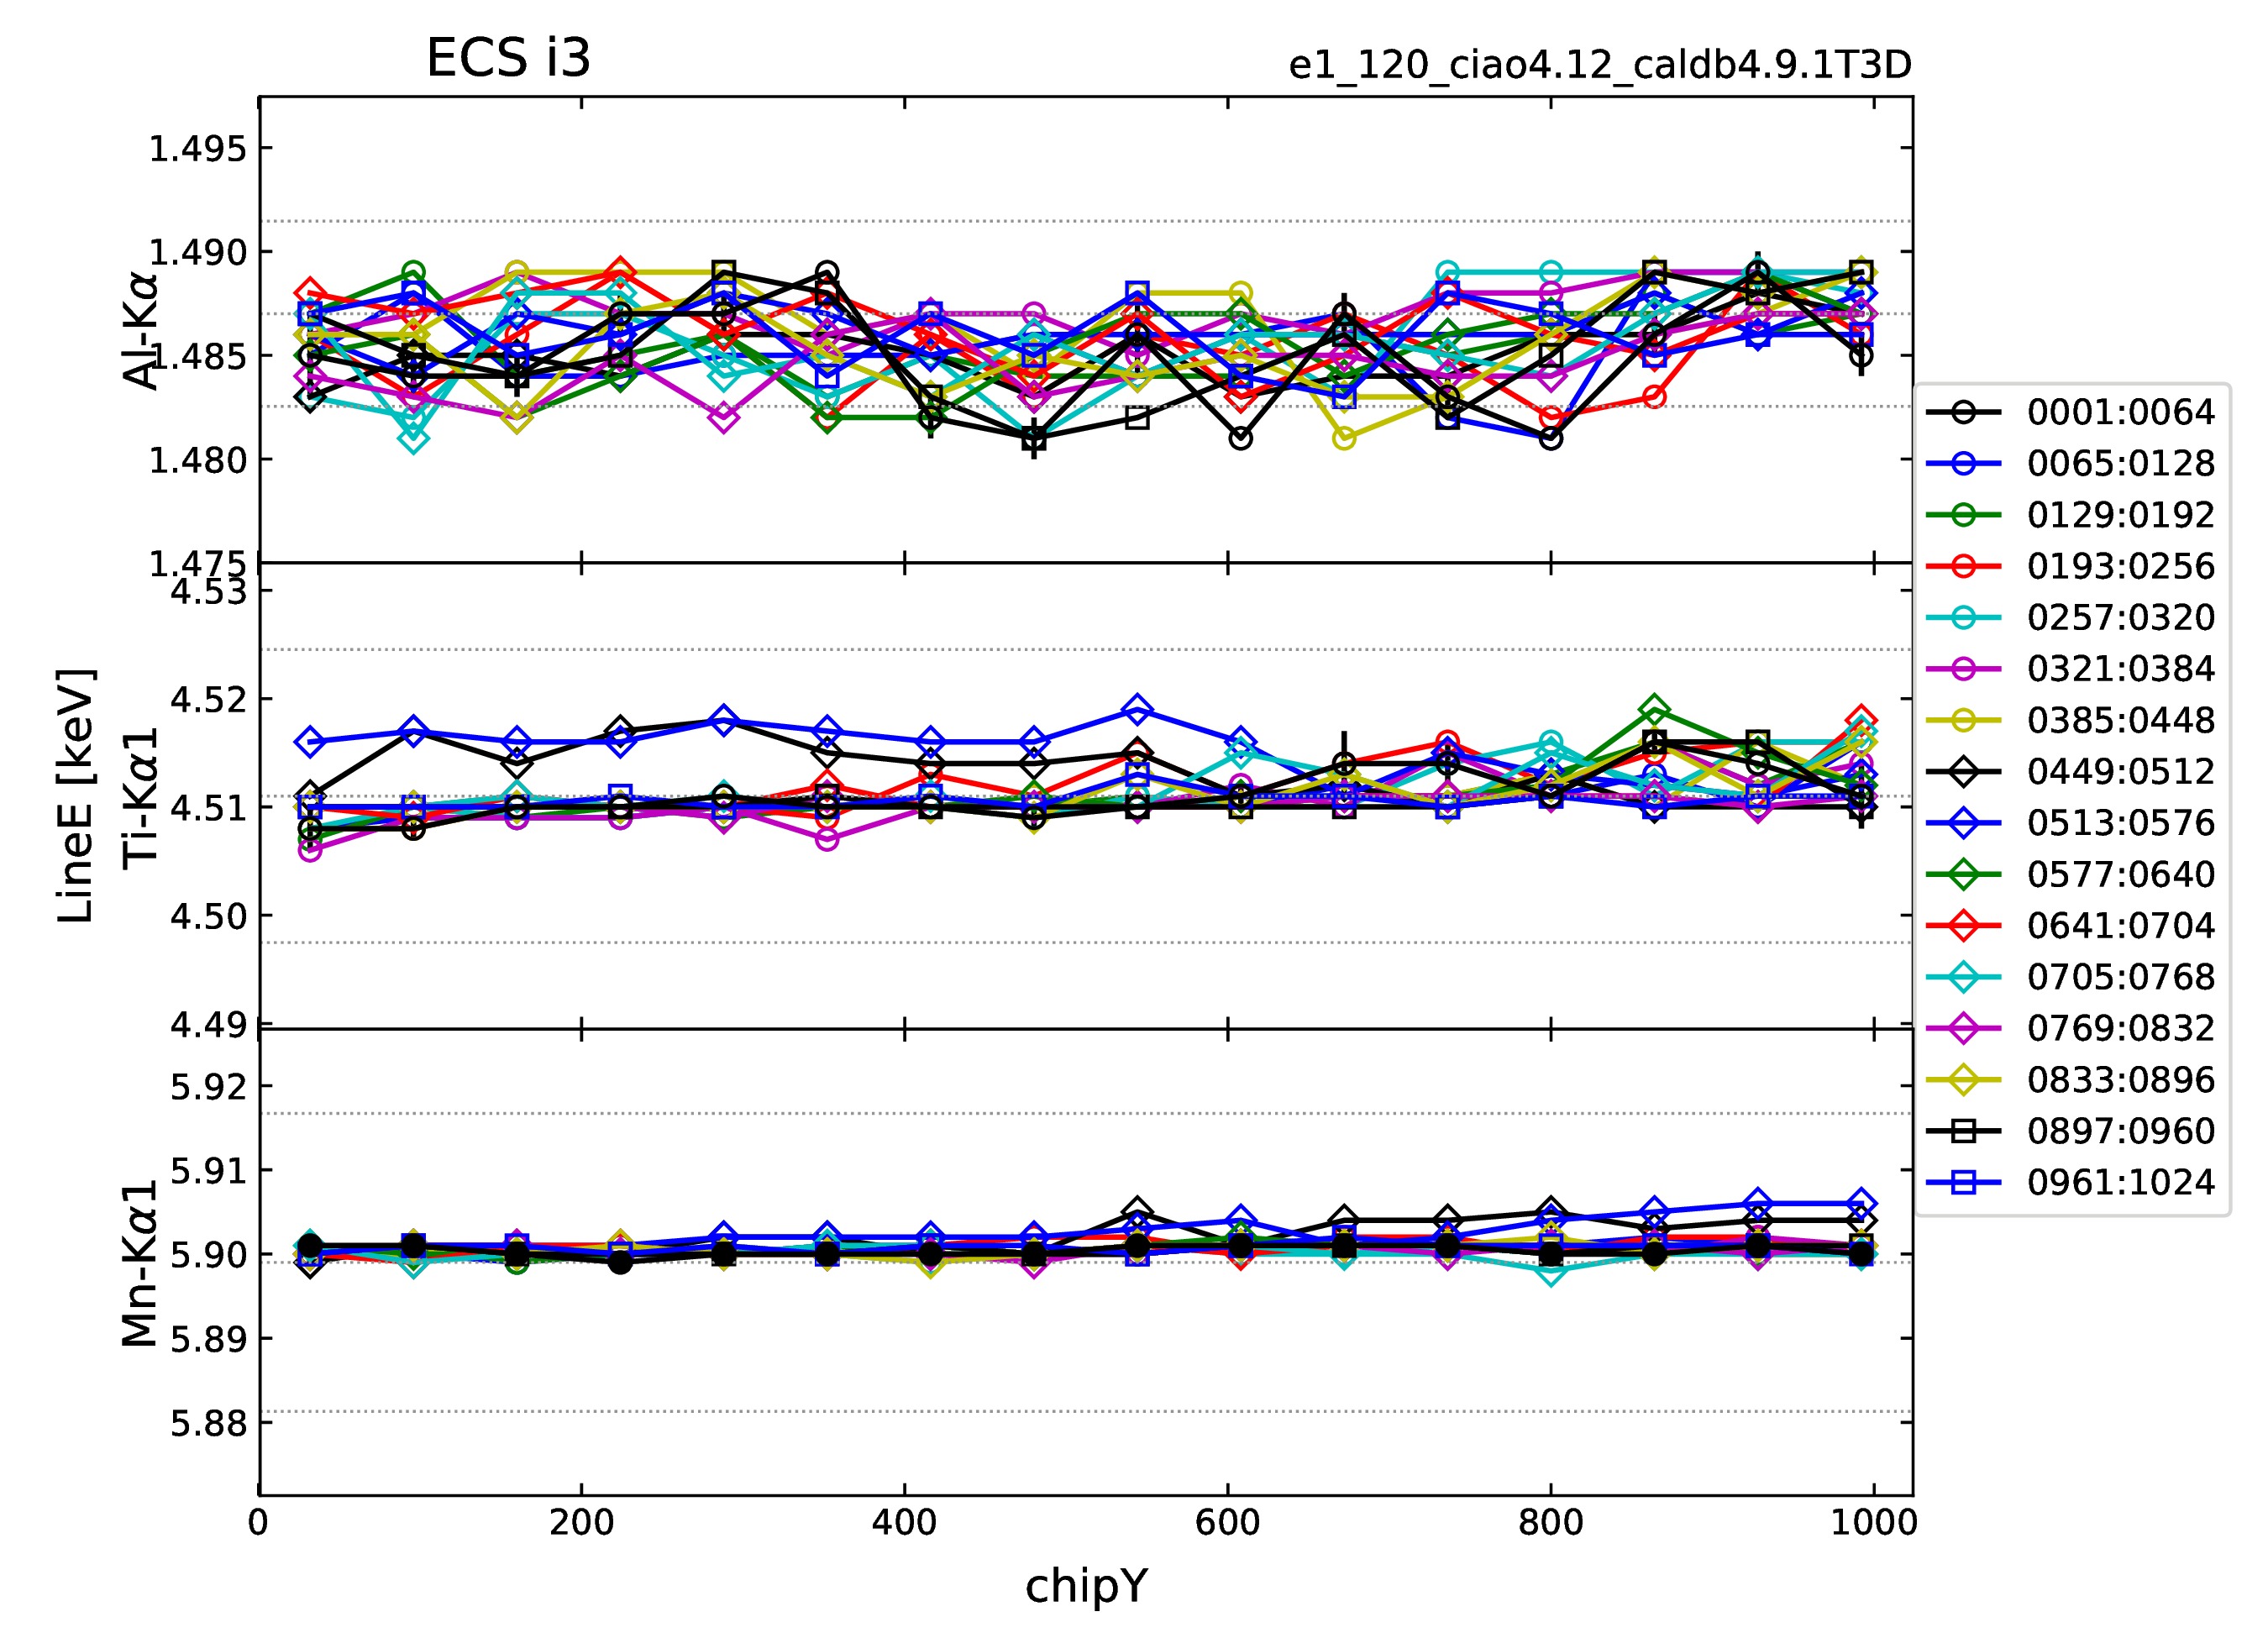
Fig. 1b: The same ECS line sources with the new DET_GAIN N0008 file in released in CalDB v4.9.1. The visible "gain droop" at mid-CHIPX values (black and blue diamond traces) is clearly removed. |
Regarding the N0008 P2_RESP file, there is no change to the FI chip (or BI chip) RMF calibrations themselves, but only in the FI chip gains as they apply to the RMFs. Structurally, only the third and fourth extensions (Blocks 4 and 5) have changed, and only to accommodate the changes in the DET_GAIN file tiling as described above. Additionally in Block 4, the L1_POS column has been adjusted to compensate for the new DET_GAIN values that apply to each of the FI chips. In other words, the P2_RESP and DET_GAIN files have to be matched. Furthermore, because the tile numbering has changed for both the FI AND BI chips, the output of mkacisrmf will appear somewhat different as well, for both FI and BI (back-illuminated) chips, from the output when using the version N0007 files in previous CalDB releases.
For technical details, including some illustration of the corrections implemented, see Section III.B below.
PIPELINES/TOOLS AFFECTED:
ACIS Level 1 pipeline tool acis_process_events.
CIAO script chandra_repro uses acis_process_events to reprocess ACIS observation data.
THREADS AFFECTED:
Reprocessing Data to Create a New Level=2 Event File
C. HRC-S QEU Version N0013 file set
| Location: | $CALDB/data/chandra/hrc/qeu/ |
| Filenames: | hrcsD1999-07-22qeuN0013.fits hrcsD2000-01-01qeuN0013.fits hrcsD2001-01-01qeuN0013.fits hrcsD2002-01-01qeuN0013.fits hrcsD2003-01-01qeuN0013.fits hrcsD2004-01-01qeuN0013.fits hrcsD2005-01-01qeuN0013.fits hrcsD2006-01-01qeuN0013.fits hrcsD2007-01-01qeuN0013.fits hrcsD2008-01-01qeuN0013.fits hrcsD2009-01-01qeuN0013.fits hrcsD2009-08-08qeuN0013.fits hrcsD2010-09-14qeuN0013.fits hrcsD2012-03-29qeuN0013.fits hrcsD2012-10-05qeuN0013.fits hrcsD2013-09-21qeuN0013.fits hrcsD2015-02-17qeuN0013.fits hrcsD2016-02-22qeuN0013.fits hrcsD2016-07-28qeuN0013.fits hrcsD2017-01-23qeuN0013.fits hrcsD2017-06-05qeuN0013.fits hrcsD2017-09-26qeuN0013.fits hrcsD2018-01-19qeuN0013.fits hrcsD2018-05-27qeuN0013.fits hrcsD2018-09-26qeuN0013.fits hrcsD2019-02-24qeuN0013.fits hrcsD2019-08-22qeuN0013.fits |
As the LETGS calibration team continues to monitor the accelerated rate of decay in the HRC-S quantum efficiency as a function of wavelength, they have elected to replace the current set of time dependent QE Uniformity (QEU) files (version N0012) with another new set of files, now version N0013. One additional file has been added to the set, with new effective date of 2019-08-22T00:00:00, so that the set includes 27 files now. See the technical details section below for illustrations and details of the derivation of these new QE Uniformity corrections.
See also the why page for more general information on the HRC-S QE/QEU corrections in the CalDB.
CIAO SCRIPTS/TOOLS AFFECTED:
See the script fluximage, which uses mkinstmap
THREADS AFFECTED:
For exposure-corrected imaging analysis with HRC-S, see the thread:
For grating spectroscopy with the LETG/HRC-S, see the thread:
D. ASPECT FDC N0004 Plate Scale Upgrades
| Location: | $CALDB/data/chandra/pcad/fdc/ |
| Filename: | acapD1999-07-22fdcN0004.fits |
The star and fid light aca plate scale coefficients in the FDC CALDB describe polynomials which convert from CCD (row, col, ACA housing temperature) to (Y_angle, Z_angle). The Chandra ASPECT calibration team has upgraded the FDC CALDB file with a recalibration that significantly reduces error in recent data due to increased ACA house temperature. This new calibration preserves performance in historical data at colder ACA housing temperatures.
The new calibration for both stars and fid lights has been verified over a set of observations covering the range of observed ACA housing temperatures and shows expected results. The calibration process and validation are captured in Jupyter notebooks at https://cxc.cfa.harvard.edu/mta/ASPECT/aca_plate_scale/calib_2020/.
PIPELINES/TOOLS AFFECTED:
The ASPECT Level 1 pipeline in DS 10.8.3, implemented on 24 March 2020.
THREADS AFFECTED:
NONE. Aspect pipeline tools are not available in CIAO.
III. TECHNICAL DETAILS
A. ACIS T_GAIN Epochs 79+80
The ACIS T_GAIN epoch 79+80, combining two quarterly epochs, and covering the period of Aug 01 2019 through Jan 31, 2020 has recently been completed, and the ACIS External Calibration Source (ECS) radiation zone data has been reduced to generate the time-dependent gain correction tables for this period. The two epochs are being combined, as is now the standard practice with T_GAIN upgrades, to produce a single new T_GAIN correction update.
The magnitudes (in eV) of the new gain corrections, versus photon energy, are given in Figs. 1-3 below. Fig. 2 below gives the corrections for the ACIS-I aimpoint on chip ACIS-3, for the CTI-corrected case, which is the only one applicable to FI chips. Figure 3 gives the corrections for the ACIS-S aimpoint on ACIS-7, for the case where the BI chips are CTI-corrected. Finally Fig. 4 gives the corrections for ACIS-7 for NON-CTI-corrected BI chips. These would be relevant to GRADED DATAMODE observations with ACIS-S3, where no CTI correction is available.
Fig. 2: Time dependent gain corrections versus photon energy for the ACIS-I aimpoint on ACIS-I3
(CHIPX=970, CHIPY=975) for the new and recent comparable T_GAIN files in CalDB. The parallel CTI
correction for the FI chips has been applied to all data.
Fig. 3: Time-dependent gain corrections versus energy for the ACIS-S aimpoint on ACIS-7
(CHIPX=210, CHIPY=520) for the new and recent comparable CalDB T_GAIN files. For these data,
the series and parallel CTI correction for the BI chips has been applied.
Fig. 4: T_GAIN correctons versus energy for the ACIS-S aimpoint on ACIS-7, this time with
no CTI correction applied to the data, as would be the case for GRADED DATAMODE observations.
Long term trends for chips I3 and S3 are plotted below in Figures 5a and b, through Epoch 80, which includes the latest release. The chip locations for these plots are given in the respective labels above the plots. The chip locations selected are near the aimpoints, as with Figs 2 and 3 above. The full CTI correction has been applied to the data in both figures.
Fig. 5a: Long-term T_GAIN correction tgain_trends at the ACIS-I3 aimpoint, for specific ECS line energies, from Epoch 1 to Epochs 77+78. |
Fig. 5b: Long term T_GAIN correction tgain_trends at the aimpoint of ACIS-S3, for specific ECS line energies, from Epoch 1 to Epochs 77+78. |
B. ACIS DET_GAIN/P2_RESP N0008
The MIT ACIS Memorandum #PS-172 with the subject "Deterioration of charge transfer in the center of the FI CCDs", dated October 4, 1999, by Gregory Prigozhin, discusses the discovery by Leisa Townsley "that for the events in top rows of the chip S2 pulse heights plotted as a function of column number exhibit a noticeable drop in amplitude in the very center of the array." This is the first reference we have which acknowledges a very narrow (+/-~20 columns surrounding CHIPX=512) central gain "droop" in the FI chips. The effect is absent at CHIPY=0, and increases gradually till the top of the chips (CHIPY=1024). At the Mn Ka line of the ACIS ECS, the effect is at maximum approximately 50 ADU out of 1400 at the TOP of S2, or about a 3.6% effect.
The current DET_GAIN file values seem to compensate somewhat for the droop near the tops of these chips, however, and so the actual corrections to those data are at the level of about 2% maximum, and the affected regions extend primarily between CHIPY=100-900, with some energy dependence. Corrections have been derived for the full area of all eight of the FI chips in the ACIS Array. The "gain_cti" file which applies to the non-GRADED mode cases is the only one that has been upgraded at this point. The "gain_cit" file for GRADED DATAMODES has not been corrected, though presumably the gain droop effect exists on FI chips for that case as well.
Figure 6 below gives the spatial appearance of the gain droop on ACIS-S2 at Mn Ka, with -120C focal plane temperature. Displayed a little differently is the corresponding effect on ACIS-I3 is Figure 7, wherein the two lowest traces both magenta in color, one solid, one dashed, for positions at about 20 pixels to either side of mid- chip. The corrected file quite effectively removes this effect from all of the FI chips, as shown in Figs. 8a and 8b for one particular case on ACIS-I3.

Fig. 6: Pulseheights of the center pixel as a function of column number for rows 924-1024 on ACIS-S2, at the Mn Ka line energy, for a -120C focal plane temperature. This is the effect at the top of the chip as realized in G. Prigozhin's October 4, 1999 memorandum. |
Fig. 7: Traces of Al Ka line position as a function of CHIPY for distributed CHIPX values across ACIS-I3. The solid rose (CHIPX=480) and dashed magenta (CHIPX=544) show the "gain droop" effect in columns displaced about +/- 30 pixels from the central column, where the effect is about 1.3% near the center of the chip. |
Fig. 8a: ACIS-I3 energy errors in percent for the various ECS line energies. For the left column, the values are derived from the ACIS DET_GAIN file N0007; for the right, they are from the newly corrected and released N0008 DET_GAIN file. Top frames: Mn L complex; Center frames: Al Ka; Bottom frames Ti Ka. |
Fig. 8b: Continuing from Fig. 7a. Top frames are for Mn Ka; the second row frams are for Mn Kb. |
C. HRC-S QEU Version N0013 file set
Since roughly the beginning of 2017, due to evolution of the HRC-S gain, (tg_lam,pi) background filtering has been rejecting an increasing proportion of valid longest-wavelength positive order events. Gain and PI filter recalibration are priorities and will be revisited soon. Meanwhile, until now the QEU has been calibrated to such filtered spectra, but beginning with the N0011 release, unfiltered spectra will be used instead.
This HRC-S QEU N0013 update incorporates the latest HZ 43 LETG calibration observations into the analysis. Using these most recent data, the post HV-change (2012-04 and later) wavelength-independent linear QE decline has been set to 2.55%/yr for 0th order, and set to 2.38%/yr for dispersed orders. The Fig. 9 below also shows what additional empirical wavelength-dependent dispersed order corrections are required to match the HZ 43 fiducial WD model.
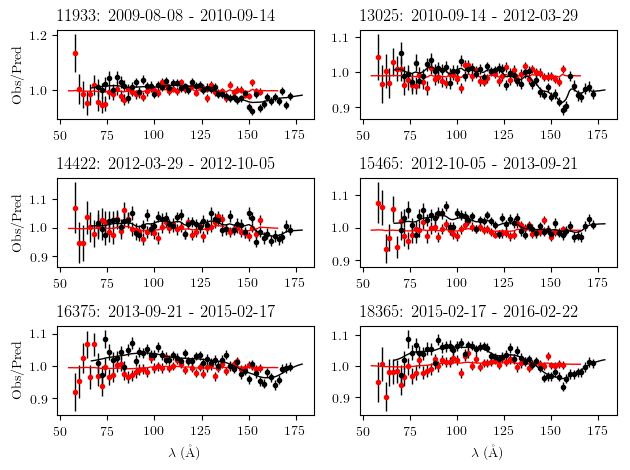
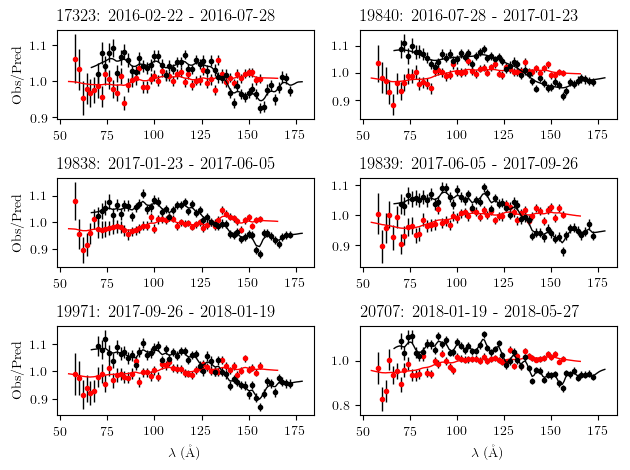
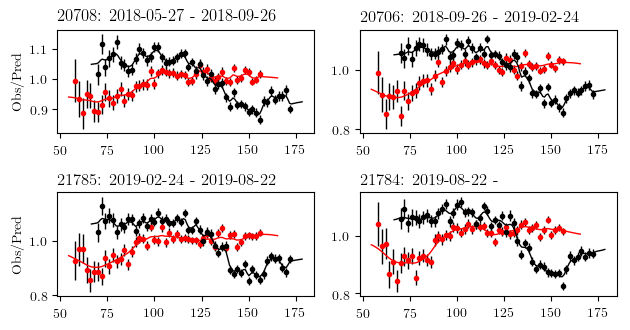
Fig. 9: The residual wavelength-dependent continuous autoregressive moving average model correction for
each epoch's QEU CalDB file, after the linear temporal wavelength-independent QE decline has been applied.
Red curves are negative dispersed orders, black are positive orders.