- M&TA MONTHLY REPORT -
MAY 2010
Configuration/Radiation Overview for May 2010
ACIS
The steps we took to compute the dose map are;
- Level 1 Event files for a specified month are obtained from archive.
- Image data including I2, I3, S2, S3 CCDs are extracted from all event files.
- All the extracted image data were merged to create a month long exposure map for the month.
- The exposure map is opened with ds9, and check a distribution of count rates against energy.
From this, estimate the upper threshold value. Any events beyond this upper threshold are
assumed erroneous events such as bad pixels.
- Using this upper threshold, the data is filtered, and create a cleaned exposure map for the month.
- The exposure map from each month from the Sep 1999 is added up to create a cumulative exposure
map for each month.
- Using fimgstatistic, we compute count rate statistics for each CCDs.
- For observations with high data drop rates (e.g., Crab nebula, Cas A), we corrected the
observations by adding events.
Note: Counts and RMS's of Cumulative maps are lower than the previous months.
This is because we excluded extreme outliers.
Please check more detail plots at
Telemetered Photon Dose Trend page.
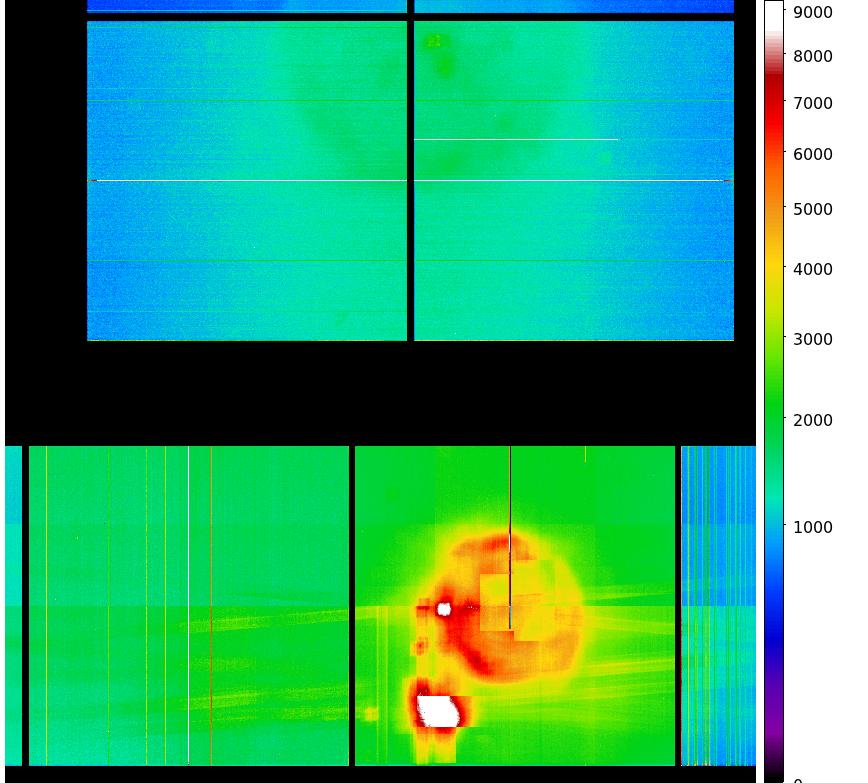
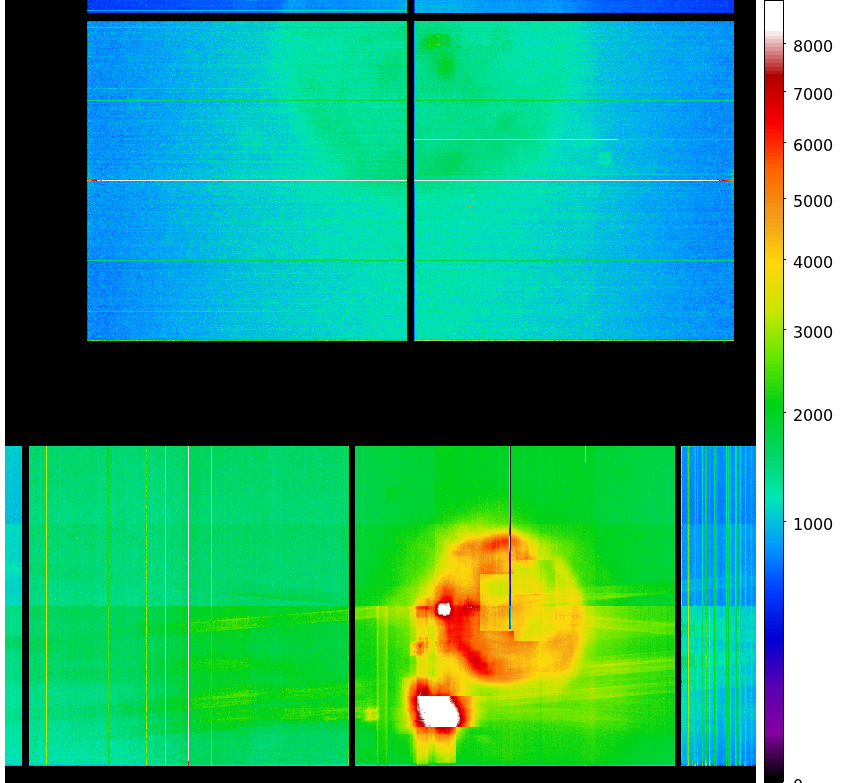
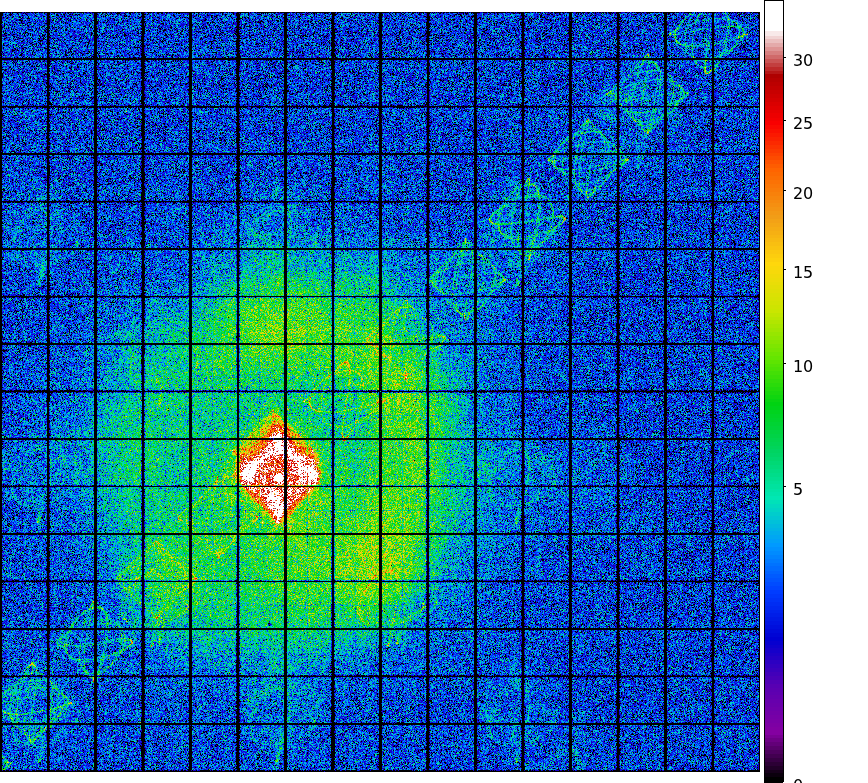
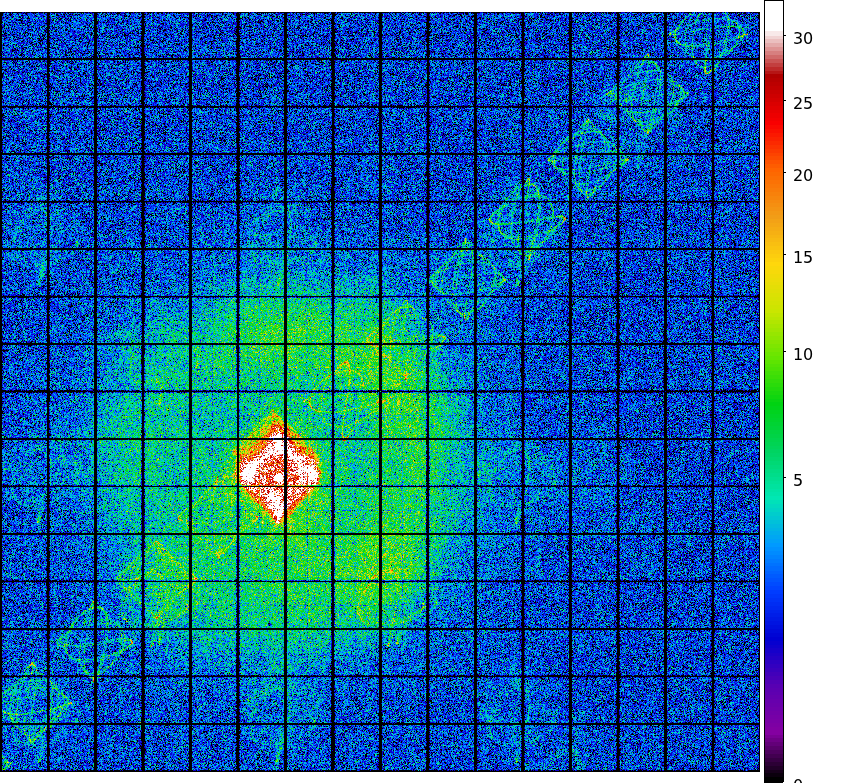
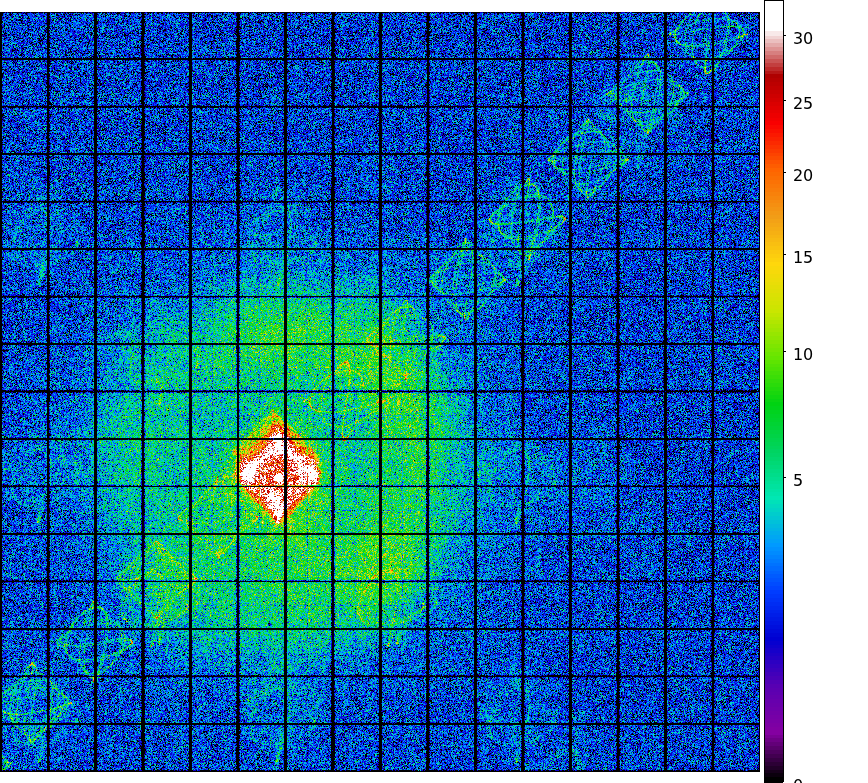
MAY registered-photon-map in fits
Statistics:
# IMAGE     NPIX        MEAN           RMS              MIN     MAX
ACIS_may10 6004901       9.582         15.090           0.0     735.0

 I2 node 0  262654      11.883659       4.218744        0.0      75.0
 I2 node 1  262654      12.551297       4.875038        0.0     335.0
 I2 node 2  262654      12.370049       4.299858        0.0      72.0
 I2 node 3  262654      12.311202       4.682735        0.0      68.0

 I3 node 0  262654      13.002949       4.623376        0.0      70.0
 I3 node 1  262654      13.700562       13.540160       0.0     677.0
 I3 node 2  262654      12.318239       4.210315        0.0      83.0
 I3 node 3  262654      12.299690       4.307314        0.0     195.0

 S2 node 0  262654      11.966866       4.534031        0.0     579.0
 S2 node 1  262654      12.423957       5.213050        0.0      92.0
 S2 node 2  262654      12.754592       4.878462        0.0     124.0
 S2 node 3  262654      12.171842       4.382651        0.0     640.0

 S3 node 0  262654      12.545102       5.323041        0.0      90.0
 S3 node 1  262654      13.775615       5.058473        0.0      95.0
 S3 node 2  262654      12.782958       3.778879        1.0      51.0
 S3 node 3  262654      11.641445       3.569516        0.0      44.0
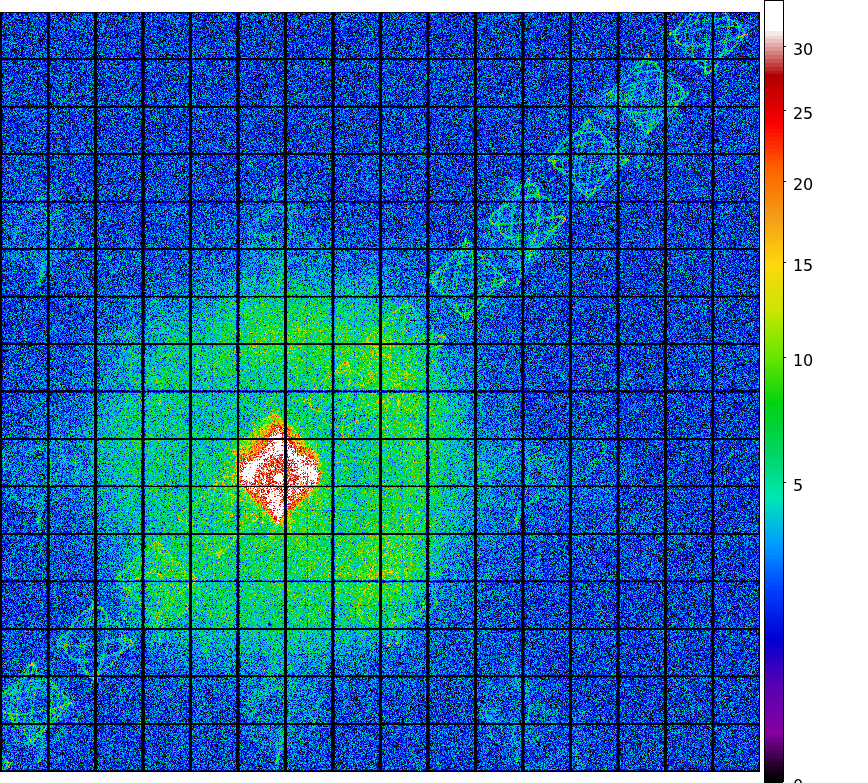
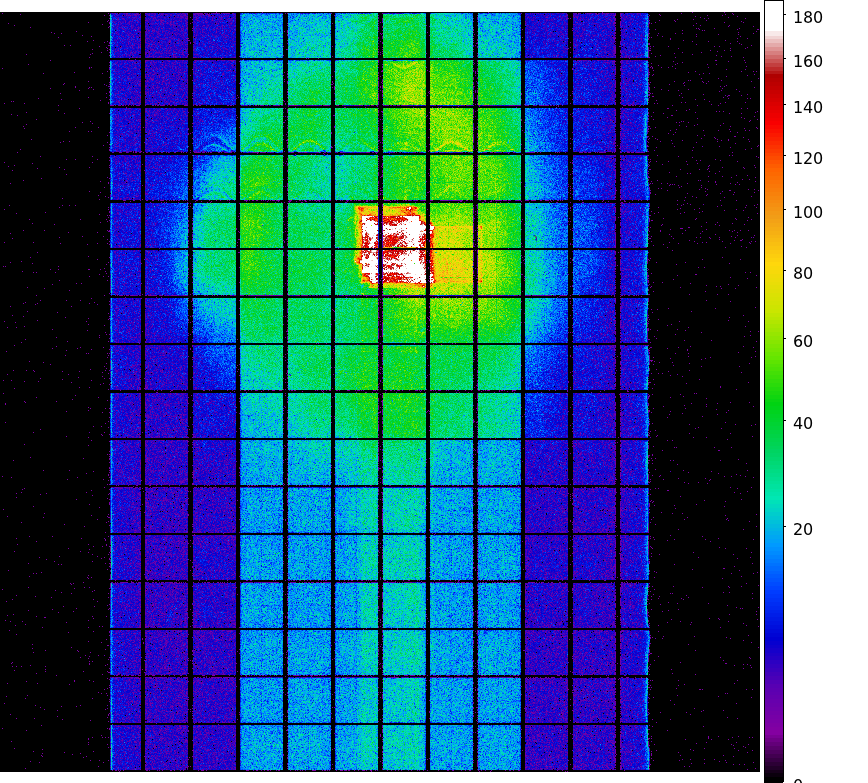
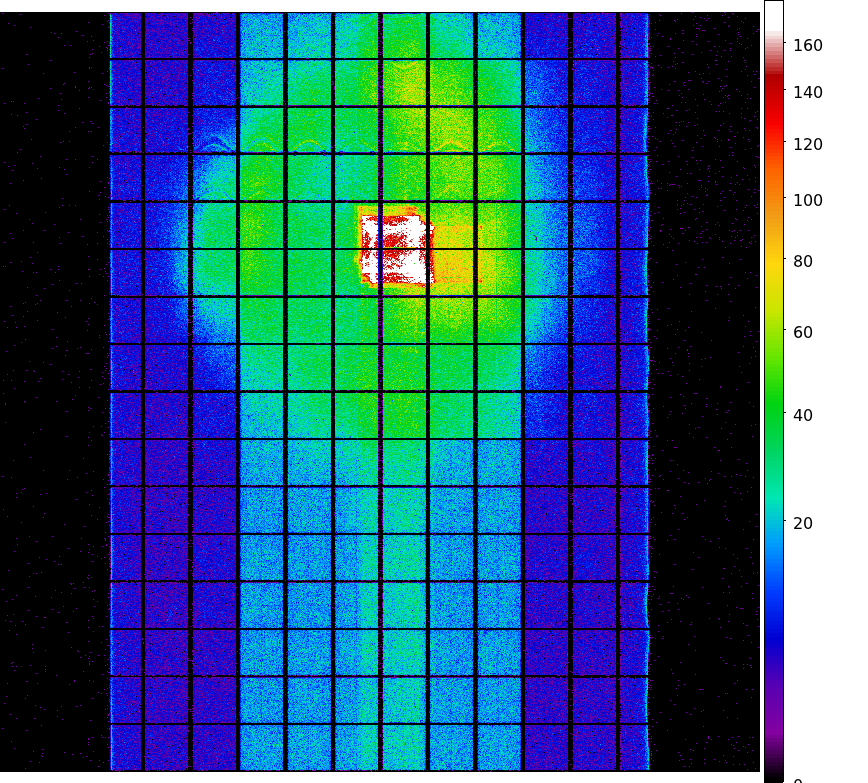
Jul 1999 - May 2010 registered-photon-map in fits
Statistics:
 IMAGE        NPIX      MEAN          RMS              MIN    MAX
ACIS_total  6004901    1394.78          1880.57         0.0    84954.0

 I2 node 0  262654      1132.403362     214.956955      0.0     5388.0
 I2 node 1  262654      1193.321743     286.873655      0.0     21224.0
 I2 node 2  262654      1230.920620     267.784580      0.0     8699.0
 I2 node 3  262654      1226.198703     312.088258      0.0     27517.0

 I3 node 0  262654      1289.022523     316.212119      0.0     6106.0
 I3 node 1  262654      1351.765892     993.888501      0.0     25802.0
 I3 node 2  262654      1169.253647     207.943621      0.0     5316.0
 I3 node 3  262654      1157.384067     223.603147      0.0     21015.0

 S2 node 0  262654      1672.831047     227.310751      845.0   19986.0
 S2 node 1  262654      1778.609703     373.976480      873.0   9581.0
 S2 node 2  262654      1970.635026     365.820580      1126.0  13616.0
 S2 node 3  262654      1896.413956     258.555007      1102.0  27981.0

 S3 node 0  262654      2831.009723     1340.450034     1171.0  11325.0
 S3 node 1  262654      4077.311189     1831.289533     0.0     12139.0
 S3 node 2  262654      3063.428317     857.360058      1097.0  7674.0
 S3 node 3  262654      2339.805365     374.722939      1245.0  8865.0
Integrated Exposure Maps of Last 12 Months
|

|

|
|
| Feb 2010 |
Nov 2009 |
Aug 2009 |
May 2009 |
We report CTIs with a refined data definition. CTIs were computed for the temperature
dependency corrected data.
Please see
CTI page
for detailed explanation.
CTI's are computed for Mn K alpha, and defined as slope/intercept x10^4 of row # vs ADU.
Data file:
here
May 2010 Focal Temperature
-->
| The Mean (max) FPT: |
|---|
| -112.13 | +/- 4.20 C |
| Mean Width: |
|---|
| 0.42 | +/- 0.31 days |
Averaged Focal Plane Temperature
We are using 10 period moving averages to show
trends of peak temperatures and peak widths.
Note, the gaps in the width plot are due to missing/corrupted data.
Focal Plane Temperature and Sun Angle, Earth Engle, and Altitude
The plots below were generated with a new warm pixel finding script. Please see
Acis Bad Pixel Page
for details.
Front Side CCDs
Back Side CCD (CCD5)
| Name | Low (keV) | High(KeV) | Description |
|---|
| SSoft | 0.00 | 0.50 | Super soft photons |
|---|
| Soft | 0.50 | 1.00 | Soft photons |
|---|
| Med | 1.00 | 3.00 | Moderate energy photons |
|---|
| Hard | 3.00 | 5.00 | Hard Photons |
|---|
| Harder | 5.00 | 10.00 | Very Hard photons |
|---|
| Hardest | 10.00 | | Beyond 10 keV |
|---|
This page shows scientific instrument background data based on Acis
observations. A source region file is generated using get_srcregions
and then the input event file is filtered using the regions in that file
to remove the sources.
The following three plots show trends of SIB from year 2000. CCDs shown here are CCD3,
CCD5, and CCD7. Fitted lines are linear fit after eliminating extreme outliers.
For >10 keV plots, 2 lines are fit. One is with a 13 keV filter, and another without.
CCD 3
CCD 5
CCD 7
We collected data from acis histogram mode data, and created trend plots of peak portions
and peak widths against time (DOM). The peaks were estimated by fitting a simple Gaussian
on three peaks (Al, Ti, and Mn), and the widths were estimated by a width at the half max
from the peak.
All histogram data are taken under TIMED and GRADED_HIST mode, SIM position is at an external
calibration source position, the focal temperature is around -119.7 C, and parameter settings
in aciselec, acistemp are set to about same for all.
CCD 3, Peak Position
CCD 3, Peak Widths
CCD 3, Count Rates
TOP
HRC
Please refer to Maximum Dose Trends for more details.
MAY HRC-I Dose in fits
        IMAGE                NPIX      MEAN    STDDEV      MIN       MAX
HRCI_05_2010.fits          16777216   0.008    0.104       0.0       18.0
AUG 1999 - MAY 2010 HRC-I Dose in fits
        IMAGE                NPIX      MEAN    STDDEV      MIN       MAX
HRCI_08_1999_05_2010.fits  16777216   3.239    4.084       0.0       292.0
MAY HRC-S dose fits image - no observations
AUG 1999 - MAY 2010 HRC-S Dose in fits
        IMAGE                NPIX     MEAN      STDDEV      MIN      MAX
HRCS_08_1999_05_2010.fits  16777216  13.052      21.953      0.0      1619.0

|
|
Max dose trend plots corrected for events that "pile-up"
in the center of the taps due to bad position information.
|
HRC I: Integrated Exposure Maps of Last 12 Months
|
|
|
|
| Feb 2010 |
Nov 2009 |
Aug 2009 |
May 2009 |
HRC S: Integrated Exposure Maps of Last 12 Months
|
|

|

|
| Feb 2010 |
Nov 2009 |
Aug 2009 |
May 2009 |
TOP
PCAD
ACA Trending - Entire Period
ACA Trending - May 2010
TOP
Radiation Zone Timing
Plotted below are radiation zone timing plots based on the following definitions of radiation zone:
- RADZONE - Ephin levels (in any of the E1300,P4GM,P41GM channels) are more than 1/3 of RADMON safing thresholds.
- RADMON - Radmon is disabled for radiation zone (as commanded based on OFLS model, for comparison with actual radiation levels).
- PERIGEE - Time of closest earth approach (for comparison)
Radiation Count Rates of May 2010
Sun Spot History
TOP
Trending
- ACIS Thermal
| Previous Quarter |
| MSID | MEAN | RMS | DELTA/YR | DELTA/YR/YR | UNITS | DESCRIPTION |
| 1CBAT |
203.99 |
1.29 |
-1.572e+00 |
1.676e+01 |
K |
CAMERA BODY TEMP. A |
| 1CBBT |
204.49 |
1.49 |
-1.881e+00 |
8.778e+00 |
K |
CAMERA BODY TEMP. B |
| 1CRAT |
146.29 |
2.32 |
-7.187e-01 |
-2.698e+01 |
K |
COLD RADIATOR TEMP. A |
| 1CRBT |
146.82 |
2.53 |
-1.740e+00 |
-2.869e+01 |
K |
COLD RADIATOR TEMP. B |
| 1DACTBT |
256.34 |
1.57 |
1.224e+00 |
1.565e+02 |
K |
DA COLLIMATOR TEMP. B |
| 1DEAMZT |
285.06 |
4.46 |
-5.787e+00 |
-1.137e+01 |
K |
DEA -Z PANEL TEMP |
| 1DPAMYT |
286.32 |
5.18 |
-6.833e+00 |
4.406e+01 |
K |
DPA -Y PANEL TEMP |
| 1DPAMZT |
289.49 |
4.92 |
-5.983e+00 |
3.496e+01 |
K |
DPA -Z PANEL TEMP |
| 1OAHAT |
241.50 |
1.26 |
6.171e-01 |
7.343e+01 |
K |
OPEN ACTUATOR HOUSING TEMP. A |
| 1OAHBT |
237.74 |
1.08 |
8.395e-02 |
8.222e+01 |
K |
OPEN ACTUATOR HOUSING TEMP. B |
| 1PDEAAT |
304.30 |
9.51 |
1.327e+01 |
1.143e+03 |
K |
PSMC DEA PS A TEMP |
| 1PDEABT |
295.97 |
9.37 |
1.316e+01 |
1.119e+03 |
K |
PSMC DEA PS B TEMP |
| 1PIN1AT |
290.82 |
8.52 |
1.130e+01 |
1.014e+03 |
K |
PSMC TEMP 1A |
| 1WRAT |
187.54 |
1.61 |
-2.141e+00 |
-6.647e+00 |
K |
WARM RADIATOR TEMP. A |
| 1WRBT |
187.29 |
1.50 |
-2.082e+00 |
-9.975e-01 |
K |
WARM RADIATOR TEMP. B |
- ACIS Electronics
| Previous Quarter |
| MSID | MEAN | RMS | DELTA/YR | DELTA/YR/YR | UNITS | DESCRIPTION |
| 1DE28AVO |
28.89 |
0.21 |
1.757e+00 |
-1.321e+01 |
V |
DEA +28V INPUT A |
| 1DEICACU |
1.53 |
0.34 |
4.024e-02 |
2.041e+01 |
AMP |
DEA INPUT CURRENT A |
| 1DEN0AVO |
-6.33 |
9.220e-02 |
-4.674e-02 |
-7.025e+00 |
V |
DEA -6V VOLTAGE A |
| 1DEN1AVO |
-15.97 |
0.31 |
-1.385e-01 |
-2.175e+01 |
V |
DEA -15V VOLTAGE A |
| 1DEP0AVO |
6.17 |
3.825e-02 |
1.617e-02 |
3.374e+00 |
V |
DEA +6V VOLTAGE A |
| 1DEP1AVO |
15.92 |
0.29 |
1.231e-01 |
2.008e+01 |
V |
DEA +15V ANALOG A |
| 1DEP2AVO |
25.02 |
0.12 |
1.606e-01 |
8.082e+00 |
V |
DEA +24V ANALOG A |
| 1DEP3AVO |
30.47 |
0.12 |
-8.540e-02 |
7.855e-01 |
V |
DEA +28V ANALOG A |
| 1DP28AVO |
28.91 |
0.21 |
1.751e+00 |
-1.268e+01 |
V |
DPA +28V INPUT A |
| 1DPICACU |
1.22 |
0.23 |
-1.649e-01 |
2.095e+01 |
AMP |
DPA INPUT CURRENT A |
| 1DPP0AVO |
5.27 |
3.085e-02 |
-2.722e-03 |
3.148e+00 |
V |
DPA +5V ANALOG A |
- DEA/DPA HK
| Previous Quarter |
| MSID | MEAN | RMS | DELTA/YR | DELTA/YR/YR | UNITS | DESCRIPTION |
| DEAHK1 |
16.98 |
4.85 |
-4.656e+00 |
-6.365e-01 |
C |
DPA Thermistor 1 - BEP PC Board |
| DEAHK2 |
15.20 |
4.96 |
-4.827e+00 |
2.488e+00 |
C |
DPA Thermistor 2 - BEP Oscillator |
| DEAHK3 |
17.76 |
8.19 |
-6.376e+00 |
3.363e+02 |
C |
DPA Thermistor 3 - FEP 0 Mongoose |
| DEAHK4 |
16.06 |
6.88 |
-5.707e+00 |
2.213e+02 |
C |
DPA Thermistor 4 - FEP 0 PC Board |
| DEAHK5 |
17.92 |
7.75 |
-6.520e+00 |
3.196e+02 |
C |
DPA Thermistor 5 - FEP 0 ACTEL |
| DEAHK6 |
17.48 |
7.20 |
-6.404e+00 |
2.723e+02 |
C |
DPA Thermistor 6 - FEP 0 RAM |
| DEAHK7 |
14.19 |
6.30 |
-5.797e+00 |
1.706e+02 |
C |
DPA Thermistor 7 - FEP 0 Frame Buf. |
| DEAHK8 |
22.18 |
5.63 |
-3.442e+00 |
-9.249e+01 |
C |
DPA Thermistor 8 - FEP 1 Mongoose |
| DEAHK9 |
18.83 |
5.91 |
-5.884e+00 |
1.863e+02 |
C |
DPA Thermistor 9 - FEP 1 PC Board |
| DEAHK10 |
21.68 |
5.74 |
-3.610e+00 |
-2.304e+01 |
C |
DPA Thermistor 10- FEP 1 ACTEL |
| DEAHK11 |
20.74 |
5.85 |
-3.739e+00 |
-1.173e+01 |
C |
DPA Thermistor 11- FEP 1 RAM |
| DEAHK12 |
15.36 |
5.94 |
-5.897e+00 |
1.574e+02 |
C |
DPA Thermistor 12- FEP 1 Frame Buf. |
| DEAHK19 |
-0.15 |
1.197e-02 |
2.575e-03 |
-3.919e-01 |
Volt |
DPA Ground Reference 2 |
| DEAHK20 |
5.04 |
1.703e-02 |
-8.519e-03 |
-1.319e+00 |
Volt |
DPA 5V Housekeeping B |
| DEAHK25 |
30.48 |
0.10 |
-5.417e-02 |
-6.587e+00 |
Volt |
Primary Raw DEA 28V DC |
| DEAHK26 |
24.94 |
9.992e-02 |
1.363e-01 |
2.071e+00 |
Volt |
Primary Raw DEA 24V DC |
| DEAHK27 |
-16.34 |
0.38 |
-1.524e-01 |
-2.260e+01 |
Volt |
Primary Raw DEA -15.5V |
| DEAHK28 |
15.91 |
0.28 |
9.970e-02 |
1.547e+01 |
Volt |
Primary Raw DEA +15.5V |
| DEAHK29 |
-6.34 |
9.388e-02 |
-3.108e-02 |
-5.709e+00 |
Volt |
Primary Raw DEA -6V DC |
| DEAHK30 |
6.06 |
2.266e-02 |
-3.535e-03 |
-1.547e+00 |
Volt |
Primary Raw DEA +6V DC |
- OBA Heaters
| Previous Quarter |
| MSID | MEAN | RMS | DELTA/YR | DELTA/YR/YR | UNITS | DESCRIPTION |
| OOBTHR04 |
289.99 |
0.43 |
3.872e-01 |
3.392e+01 |
K |
RT 27: HRMA STRUT |
| OOBTHR05 |
290.21 |
0.43 |
2.285e-01 |
3.630e+01 |
K |
RT 28: HRMA STRUT |
| OOBTHR06 |
288.08 |
0.24 |
9.732e-02 |
2.954e+01 |
K |
RT 29: HRMA STRUT |
| OOBTHR07 |
284.81 |
0.17 |
1.962e-01 |
2.098e+01 |
K |
RT 30: HRMA STRUT |
| OOBTHR08 |
287.93 |
0.80 |
9.118e-01 |
3.753e+01 |
K |
RT 31: OBA CONE |
| OOBTHR33 |
283.57 |
0.76 |
2.210e+00 |
3.439e+01 |
K |
RT 54: OBA AFT BULKHEAD |
| OOBTHR34 |
283.63 |
0.82 |
2.484e+00 |
3.617e+01 |
K |
RT 55: OBA AFT BULKHEAD |
| OOBTHR35 |
283.86 |
1.14 |
3.217e+00 |
4.907e+01 |
K |
RT 57: OBA AFT BULKHEAD |
- HRMA Struts
| Previous Quarter |
| MSID | MEAN | RMS | DELTA/YR | DELTA/YR/YR | UNITS | DESCRIPTION |
| 4RT584T |
290.16 |
0.42 |
3.365e-01 |
3.165e+01 |
K |
RT 584 - STRUT TEMP |
| 4RT585T |
290.30 |
0.41 |
2.534e-01 |
3.356e+01 |
K |
RT 585 - STRUT TEMP |
| 4RT588T |
283.24 |
5.735e-02 |
-4.897e-02 |
-6.688e-01 |
K |
RT 588 - STRUT TEMP |
| 4RT589T |
283.66 |
1.00 |
2.499e+00 |
7.645e+01 |
K |
RT 589 - STRUT TEMP |
| 4RT590T |
290.28 |
1.39 |
1.336e+00 |
6.361e+01 |
K |
RT 590 - STRUT TEMP |
| 4RT591T |
290.31 |
1.32 |
5.498e-01 |
7.643e+01 |
K |
RT 591 - STRUT TEMP |
| 4RT592T |
282.90 |
0.54 |
8.020e-01 |
1.519e+01 |
K |
RT 592 - STRUT TEMP |
| 4RT593T |
283.26 |
4.288e-02 |
-5.541e-02 |
-1.744e+00 |
K |
RT 593 - STRUT TEMP |
| 4RT594T |
288.05 |
0.11 |
2.257e-02 |
4.203e+00 |
K |
RT 594 - TFTE TEMP |
TOP
Spacecraft Motions
Reaction Wheel Rotations
Note: From Feb 2010, the computation of reaction wheel rotations are slightly modified.
TOP
Links to Past Monthly Reports
If you have any questions about this page, please contact
swolk@head.cfa.harvard.edu.
)
)
)
)
)
)
)
)
)
)
)
)
)
)
)
)
)
)
)
)
)
)
)
)
)
)
)
)
)
)
)
)
)
)
)
)
)
)
)
)
)
)
)
)
)
)
)
)
)
)
)
)
)
)
)
)
)
)
)
)
)
)
)
)
)
)
)
)
)
)
)
)
)
)
)
)
)
)
)
)
)
)
)
)