ACIS
ACIS DOSE Registered-Photon-Map
The steps we took to compute the dose map are;
- Level 1 Event files for a specified month are obtained from archive.
- Image data including I2, I3, S2, S3 CCDs are extracted from all event files.
- All the extracted image data were merged to create a month long exposure map for the month.
- The exposure map is opened with ds9, and check a distribution of count rates against energy. From this, estimate the upper threshold value. Any events beyond this upper threshold are assumed erroneous events such as bad pixels.
- Using this upper threshold, the data is filtered, and create a cleaned exposure map for the month.
- The exposure map from each month from the Sep 1999 is added up to create a cumulative exposure map for each month.
- Using fimgstatistic, we compute count rate statistics for each CCDs.
- For observations with high data drop rates (e.g., Crab nebula, Cas A), we corrected the observations by adding events.
-
Note: Counts and RMS's of Cumulative maps are lower than the previous months.
This is because we excluded extreme outliers.
Please check more detail plots at Telemetered Photon Dose Trend page.
)
)
)
Statistics:
# IMAGE     NPIX        MEAN           RMS              MIN     MAX
ACIS_jul11 6004901       6.633         9.181            0.0     388

 I2 node 0  262654      6.426853        2.955090        0.0      61.0
 I2 node 1  262654      6.858088        3.326109        0.0     320.0
 I2 node 2  262654      6.770473        3.076818        0.0      60.0
 I2 node 3  262654      6.785373        3.265490        0.0     257.0

 I3 node 0  262654      6.759901        3.045581        0.0      34.0
 I3 node 1  262654      7.098381        6.729143        0.0     156.0
 I3 node 2  262654      6.529029        2.893333        0.0      50.0
 I3 node 3  262654      6.382671        2.885783        0.0      95.0

 S2 node 0  262654      7.987289        4.078951        0.0      76.0
 S2 node 1  262654      8.291534        4.316237        0.0      64.0
 S2 node 2  262654      9.444060        6.708209        0.0     139.0
 S2 node 3  262654      9.664710        8.416064        0.0     267.0

 S3 node 0  262654      11.229006       6.353302        0.0     197.0
 S3 node 1  262654      12.699798       7.314637        0.0     130.0
 S3 node 2  262654      13.133647       9.066437        0.0     135.0
 S3 node 3  262654      12.000591       9.630538        0.0     145.0
)
)
)
Statistics:
 IMAGE        NPIX      MEAN             RMS            MIN    MAX
ACIS_total  6004901    1525.55          2049.71         0.0    92223

 I2 node 0  262654      1254.665874     241.595292      0.0     6238.0
 I2 node 1  262654      1324.295069     323.725373      0.0     25858.0
 I2 node 2  262654      1359.332470     294.837152      0.0     8840.0
 I2 node 3  262654      1354.956128     346.080813      0.0     27645.0

 I3 node 0  262654      1421.021682     347.521539      0.0     6399.0
 I3 node 1  262654      1490.392925     1120.531443     0.0     28841.0
 I3 node 2  262654      1294.245966     234.328860      0.0     6097.0
 I3 node 3  262654      1280.563633     249.844737      0.0     22955.0

 S2 node 0  262654      1824.739342     252.967177      939.0   20106.0
 S2 node 1  262654      1940.432730     416.090378      973.0   10652.0
 S2 node 2  262654      2151.665644     404.862679      1257.0  15278.0
 S2 node 3  262654      2078.442352     296.754117      1209.0  32374.0

 S3 node 0  262654      3154.945113     1600.353287     1303.0  12929.0
 S3 node 1  262654      4363.900354     1937.769284     0.0     13436.0
 S3 node 2  262654      3299.353879     897.519537      1239.0  8284.0
 S3 node 3  262654      2534.353828     405.466208      1393.0  9314.0
)
|
)
|
)
|
)
|
| Apr 2011 | Jan 2011 | Oct 2010 | Jul 2010 |
|---|
The Mean Detrended CTI
We report CTIs with a refined data definition. CTIs were computed for the temperature dependency corrected data. Please see CTI page for detailed explanation. CTI's are computed for Mn K alpha, and defined as slope/intercept x10^4 of row # vs ADU. Data file: here
Focal Plane Temperature
Jul 2011 Focal Temperature
| The Mean (max) FPT: | |
|---|---|
| -116.72 | +/- 1.97 C |
| Mean Width: | |
| 1.24 | +/- 1.18 days |
Averaged Focal Plane Temperature
We are using 10 period moving averages to show trends of peak temperatures and peak widths. Note, the gaps in the width plot are due to missing/corrupted data.
Focal Plane Temperature, Sun Angle and Altitude
Bad Pixels
The plots below were generated with a new warm pixel finding script. Please see Acis Bad Pixel Page for details.
Front Side CCDs
Back Side CCD (CCD5)
### -->
Science Instrument Background Rates
| Name | Low (keV) | High(KeV) | Description |
|---|---|---|---|
| SSoft | 0.00 | 0.50 | Super soft photons |
| Soft | 0.50 | 1.00 | Soft photons |
| Med | 1.00 | 3.00 | Moderate energy photons |
| Hard | 3.00 | 5.00 | Hard Photons |
| Harder | 5.00 | 10.00 | Very Hard photons |
| Hardest | 10.00 | Beyond 10 keV |
ACIS Corner Pixels
We plot the average corner pixel centroid slope and mean for ACIS observations. Separate plots are shown for FAINT MODE (3X3) and VFAINT MODE (5X5) observations. Metric is the centroid of a Gaussian fit to the histogram of corner pixel PHA values of detected events. Plus signs are FAINT observations, diamonds are VFAINT observations, and boxes are VFAINT observations with centroids computed using only the corner pixels of a 3X3 event island (referred to as AFAINT). We see a very small upward trend.
CCD: I3
CCD: S3
ACIS Bias Trends
The bias plus overclock level was calculated as follows:
- Get acisf*bias0.fits is obtained from a database or /dsops/ap/sdp/cache/*/acis/
- Data with timed mode exposure is selected.
- Fits files were divided into 4 quads, then an average of bias level for each quad is computed. No corrections for dead spots, columns etc were included.
An example of Overclock values as reported in FITS file header:
An example of mean bias minus overclock value:
HRC
DOSE of Central 4K Pore-Pairs
Please refer to Maximum Dose Trends for more details.
)
        IMAGE                NPIX      MEAN    STDDEV      MIN       MAX
HRCI_07_2011.fits          16777216   0.060    0.079       0.0       10.0
-->
)
        IMAGE                NPIX      MEAN    STDDEV      MIN       MAX
HRCI_08_1999_07_2011.fits  16777216   3.543    4.380       0.0       292.0
)
        IMAGE                NPIX      MEAN    STDDEV      MIN       MAX
HRCS_07_2011.fits          16777216   0.029    0.279       0.0       39.0
)
        IMAGE                NPIX     MEAN      STDDEV      MIN      MAX
HRCS_08_1999_07_2011.fits  16777216  13.729      22.889      0.0      1627.0
|
|
Max dose trend plots corrected for events that "pile-up"
in the center of the taps due to bad position information.
|
)
|
)
|
)
|
)
|
| Apr 2011 | Jan 2011 | Oct 2010 | Jul 2010 |
|---|
)
|
)
|
)
|
)
|
| Apr 2011 | Jan 2011 | Oct 2010 | Jul 2010 |
|---|
Gratings
Focus
We plot the width of the zero order streak of ACIS/HETG observations and the width of the zero order image for HRC/LETG observations of point sources. No significant defocusing trend is seen at this time. See Gratings Focus pages.
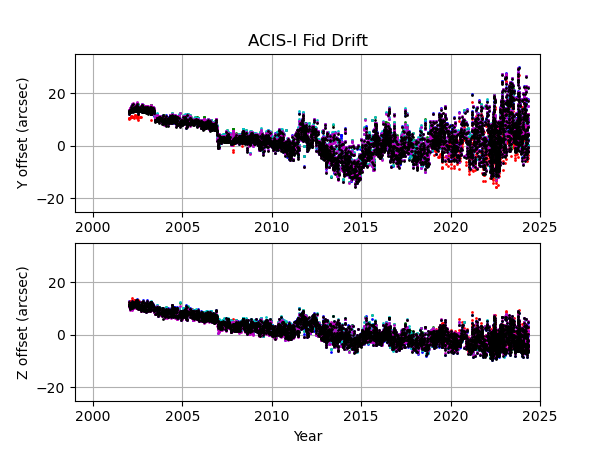
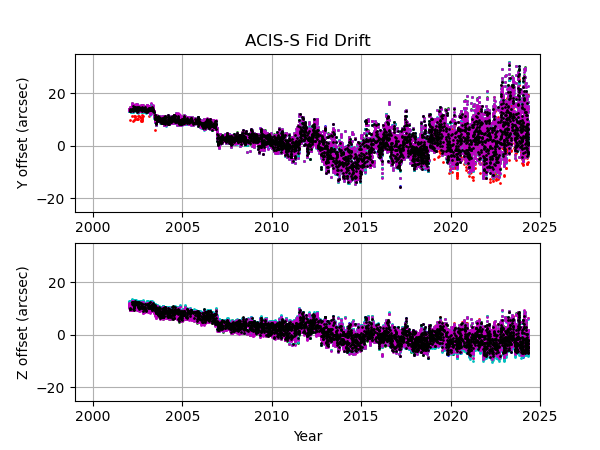
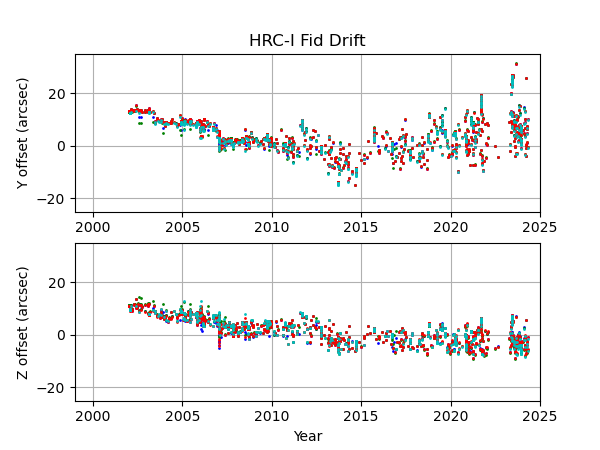
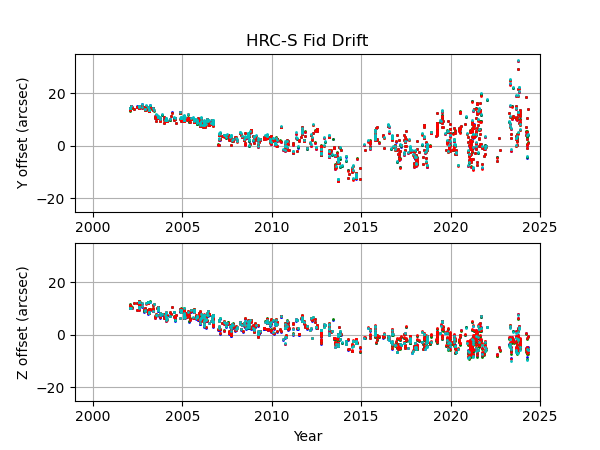
PCAD
ACA Trending
ACIS-I
ACIS-S
HRC-I
HRC-S
Gyro Bias Drift
Radiation History
Radiation Zone Timing
Plotted below are radiation zone timing plots based on the following definitions of radiation zone:
- RADZONE - Ephin levels (in any of the E1300,P4GM,P41GM channels) are more than 1/3 of RADMON safing thresholds.
- RADMON - Radmon is disabled for radiation zone (as commanded based on OFLS model, for comparison with actual radiation levels).
- PERIGEE - Time of closest earth approach (for comparison)
Radiation Count Rates of Jul 2011
Sun Spot History
Trending
Quarterly Trends
- ACA Thermal
- ACA Thermal
| Previous Quarter | ||||||
| MSID | MEAN | RMS | DELTA/YR | DELTA/YR/YR | UNITS | DESCRIPTION |
| AACBPPT | 302.09 | 1.55 | 4.834e+00 | 2.154e+01 | K | AC BASEPLATE TEMP (PRIME) |
| AACBPRT | 297.09 | 1.25 | 4.004e+00 | 1.867e+01 | K | AC BASEPLATE TEMP (RDNT) |
| AACCCDPT | 255.51 | 7.56 | -6.022e+00 | -2.050e+02 | K | AC CCD TEMP (PRI) |
| AACCCDRT | 296.92 | 1.35 | 4.389e+00 | 1.595e+01 | K | AC CCD TEMP (RDNT) |
| AACH1T | 294.09 | 1.17 | 3.990e+00 | 1.862e+01 | K | AC HOUSING TEMP (ACH1) |
| AACH2T | 294.13 | 1.17 | 4.054e+00 | 2.222e+01 | K | AC HOUSING TEMP (ACH2) |
| AAOTALT | 293.74 | 1.15 | 3.942e+00 | 2.147e+01 | K | AC OPT TEL ASSY LENS TEMP |
| AAOTAPMT | 293.07 | 1.12 | 3.846e+00 | 2.493e+01 | K | AC OPT TEL ASSY PRIMARY MIRROR TEMP |
| AAOTASMT | 293.19 | 1.12 | 3.824e+00 | 2.453e+01 | K | AC OPT TEL ASSY SECONDARY MIRROR TEMP |
| AAOTH2MT | 293.66 | 1.15 | 3.963e+00 | 1.921e+01 | K | AC OPT TEL ASSY SECONDARY MIRROR TEMP (HRMA) |
)
)
)
)
)
)
)
)
)
)
| Previous Quarter | ||||||
| MSID | MEAN | RMS | DELTA/YR | DELTA/YR/YR | UNITS | DESCRIPTION |
| 4RT575T | 290.02 | 1.43 | 3.284e+00 | -3.905e+01 | K | RT 575 - OB CONE TEMP |
| 4RT576T | 284.10 | 1.12 | 1.868e+00 | -4.042e+01 | K | RT 576 - OB CONE TEMP |
| 4RT577T | 290.10 | 2.28 | 3.129e+00 | -9.519e+01 | K | RT 577 - OB CONE TEMP |
| 4RT578T | 288.13 | 1.91 | 1.940e+00 | -8.815e+01 | K | RT 578 - OB CONE TEMP |
| 4RT579T | 285.04 | 1.37 | -7.507e-01 | -8.780e+01 | K | RT 579 - OB CONE TEMP |
| 4RT580T | 284.75 | 1.34 | -6.974e-01 | -9.597e+01 | K | RT 580 - OB CONE TEMP |
| 4RT581T | 286.42 | 2.30 | -1.981e+00 | -1.377e+02 | K | RT 581 - OB CONE TEMP |
)
)
)
)
)
)
)
Spacecraft Motions
|
|
Reaction Wheel Rotations
Note: From Feb 2010, the computation of reaction wheel rotations are slightly modified.
Links to Past Monthly Reports
| Year | Month | |||||||||||
|---|---|---|---|---|---|---|---|---|---|---|---|---|
| 1999 | Jul | Aug | Sep | Oct | Nov | Dec | ||||||
| 2000 | Jan | Feb | Mar | Apr | May | Jun | Jul | Aug | Sep | Oct | Nov | Dec |
| 2001 | Jan | Feb | Mar | Apr | May | Jun | Jul | Aug | Sep | Oct | Nov | Dec |
| 2002 | Jan | Feb | Mar | Apr | May | Jun | Jul | Aug | Sep | Oct | Nov | Dec |
| 2003 | Jan | Feb | Mar | Apr | May | Jun | Jul | Aug | Sep | Oct | Nov | Dec |
| 2004 | Jan | Feb | Mar | Apr | May | Jun | Jul | Aug | Sep | Oct | Nov | Dec |
| 2005 | Jan | Feb | Mar | Apr | May | Jun | Jul | Aug | Sep | Oct | Nov | Dec |
| 2006 | Jan | Feb | Mar | Apr | May | Jun | Jul | Aug | Sep | Oct | Nov | Dec |
| 2007 | Jan | Feb | Mar | Apr | May | Jun | Jul | Aug | Sep | Oct | Nov | Dec |
| 2008 | Jan | Feb | Mar | Apr | May | Jun | Jul | Aug | Sep | Oct | Nov | Dec |
| 2009 | Jan | Feb | Mar | Apr | May | Jun | Jul | Aug | Sep | Oct | Nov | Dec |
| 2010 | Jan | Feb | Mar | Apr | May | Jun | Jul | Aug | Sep | Oct | Nov | Dec |
| 2011 | Jan | Feb | Mar | Apr | May | Jun | ||||||