ACIS
ACIS DOSE Registered-Photon-Map
The steps we took to compute the dose map are;
- Level 1 Event files for a specified month are obtained from archive.
- Image data including I2, I3, S2, S3 CCDs are extracted from all event files.
- All the extracted image data were merged to create a month long exposure map for the month.
- The exposure map is opened with ds9, and check a distribution of count rates against energy. From this, estimate the upper threshold value. Any events beyond this upper threshold are assumed erroneous events such as bad pixels.
- Using this upper threshold, the data is filtered, and create a cleaned exposure map for the month.
- The exposure map from each month from the Sep 1999 is added up to create a cumulative exposure map for each month.
- Using fimgstatistic, we compute count rate statistics for each CCDs.
- For observations with high data drop rates (e.g., Crab nebula, Cas A), we corrected the observations by adding events.
-
Note: Counts and RMS's of Cumulative maps are lower than the previous months.
This is because we excluded extreme outliers.
Please check more detail plots at Telemetered Photon Dose Trend page.
)
)
)
Statistics:
# IMAGE     NPIX        MEAN           RMS              MIN     MAX
ACIS_jan13 6004901       7.358         12.667           0.0     6305


I2 node 0  262654   8.955242    3.694078    0.0  78.0
I2 node 1  262654   9.288125    4.189653    0.0 323.0
I2 node 2  262654   9.108322    3.673375    0.0  68.0
I2 node 3  262654   9.029960    6.006335    0.0 1597.0

I3 node 0  262654   9.395488    4.156511    0.0  48.0
I3 node 1  262654   9.642902    20.865034   0.0 6305.0
I3 node 2  262654   8.694185    3.554811    0.0  88.0
I3 node 3  262654   8.838242    3.643937    0.0 119.0

S2 node 0  262654   7.090234    12.419176   0.0 3500.0
S2 node 1  262654   7.065628    3.448234    0.0  50.0
S2 node 2  262654   7.268210    11.558255   0.0 5087.0
S2 node 3  262654   7.103668    4.257954    0.0 1353.0

S3 node 0  262654   16.240139   18.028760   0.0 194.0
S3 node 1  262654   14.239056   10.872723   0.0 131.0
S3 node 2  262654   12.463243   5.096620    0.0  56.0
S3 node 3  262654   11.087138   4.586701    0.0  53.0
)
)
)
Statistics:
 IMAGE        NPIX      MEAN             RMS            MIN    MAX
ACIS_total   6004901   1684.613         2226.451        0.0    99438


I2 node 0  262654   1405.552818 276.793290  0.0      8825.0
I2 node 1  262654   1478.261889 370.291080  0.0     32497.0
I2 node 2  262654   1508.287647 324.849694  0.0      6514.0
I2 node 3  262654   1503.652669 381.655498  0.0      9291.0

I3 node 0  262654   1579.791136 387.866507  0.0      6231.0
I3 node 1  262654   1658.781265 1257.621818 0.0     32165.0
I3 node 2  262654   1445.044364 267.147308  0.0      7036.0
I3 node 3  262654   1430.410408 284.208916  0.0     25124.0

S2 node 0  262654   2034.647545 310.723923  1065.0  28570.0
S2 node 1  262654   2171.345541 476.735733  1097.0  11981.0
S2 node 2  262654   2405.368187 473.508720  1443.0  41992.0
S2 node 3  262654   2338.326838 360.797087  1383.0  38256.0

S3 node 0  262654   3518.743448 1680.135782 1462.0  12675.0
S3 node 1  262654   4612.797347 1889.354950 0.0     12948.0
S3 node 2  262654   3562.330496 904.328508  1414.0   8962.0
S3 node 3  262654   2789.347872 445.446868  1585.0   9156.0
)
|
)
|
)
|
)
|
| Oct 2012 | Jul 2012 | Apr 2012 | Jan 2012 |
|---|
The Mean Detrended CTI
We report CTIs with a refined data definition. CTIs were computed for the temperature dependency corrected data. Please see CTI page for detailed explanation. CTI's are computed for Mn K alpha, and defined as slope/intercept x10^4 of row # vs ADU. Data file: here
Focal Plane Temperature
Jan 2013 Focal Temperature
| The Mean (max) FPT: | |
|---|---|
| -111.31 | +/- 3.42 C |
| Mean Width: | |
| 1.12 | +/- 0.58 days |
Averaged Focal Plane Temperature
We are using 10 period moving averages to show trends of peak temperatures and peak widths. Note, the gaps in the width plot are due to missing/corrupted data.
Focal Plane Temperature, Sun Angle and Altitude
Bad Pixels
The plots below were generated with a new warm pixel finding script. Please see Acis Bad Pixel Page for details.
Front Side CCDs
Back Side CCD (CCD5)
Science Instrument Background Rates
| Name | Low (keV) | High(KeV) | Description |
|---|---|---|---|
| SSoft | 0.00 | 0.50 | Super soft photons |
| Soft | 0.50 | 1.00 | Soft photons |
| Med | 1.00 | 3.00 | Moderate energy photons |
| Hard | 3.00 | 5.00 | Hard Photons |
| Harder | 5.00 | 10.00 | Very Hard photons |
| Hardest | 10.00 | Beyond 10 keV |
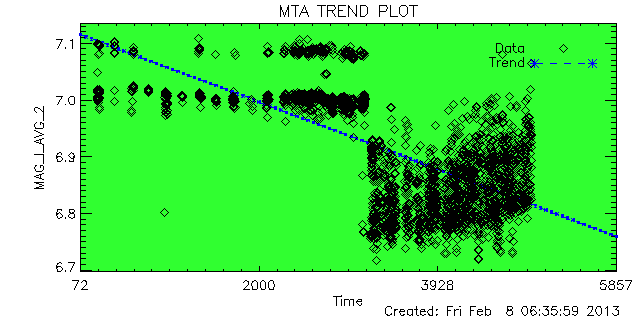
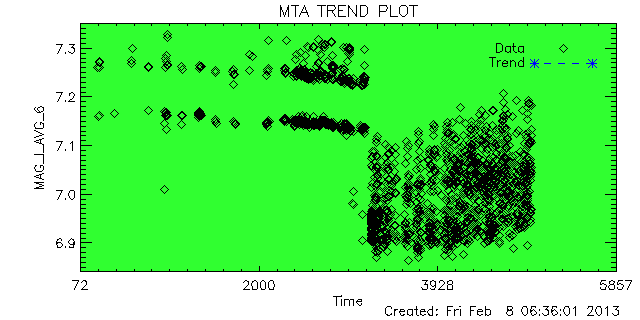
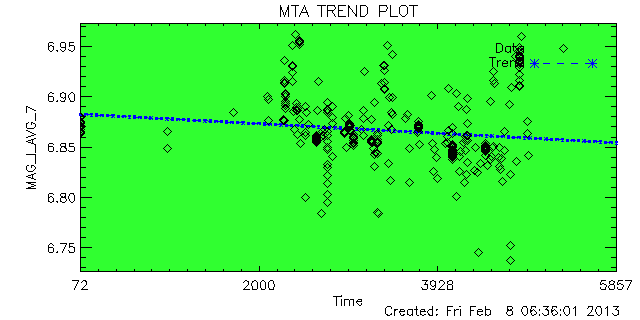
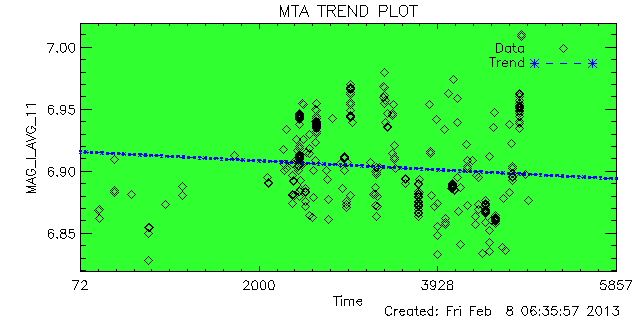
ACIS Corner Pixels
We plot the average corner pixel centroid slope and mean for ACIS observations. Separate plots are shown for FAINT MODE (3X3) and VFAINT MODE (5X5) observations. Metric is the centroid of a Gaussian fit to the histogram of corner pixel PHA values of detected events. Plus signs are FAINT observations, diamonds are VFAINT observations, and boxes are VFAINT observations with centroids computed using only the corner pixels of a 3X3 event island (referred to as AFAINT). We see a very small upward trend.
CCD: I3
CCD: S3
ACIS Bias Trends
The bias plus overclock level was calculated as follows:
- Get acisf*bias0.fits is obtained from a database or /dsops/ap/sdp/cache/*/acis/
- Data with timed mode exposure is selected.
- Fits files were divided into 4 quads, then an average of bias level for each quad is computed. No corrections for dead spots, columns etc were included.
An example of Overclock values as reported in FITS file header:
An example of mean bias minus overclock value:
HRC
DOSE of Central 4K Pore-Pairs
Please refer to Maximum Dose Trends for more details.
No Data
)
        IMAGE                NPIX      MEAN    STDDEV      MIN       MAX
HRCI_08_1999_01_2013.fits  16777216   3.921    4.759       0.0       292.0
No Data
)
        IMAGE                NPIX     MEAN      STDDEV      MIN      MAX
HRCS_08_1999_01_2013.fits  16777216  14.229      23.922      0.0      1634.0
|
|
Max dose trend plots corrected for events that "pile-up"
in the center of the taps due to bad position information.
|
)
|
)
|
)
|
)
|
| Oct 2012 | Jul 2012 | Apr 2012 | Jan 2012 |
|---|
)
|
)
|
)
|
)
|
| Oct 2012 | Jul 2012 | Apr 2012 | Jan 2012 |
|---|
Gratings
Focus
We plot the width of the zero order streak of ACIS/HETG observations and the width of the zero order image for HRC/LETG observations of point sources. No significant defocusing trend is seen at this time. See Gratings Focus pages.
PCAD
ACA Trending
ACIS-1
ACIS-6
HRC-I-1
HRC-S-1
Gyro Bias Drift
Radiation History
Radiation Zone Timing
Plotted below are radiation zone timing plots based on the following definitions of radiation zone:
- RADZONE - Ephin levels (in any of the E1300,P4GM,P41GM channels) are more than 1/3 of RADMON safing thresholds.
- RADMON - Radmon is disabled for radiation zone (as commanded based on OFLS model, for comparison with actual radiation levels).
- PERIGEE - Time of closest earth approach (for comparison)
Radiation Count Rates of Jan 2013
Sun Spot History
Trending
Quarterly Trends
- Spacecraft Electronics
| Previous Quarter | ||||||
| MSID | MEAN | RMS | DELTA/YR | DELTA/YR/YR | UNITS | DESCRIPTION |
| OHRMAPWR | 58.19 | 2.66 | -7.137e+00 | 3.678e+01 | W | HRMA COMPUTED TOTAL POWER |
| OOBAPWR | 50.16 | 2.97 | 8.660e-01 | -1.842e+02 | W | OBA COMPUTED TOTAL POWER |
)
)
- OBA Heaters
| Previous Quarter | ||||||
| MSID | MEAN | RMS | DELTA/YR | DELTA/YR/YR | UNITS | DESCRIPTION |
| OOBTHR08 | 291.86 | 1.58 | 6.398e+00 | -8.243e+01 | K | RT 31: OBA CONE |
| OOBTHR18 | 290.98 | 1.51 | 6.006e+00 | -7.738e+01 | K | RT 40: OBA CONE |
| OOBTHR25 | 291.65 | 2.29 | 6.836e+00 | -6.067e+01 | K | RT 47: OBA CONE |
| OOBTHR45 | 295.45 | 1.55 | 7.073e+00 | -1.231e+02 | K | RT 67: TFTE COVER |
| OOBTHR61 | 289.74 | 2.25 | 6.851e+00 | -5.763e+01 | K | RT 154: OBA CONE |
)
)
)
)
)
- OB Fwd Bulkhead Temperature
| Previous Quarter | ||||||
| MSID | MEAN | RMS | DELTA/YR | DELTA/YR/YR | UNITS | DESCRIPTION |
| OOBTHR04 | 292.64 | 0.90 | 4.070e+00 | -5.726e+01 | K | RT 27: HRMA STRUT |
| OOBTHR05 | 292.82 | 0.90 | 3.917e+00 | -5.566e+01 | K | RT 28: HRMA STRUT |
| OOBTHR07 | 286.16 | 0.52 | 2.302e+00 | -2.586e+01 | K | RT 30: HRMA STRUT |
)
)
)
Envelope Trending
HRMA Thermal
MUPS
Spacecraft Motions
|
|
Reaction Wheel Rotations
Note: From Feb 2010, the computation of reaction wheel rotations are slightly modified.
Links to Past Monthly Reports
| Year | Month | |||||||||||
|---|---|---|---|---|---|---|---|---|---|---|---|---|
| 1999 | Jul | Aug | Sep | Oct | Nov | Dec | ||||||
| 2000 | Jan | Feb | Mar | Apr | May | Jun | Jul | Aug | Sep | Oct | Nov | Dec |
| 2001 | Jan | Feb | Mar | Apr | May | Jun | Jul | Aug | Sep | Oct | Nov | Dec |
| 2002 | Jan | Feb | Mar | Apr | May | Jun | Jul | Aug | Sep | Oct | Nov | Dec |
| 2003 | Jan | Feb | Mar | Apr | May | Jun | Jul | Aug | Sep | Oct | Nov | Dec |
| 2004 | Jan | Feb | Mar | Apr | May | Jun | Jul | Aug | Sep | Oct | Nov | Dec |
| 2005 | Jan | Feb | Mar | Apr | May | Jun | Jul | Aug | Sep | Oct | Nov | Dec |
| 2006 | Jan | Feb | Mar | Apr | May | Jun | Jul | Aug | Sep | Oct | Nov | Dec |
| 2007 | Jan | Feb | Mar | Apr | May | Jun | Jul | Aug | Sep | Oct | Nov | Dec |
| 2008 | Jan | Feb | Mar | Apr | May | Jun | Jul | Aug | Sep | Oct | Nov | Dec |
| 2009 | Jan | Feb | Mar | Apr | May | Jun | Jul | Aug | Sep | Oct | Nov | Dec |
| 2010 | Jan | Feb | Mar | Apr | May | Jun | Jul | Aug | Sep | Oct | Nov | Dec |
| 2011 | Jan | Feb | Mar | Apr | May | Jun | Jul | Aug | Sep | Oct | Nov | Dec |
| 2012 | Jan | Feb | Mar | Apr | May | Jun | Jul | Aug | Sep | Oct | Nov | Dec |