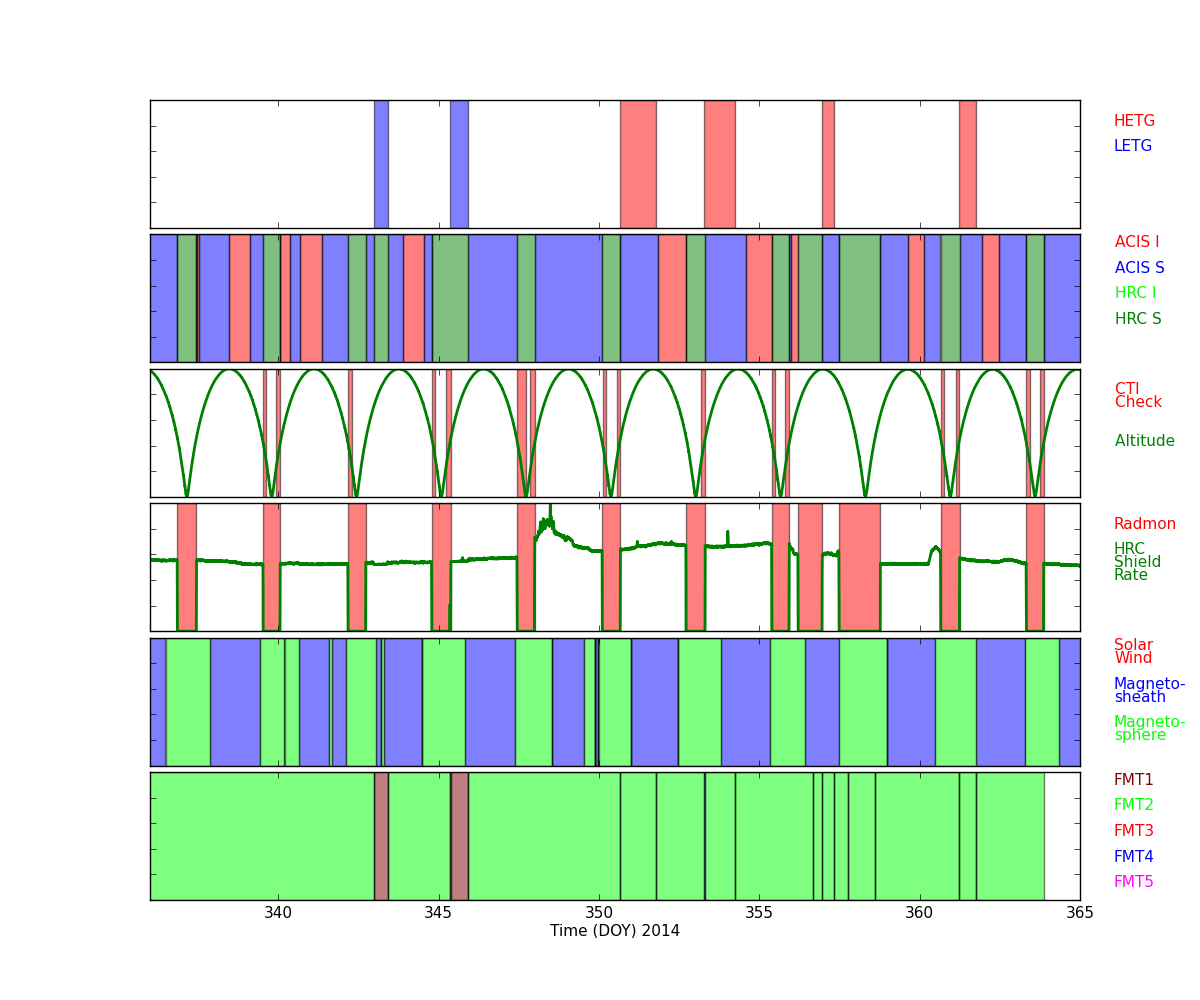
Science Run Interruptions
The observations were interrupted due to high radiation on Dec 21, 11:52pm (EST) and again on Dec 23, 6:33am (EST). The total science loss combined was 126.7 ks. Radiation Count Rate Plots for Periods Which Interrupted Science Runs).
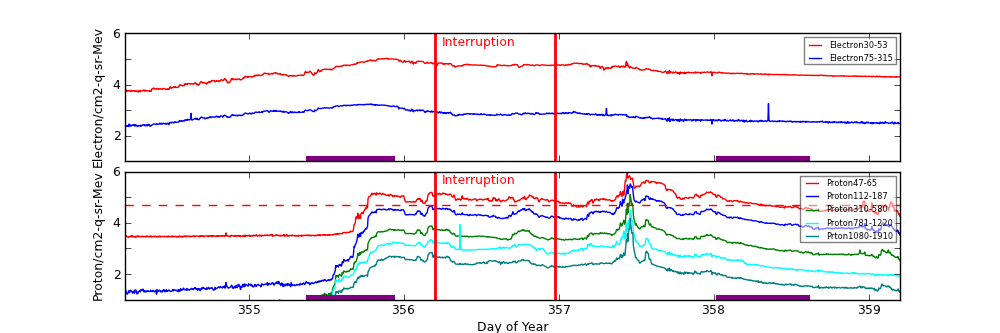
(only Dec 22 interruption is shown.)
ACIS
ACIS DOSE Registered-Photon-Map
The steps we took to compute the dose map are;
- Level 1 Event files for a specified month are obtained from archive.
- Image data including I2, I3, S2, S3 CCDs are extracted from all event files.
- All the extracted image data were merged to create a month long exposure map for the month.
- The exposure map is opened with ds9, and check a distribution of count rates against energy. From this, estimate the upper threshold value. Any events beyond this upper threshold are assumed erroneous events such as bad pixels.
- Using this upper threshold, the data is filtered, and create a cleaned exposure map for the month.
- The exposure map from each month from the Sep 1999 is added up to create a cumulative exposure map for each month.
- Using fimgstatistic, we compute count rate statistics for each CCDs.
- For observations with high data drop rates (e.g., Crab nebula, Cas A), we corrected the observations by adding events.
Please check more detail plots at Telemetered Photon Dose Trend page.
)
)
)
Statistics:
# IMAGE     NPIX     MEAN        RMS        MIN     MAX
ACIS_dec14 6004901   6.526       8.959      0.0     2029


I2 node 0  262654   6.650918    3.084143    0.0     34.0
I2 node 1  262654   6.980629    3.374348    0.0    149.0
I2 node 2  262654   6.764765    3.063488    0.0     48.0
I2 node 3  262654   6.855912    6.515018    0.0   2029.0

I3 node 0  262654   7.341841    3.399907    0.0    273.0
I3 node 1  262654   7.529652    6.674622    0.0    146.0
I3 node 2  262654   6.808495    3.019465    0.0     64.0
I3 node 3  262654   7.017077    3.135246    0.0     93.0

S2 node 0  262654   8.160202    3.390117    0.0     80.0
S2 node 1  262654   8.279311    3.820287    0.0     72.0
S2 node 2  262654   8.483360    6.627588    0.0   1500.0
S2 node 3  262654   8.197266    3.512990    0.0    427.0

S3 node 0  262654   11.236837   5.351217    0.0    114.0
S3 node 1  262654   12.740682   4.840870    0.0     94.0
S3 node 2  262654   12.178198   3.998202    0.0     53.0
S3 node 3  262654   11.047378   3.704210    0.0     36.0
)
)
)
Statistics:
 IMAGE     NPIX      MEAN        RMS        MIN      MAX
ACIS_total 6004901   1849.039    2427.208   0.0     107167


I2 node 0  262654   1551.484757 296.951575   286.0   9068.0
I2 node 1  262654   1635.848170 410.016048   321.0  37313.0
I2 node 2  262654   1665.832005 348.372549   324.0   9187.0
I2 node 3  262654   1663.753308 419.086904   307.0  28002.0

I3 node 0  262654   1747.716161 416.017356   306.0   6869.0
I3 node 1  262654   1834.777875 1389.873352  312.0  35185.0
I3 node 2  262654   1603.410341 287.565322   297.0   8177.0
I3 node 3  262654   1589.067771 308.024704   282.0  27061.0

S2 node 0  262654   2164.945328 315.261695  1141.0  21197.0
S2 node 1  262654   2303.947876 504.204546  1199.0  12751.0
S2 node 2  262654   2538.746745 482.058943  1520.0  19181.0
S2 node 3  262654   2461.013538 341.969991  1421.0  41836.0

S3 node 0  262654   3847.679075 1793.316121 1569.0  13535.0
S3 node 1  262654   5021.525070 2077.902323    0.0  14020.0
S3 node 2  262654   3829.176559 985.755099  1566.0   9332.0
S3 node 3  262654   2968.428712 451.048253  1694.0  10321.0
)
|
)
|
)
|
)
|
| Sep 2014 | Jun 2014 | Mar 2014 | Dec 0213 |
|---|
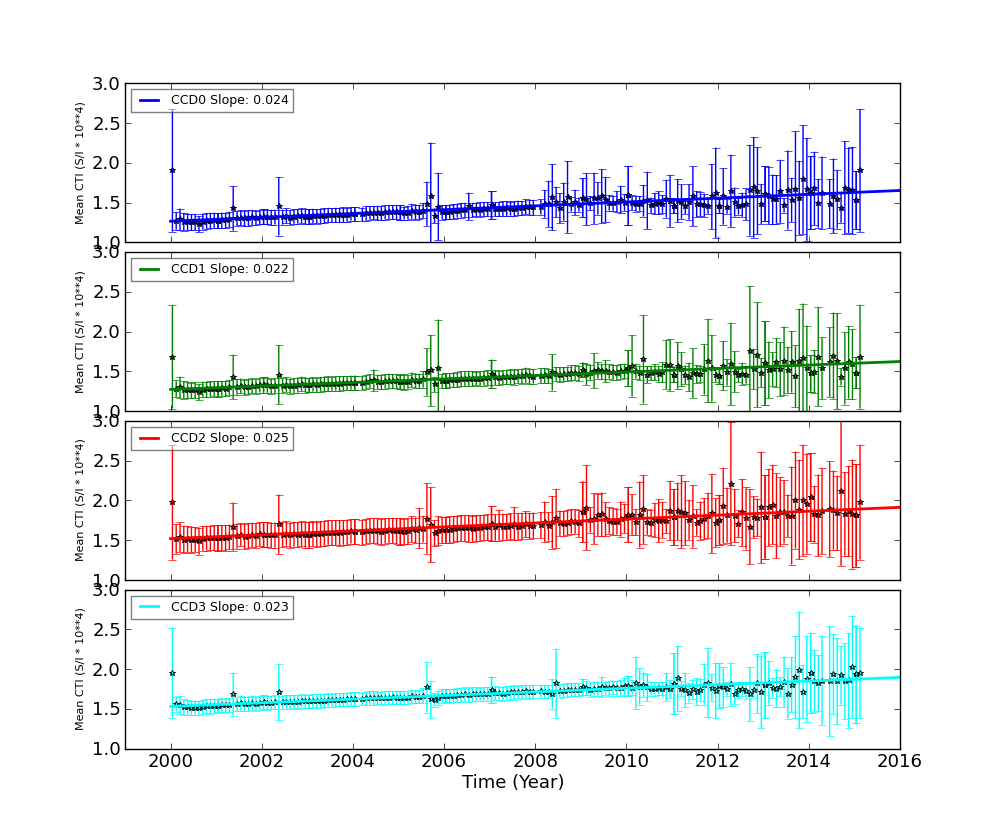
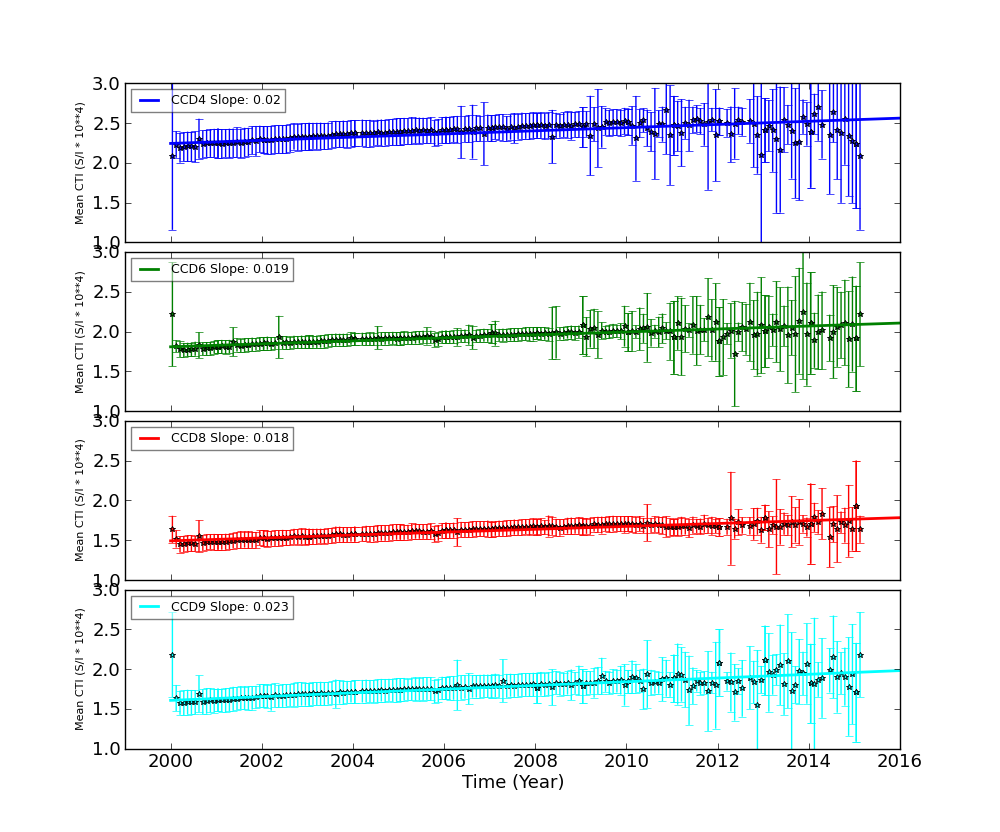
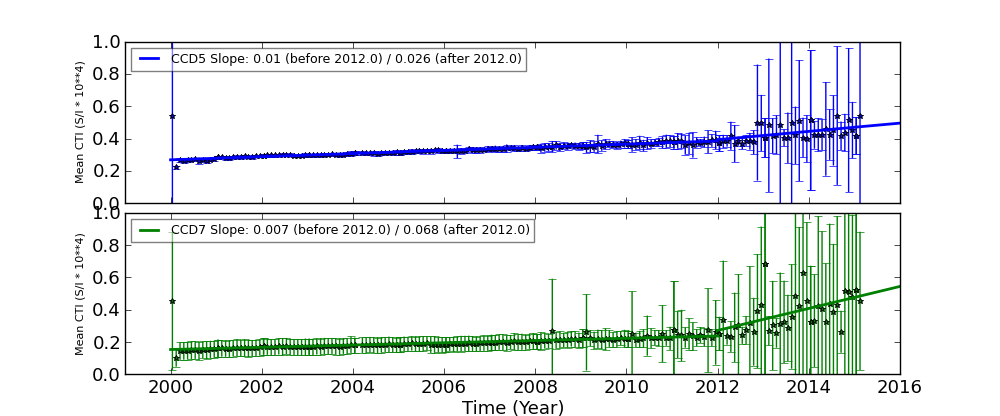
The Mean Detrended CTI
We report CTIs with a refined data definition. CTIs were computed for the temperature dependency corrected data. Please see CTI page for detailed explanation. CTI's are computed for Mn K alpha, and defined as slope/intercept x10^4 of row # vs ADU. Data file: here
Imaging CCDs
Spectral CCDs
Backside CCDs
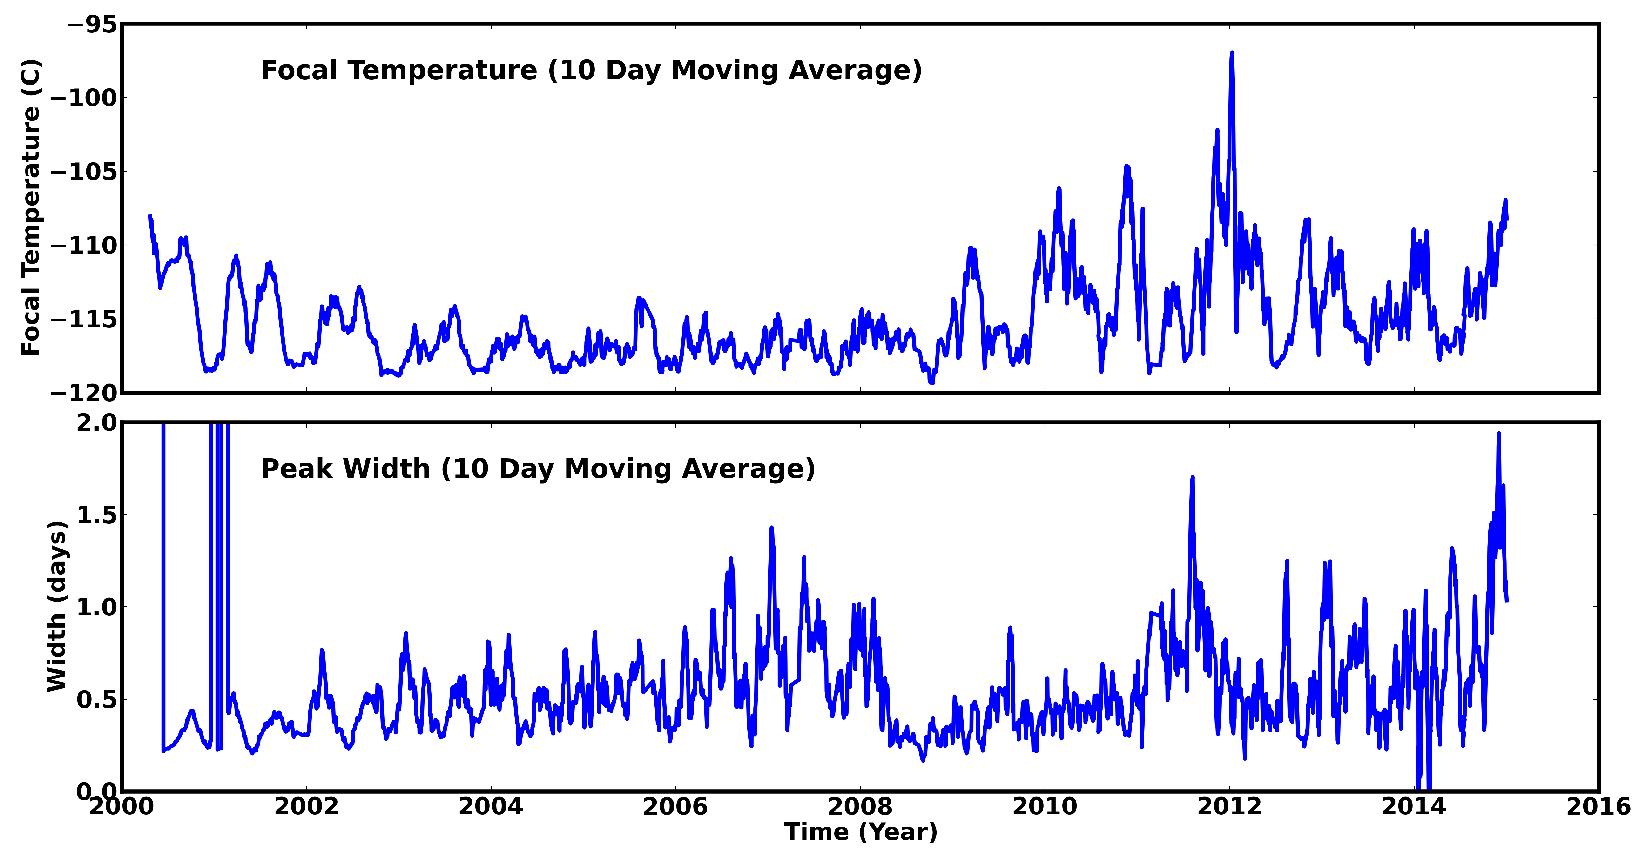
Focal Plane Temperature
Dec 2014 Focal Temperature
| The Mean (max) FPT: | |
|---|---|
| -109.24 | +/- 7.39 C |
| Mean Width: | |
| 0.98 | +/- 1.09 days |
Averaged Focal Plane Temperature
We are using 10 period moving averages to show trends of peak temperatures and peak widths. Note, the gaps in the width plot are due to missing/corrupted data.
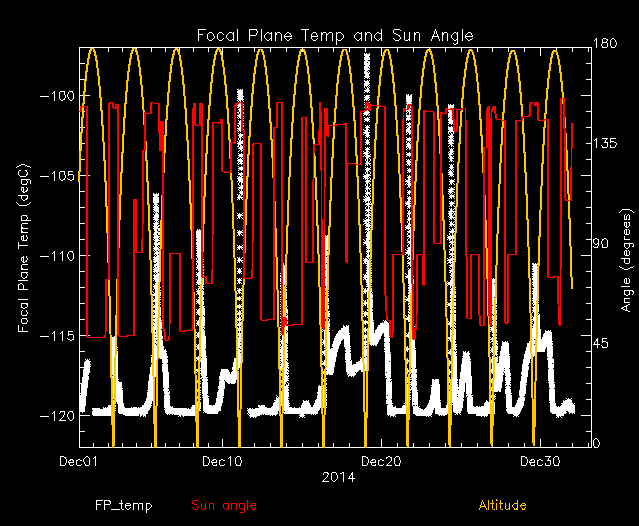
Focal Plane Temperature, Sun Angle and Altitude
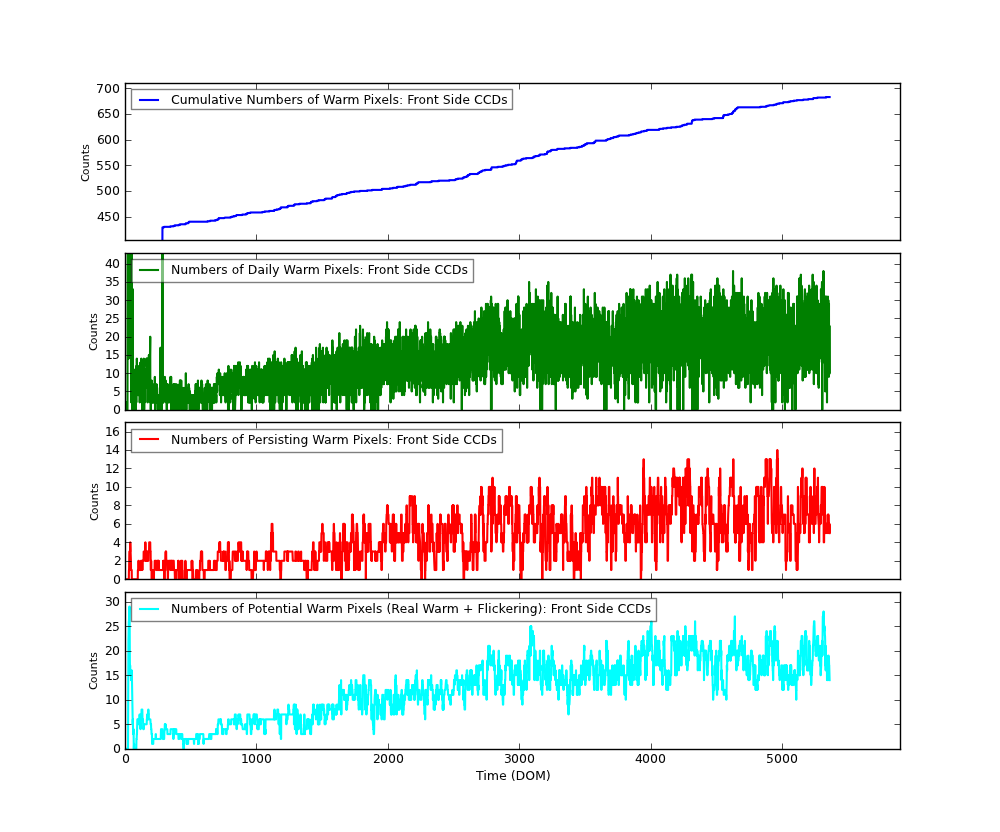
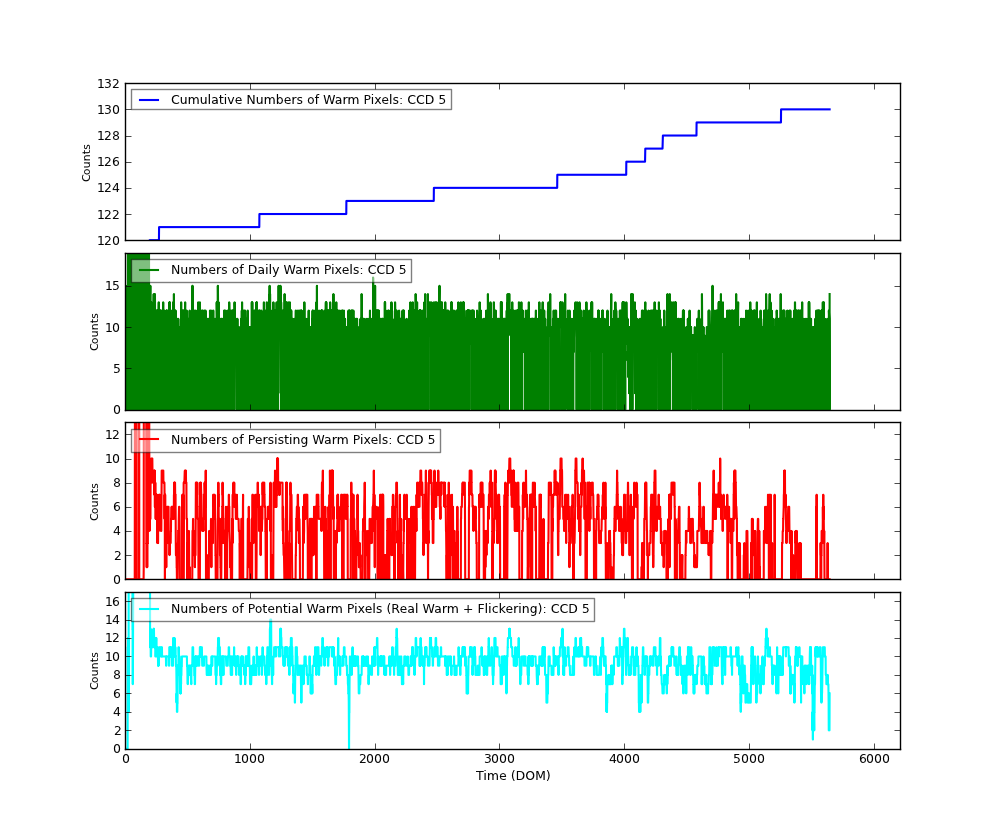
Bad Pixels
The plots below were generated with a new warm pixel finding script. Please see Acis Bad Pixel Page for details.
Front Side CCDs
Back Side CCD (CCD5)
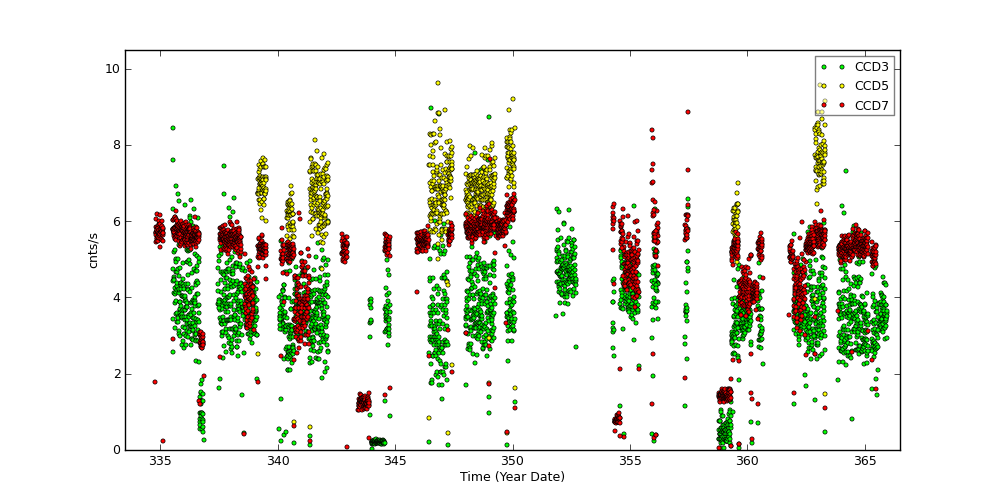
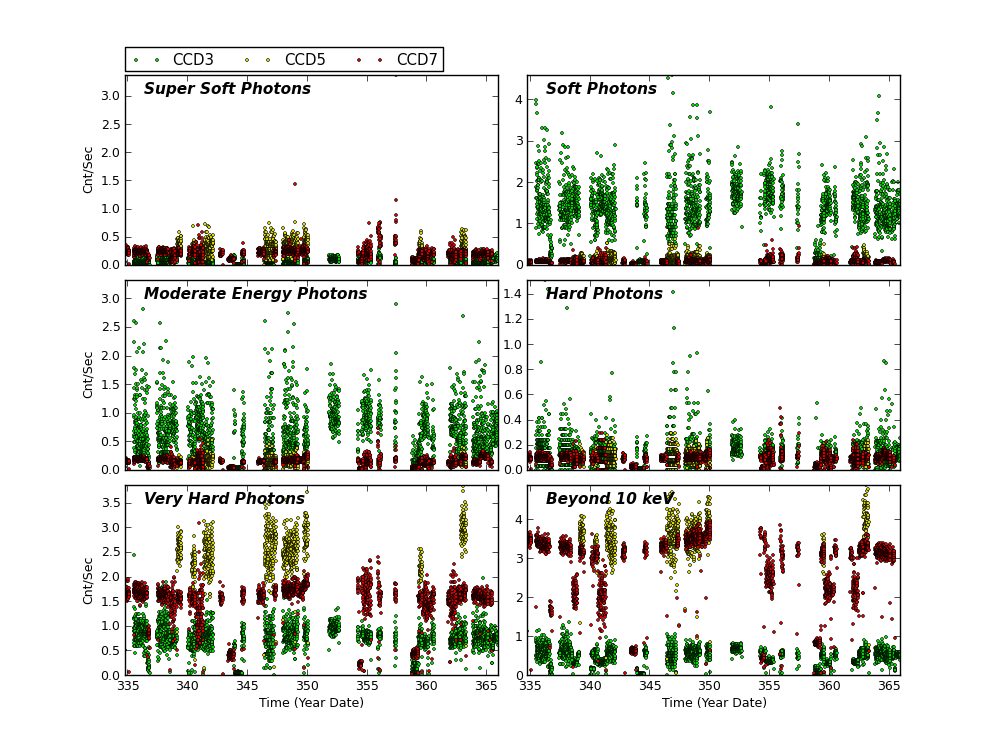
Science Instrument Background Rates
| Name | Low (keV) | High(KeV) | Description |
|---|---|---|---|
| SSoft | 0.00 | 0.50 | Super soft photons |
| Soft | 0.50 | 1.00 | Soft photons |
| Med | 1.00 | 3.00 | Moderate energy photons |
| Hard | 3.00 | 5.00 | Hard Photons |
| Harder | 5.00 | 10.00 | Very Hard photons |
| Hardest | 10.00 | Beyond 10 keV |
HRC
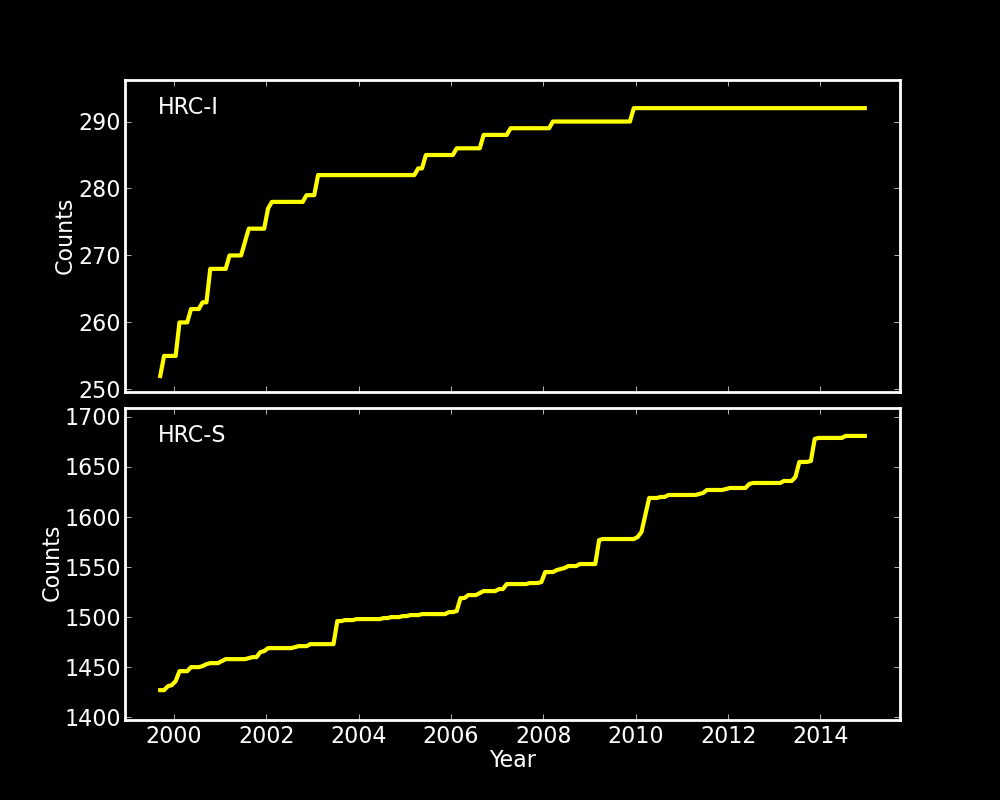
DOSE of Central 4K Pore-Pairs
Please refer to Maximum Dose Trends for more details.
)
|
|---|
         IMAGE                NPIX      MEAN    STDDEV      MIN       MAX
 HRCI_12_2014.fits          16777216   0.005    0.0771      0.0       7.0
)
        IMAGE                NPIX      MEAN    STDDEV      MIN       MAX
HRCI_08_1999_12_2014.fits  16777216   4.304    4.895       0.0       292.0
)
          IMAGE                NPIX      MEAN    STDDEV      MIN       MAX
HRCS_12_2014.fits          16777216     0.030    0.1851     0.0        9.0
)
        IMAGE                NPIX     MEAN      STDDEV      MIN      MAX
HRCS_08_1999_12_2014.fits  16777216  15.588     27.267      0.0      1681.0
|
|
Max dose trend plots corrected for events that "pile-up"
in the center of the taps due to bad position information.
|
)
|
)
|
)
|
)
|
| Sep 2014 | Jun 2014 | Mar 2014 | Dec 2013 |
|---|
)
|
)
|
)
|
)
|
| Sep 2014 | Jun 2014 | Mar 2014 | Dec 2013 |
|---|
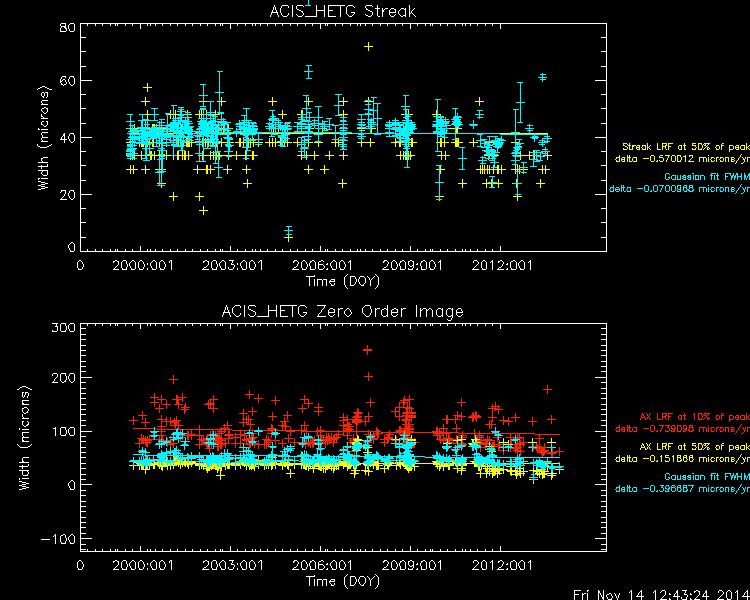
Gratings
Focus
We plot the width of the zero order streak of ACIS/HETG observations and the width of the zero order image for HRC/LETG observations of point sources. No significant defocusing trend is seen at this time. See Gratings Focus pages.
PCAD
ACA Trending
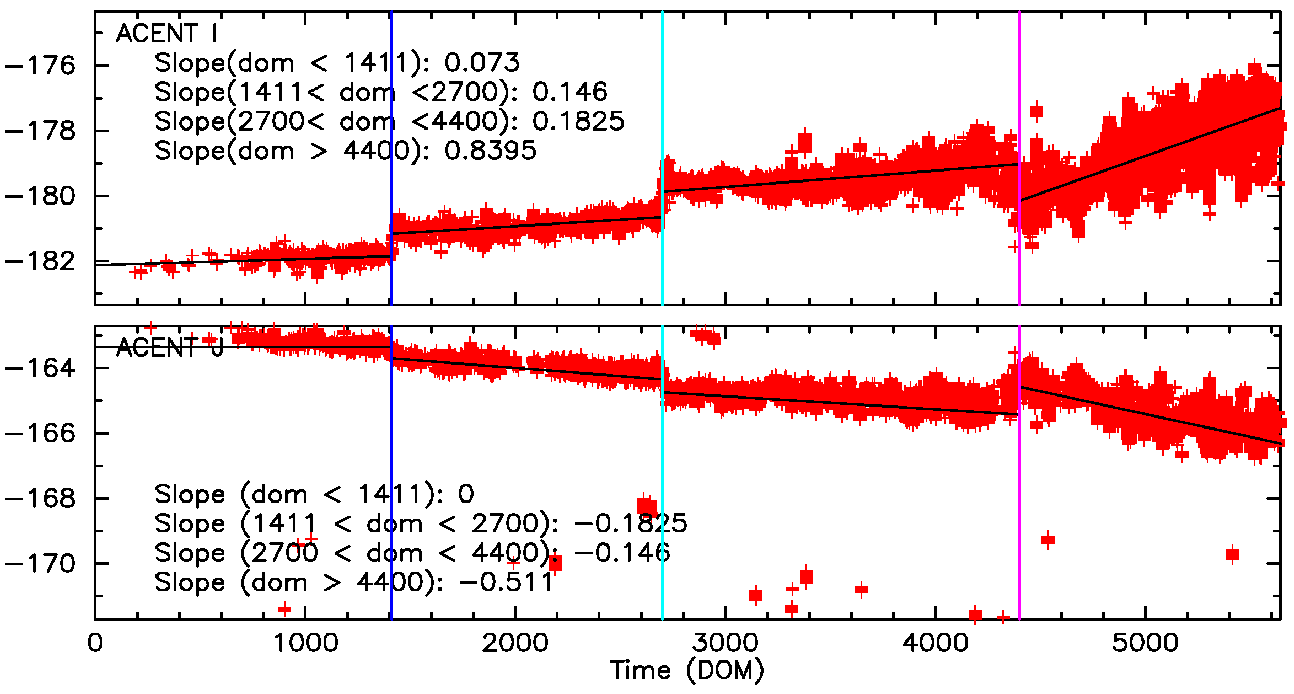
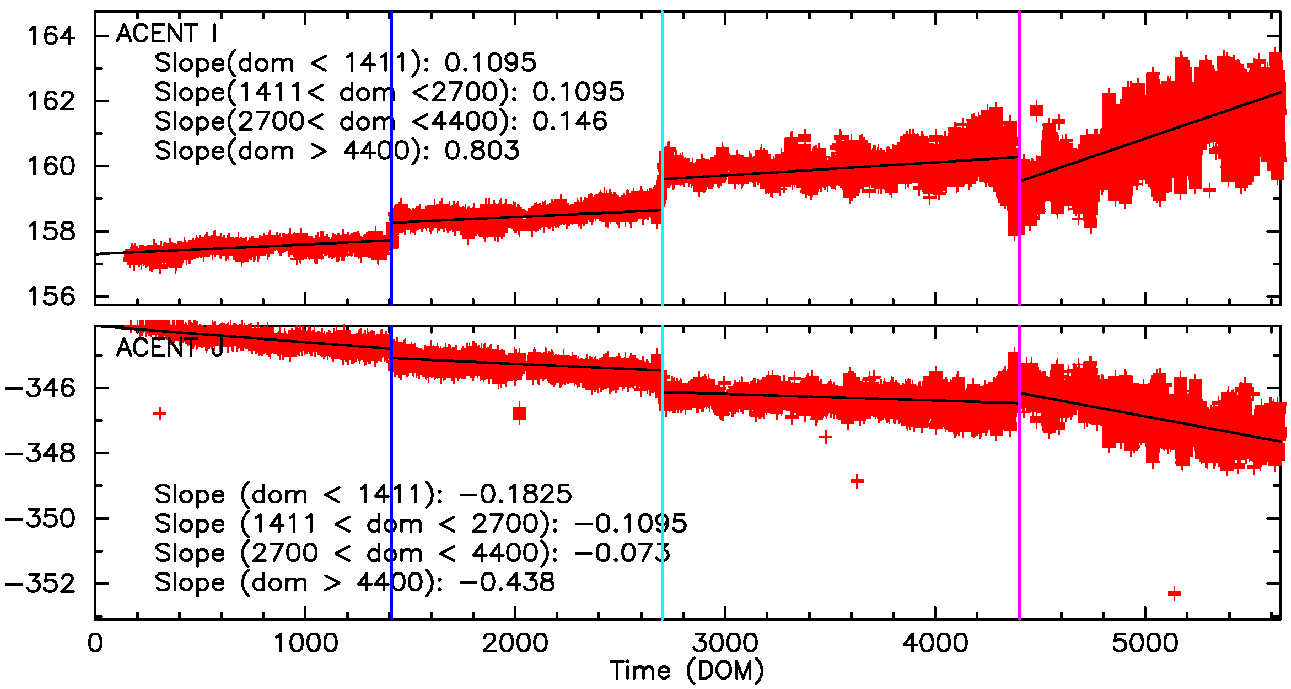
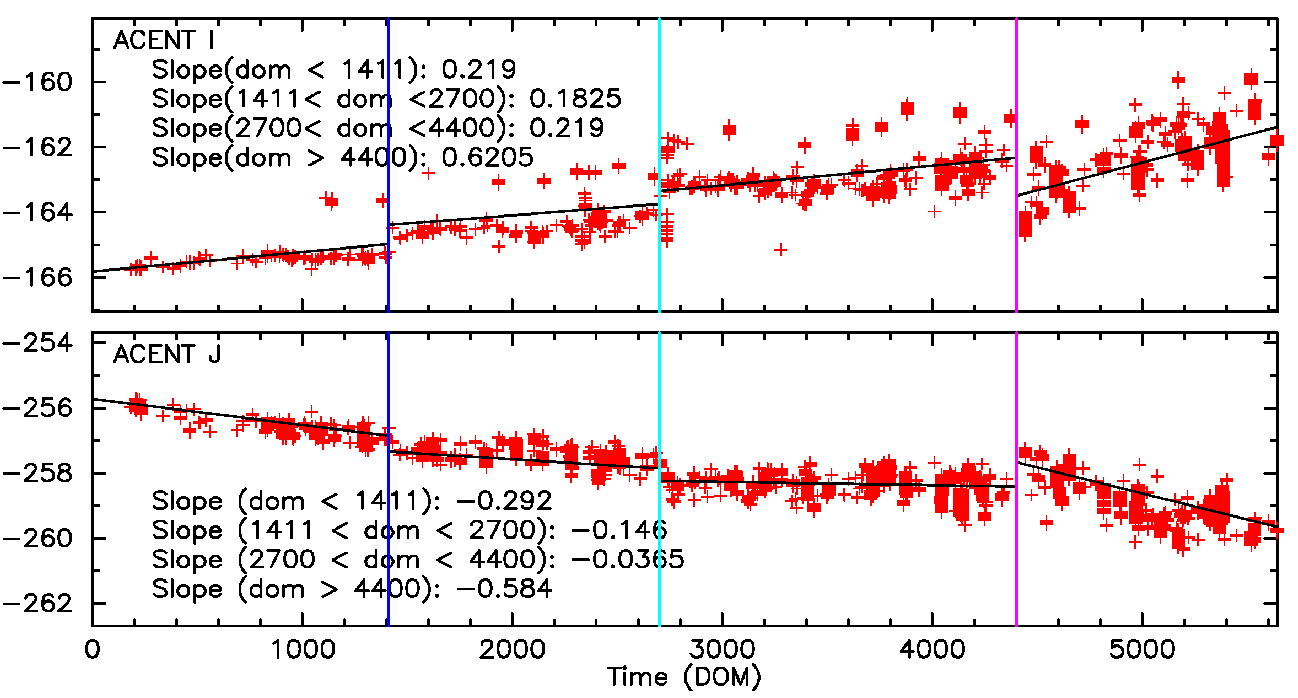
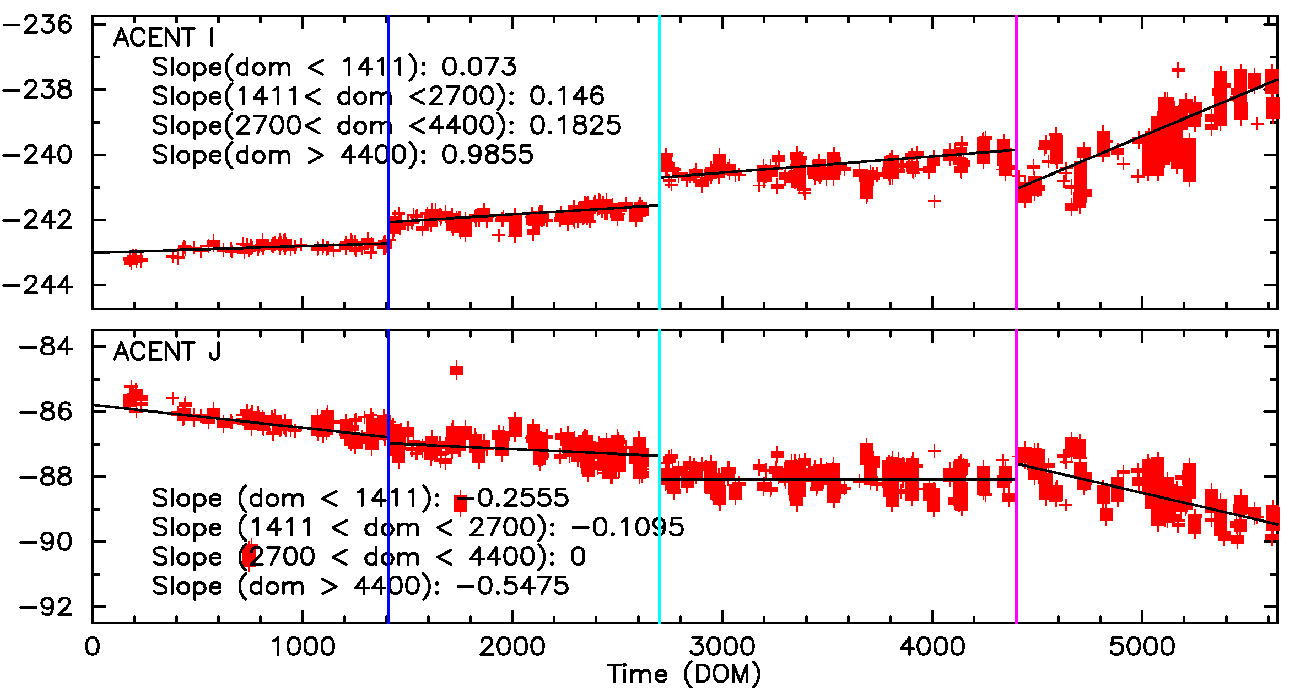
Fid Light Drift
Fid light positions on ACA drift with time. The drift trends of Fid light 2 with ACIS-I and ACIS-S configurations are shown below.
The top panel shows Fid light 2 drift in ACENT I (app. along with -Y axis), and the
bottom panel shows that in ACENT J (app. along with Z axis). The unit is a pixel, and
one pixel is approximately 0.5 arcsec. The slope listed at the top right corner is
the change in a position per year (arcsec/yr). The vertical line on DOM = 1411 (Jun 1, 2003)
indicates a transition date of use of IRU-1 to IRU-2.
See also Tom Aldcroft's updated page:
https://cxc.cfa.harvard.edu/mta/ASPECT/fid_drift
Fid 2 (ACIS-I)
Fid 2 (ACIS-S)
Fid 8 (HRC-I)
Fid 12 (HRC-S)
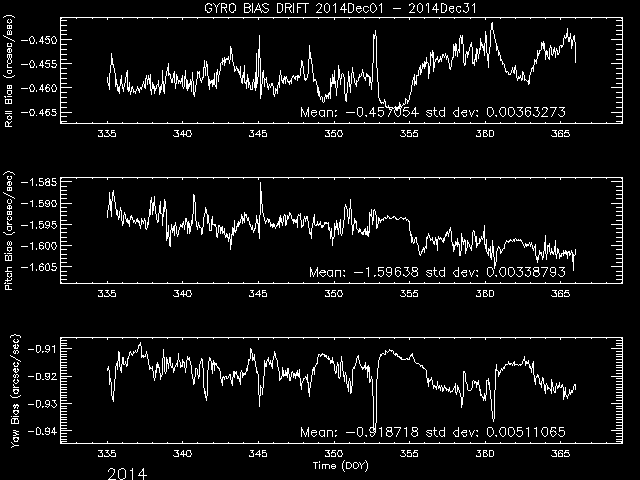
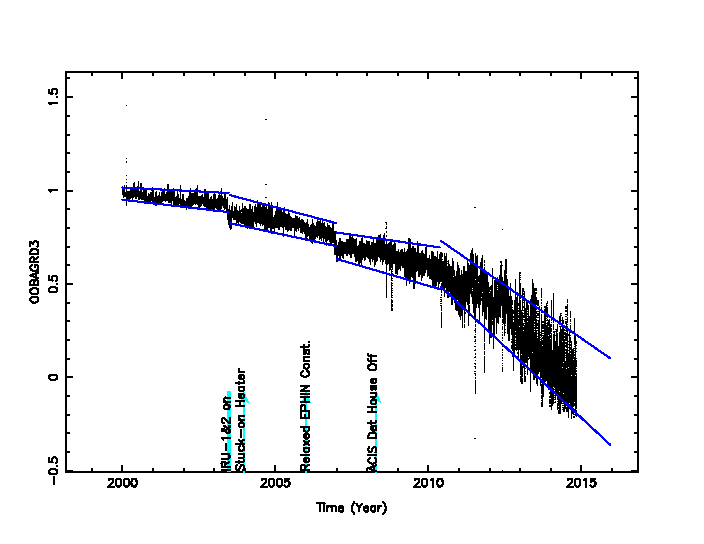
Gyro Bias Drift
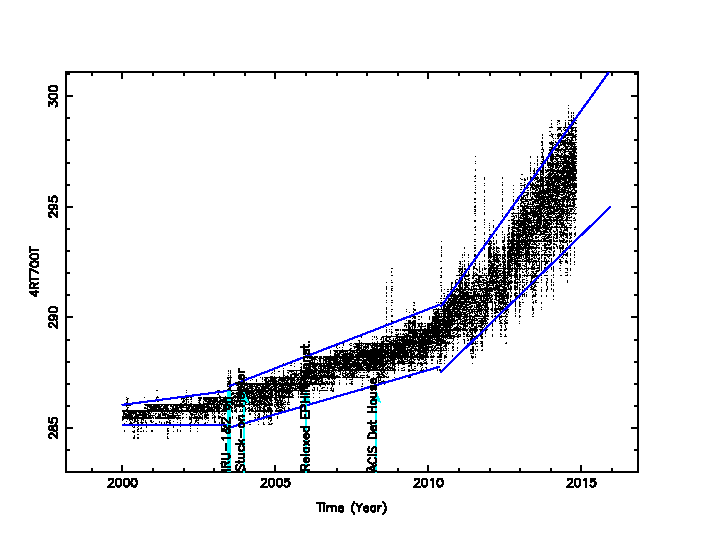
Radiation History
Radiation Zone Timing
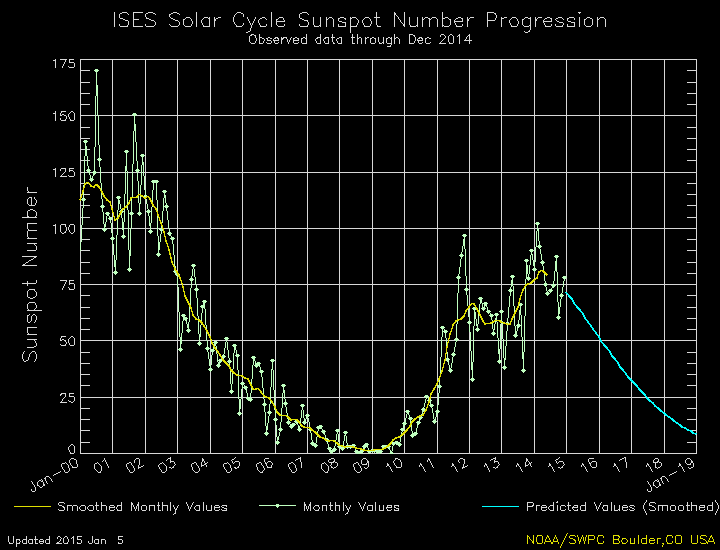
Sun Spot History
Trending
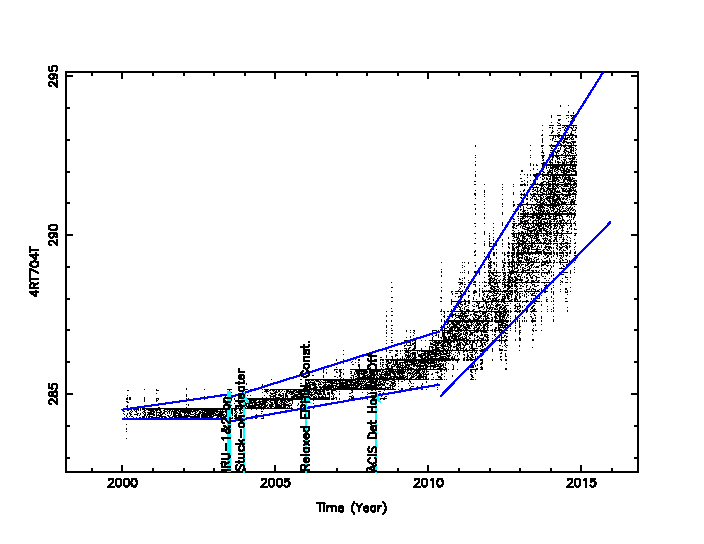
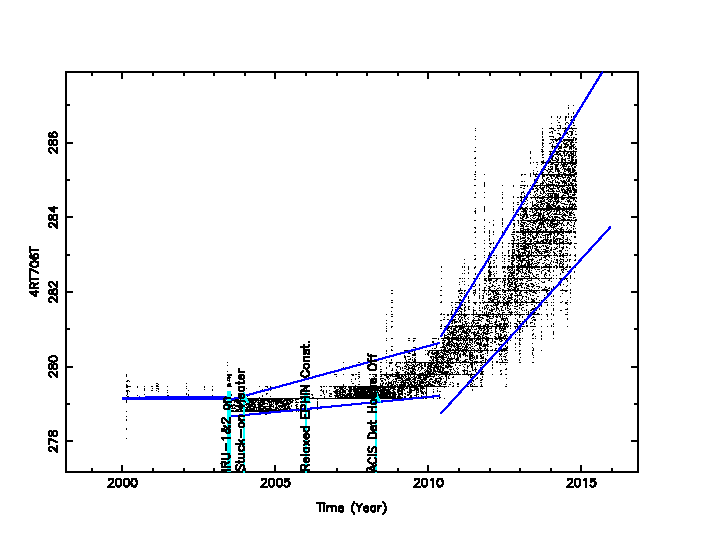
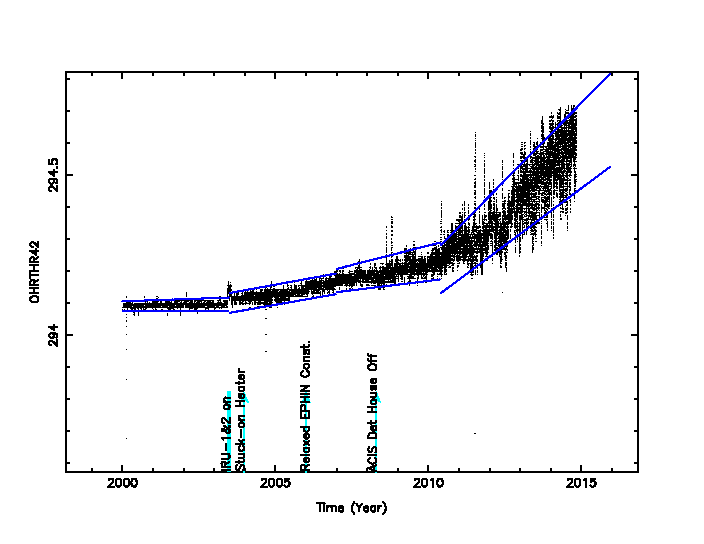
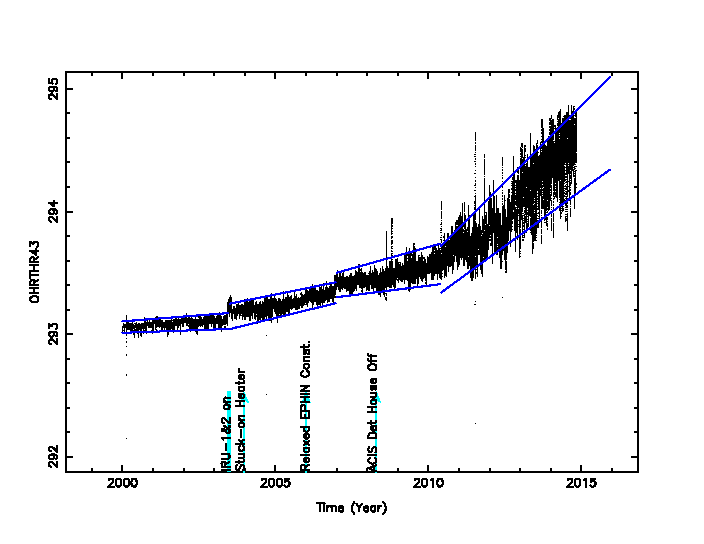
Critical Trends
| ACIS Temperatures - Daily Maximums | ||||||
|---|---|---|---|---|---|---|
| MSID | MEAN | RMS | DELTA/YR | DELTA/YR/YR | UNITS | DESCRIPTION |
| 1PDEAAT | 304.92 | 8.78 | -3.089e-01 | 3.264e+00 | K | PSMC DEA PS A TEMP |
| 1PIN1AT | 291.78 | 7.86 | -1.034e-01 | 2.775e+00 | K | PSMC TEMP 1A |
)
)
| HRMA Computed Averages - Daily Maximums | ||||||
|---|---|---|---|---|---|---|
| MSID | MEAN | RMS | DELTA/YR | DELTA/YR/YR | UNITS | DESCRIPTION |
| OBAAVG | 291.47 | 1.78 | -4.586e+00 | -5.868e+01 | TEMP | OBA/TFTE |
)
| EPHIN Temperatures - Daily Maximums | ||||||
|---|---|---|---|---|---|---|
| MSID | MEAN | RMS | DELTA/YR | DELTA/YR/YR | UNITS | DESCRIPTION |
| TEIO | 329.19 | 20.85 | 6.859e+00 | -9.822e+00 | K | EPHIN ELECTRONICS HOUSING TEMP |
| TEPHIN | 334.09 | 6.72 | 3.888e+00 | -3.198e+01 | K | EPHIN SENSOR HOUSING TEMP |
)
)
| S/C Main Temperatures - Daily Maximums | ||||||
|---|---|---|---|---|---|---|
| MSID | MEAN | RMS | DELTA/YR | DELTA/YR/YR | UNITS | DESCRIPTION |
| TCYLFMZM | 306.24 | 25.91 | 2.143e+00 | 2.840e+00 | K | CNT CYL TEMP:-Z SIDE UNDER LAE-1 |
| TCYLFMZP | 308.42 | 24.75 | 2.145e+00 | 2.966e+00 | K | CNT CYL TEMP:-Z SIDE UNDER LAE-2 |
)
)
| S/C Ancillary Temperatures - Daily Maximums | ||||||
|---|---|---|---|---|---|---|
| MSID | MEAN | RMS | DELTA/YR | DELTA/YR/YR | UNITS | DESCRIPTION |
| TFSSBKT1 | 345.92 | 17.04 | 4.986e-01 | -3.728e+01 | K | FSS BRACKET-1 TEMP (+Y) |
| TFSSBKT2 | 340.90 | 24.18 | 3.892e+00 | -6.609e+01 | K | FSS BRACKET-2 TEMP (+Y) |
| TSCTSF1 | 302.70 | 3.24 | 2.501e+00 | -1.019e+01 | K | SC-TS FITTING -1 TEMP |
| TSCTSF6 | 304.79 | 3.63 | 2.945e+00 | -1.370e+01 | K | SC-TS FITTING -6 TEMP |
)
)
)
)
| MUPS - Daily Maximums | ||||||
|---|---|---|---|---|---|---|
| MSID | MEAN | RMS | DELTA/YR | DELTA/YR/YR | UNITS | DESCRIPTION |
| PM1THV1T | 333.47 | 8.23 | -2.762e-01 | -1.892e+02 | K | MUPS 1 THRUSTER VALVE 01 TEMP |
| PLINE02T | 317.64 | 11.13 | 3.347e+00 | 5.826e+00 | K | PROP LINE TEMP 02 |
| PLINE03T | 316.64 | 13.64 | 3.278e+00 | 7.846e+00 | K | PROP LINE TEMP 03 |
| PLINE04T | 302.24 | 12.73 | 3.233e+00 | 7.055e+00 | K | PROP LINE TEMP 04 |
)
)
)
)
Quarterly Trends
- Spacecraft Main Temperature
| Previous Quarter | ||||||
| MSID | MEAN | RMS | DELTA/YR | DELTA/YR/YR | UNITS | DESCRIPTION |
| TASPPCM | 292.36 | 3.51 | 1.357e+00 | 1.847e+02 | K | AFT SHEAR PANEL TEMP:-Z PCAD COMP |
| TCYLAFT1 | 305.81 | 3.84 | 2.428e+00 | 2.223e+02 | K | CNT CYL TEMP:16-IN FWD OF SC-TS FIT-1 |
| TCYLAFT2 | 280.46 | 1.87 | 3.745e+00 | 9.440e+01 | K | CNT CYL TEMP:16-IN FWD OF SC-TS FIT-2 |
| TPZLGABM | 210.90 | 1.23 | -1.055e+00 | -7.339e+00 | K | +Z LOW-GAIN ANTENNA BOOM TEMP |
| TSAMYT | 321.13 | 0.96 | 1.216e+01 | -5.127e+01 | K | -Y WING SOLAR ARRAY TEMP |
| TSAPYT | 320.91 | 0.96 | 1.235e+01 | -3.957e+01 | K | +Y WING SOLAR ARRAY TEMP |
)
)
)
)
)
)
- Spacecraft Anc. Temperature
| Previous Quarter | ||||||
| MSID | MEAN | RMS | DELTA/YR | DELTA/YR/YR | UNITS | DESCRIPTION |
| TSCTSF1 | 303.47 | 3.38 | 1.015e+00 | 9.105e+01 | K | SC-TS FITTING -1 TEMP |
| TSCTSF2 | 279.31 | 1.62 | 3.130e+00 | 7.288e+01 | K | SC-TS FITTING -2 TEMP |
| TSCTSF3 | 265.06 | 1.27 | 3.610e+00 | 2.521e+01 | K | SC-TS FITTING -3 TEMP |
| TSCTSF4 | 268.89 | 1.45 | 2.935e+00 | 4.175e+01 | K | SC-TS FITTING -4 TEMP |
| TSCTSF5 | 285.01 | 2.31 | 7.297e-01 | 9.070e+01 | K | SC-TS FITTING -5 TEMP |
| TSCTSF6 | 305.71 | 3.94 | -1.610e+00 | 1.111e+01 | K | SC-TS FITTING -6 TEMP |
)
)
)
)
)
)
Envelope Trending
OBA Forward Bulkhead
PCAD FTS Grad
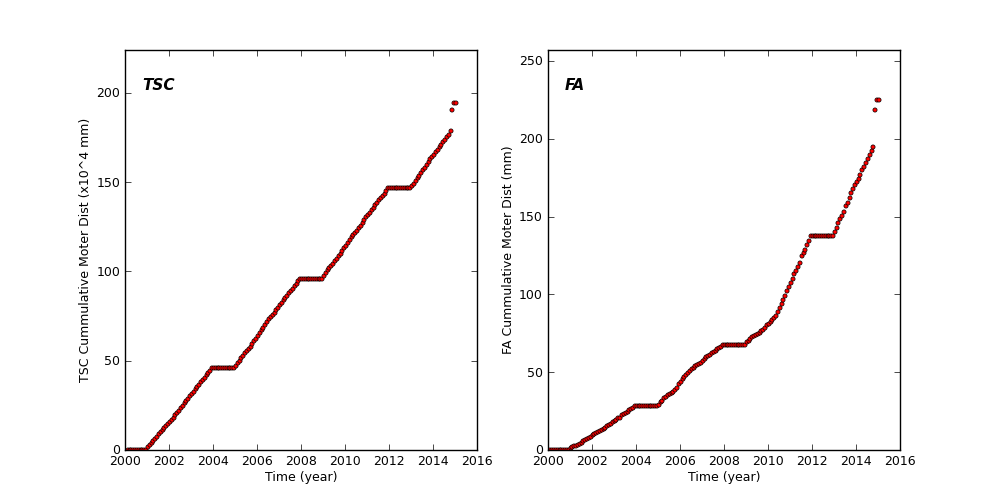
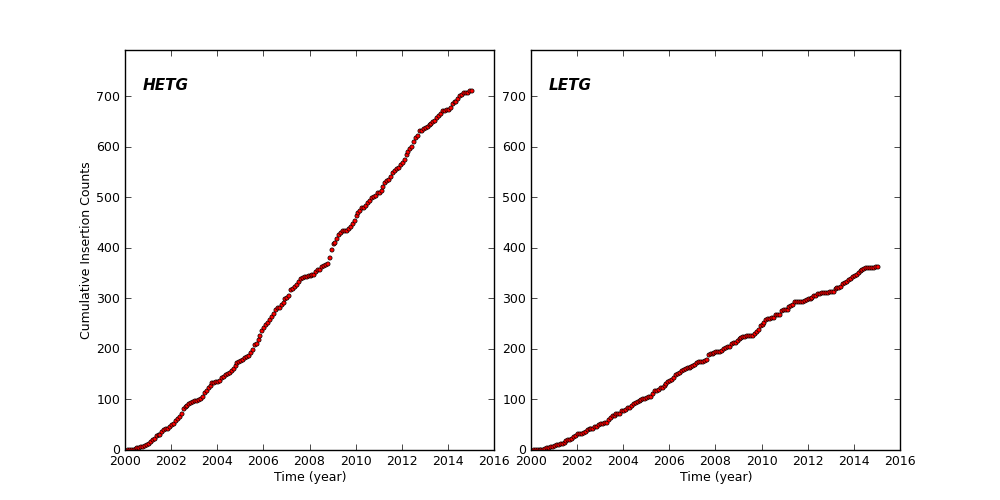
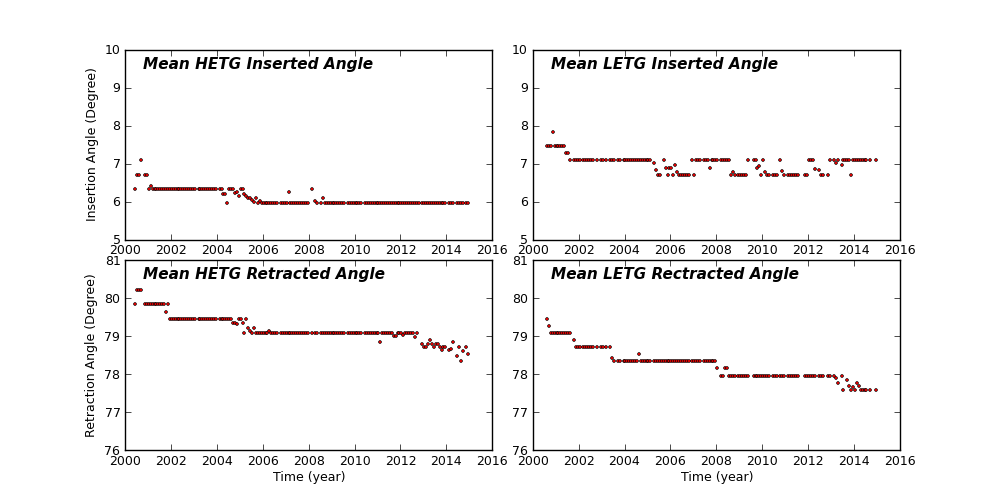
Spacecraft Motions
TSC and FA Cummulative Moter Distance
HETG and LETG Cummulative Insertion Counts
HETG/LETG Insertion/Retraction Angle
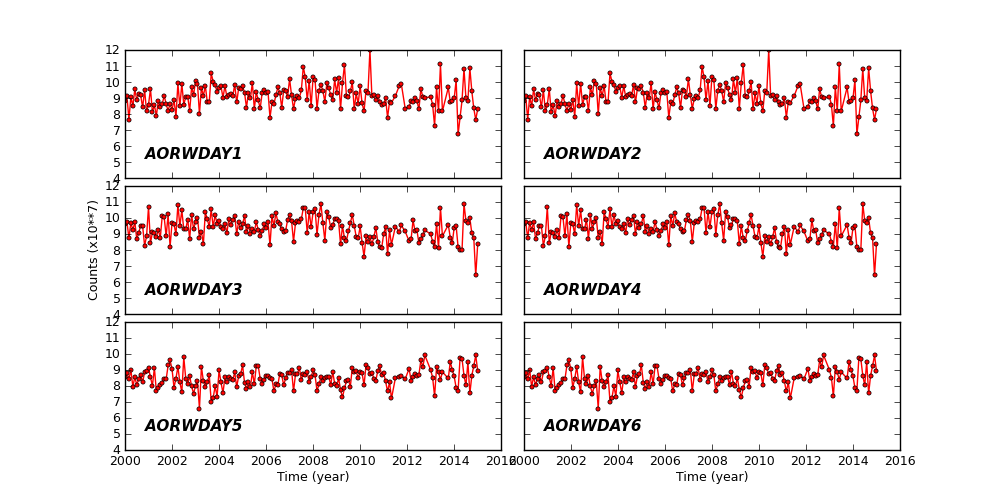
Reaction Wheel Rotations
Links to Past Monthly Reports
| Year | Month | |||||||||||
|---|---|---|---|---|---|---|---|---|---|---|---|---|
| 1999 | Jul | Aug | Sep | Oct | Nov | Dec | ||||||
| 2000 | Jan | Feb | Mar | Apr | May | Jun | Jul | Aug | Sep | Oct | Nov | Dec |
| 2001 | Jan | Feb | Mar | Apr | May | Jun | Jul | Aug | Sep | Oct | Nov | Dec |
| 2002 | Jan | Feb | Mar | Apr | May | Jun | Jul | Aug | Sep | Oct | Nov | Dec |
| 2003 | Jan | Feb | Mar | Apr | May | Jun | Jul | Aug | Sep | Oct | Nov | Dec |
| 2004 | Jan | Feb | Mar | Apr | May | Jun | Jul | Aug | Sep | Oct | Nov | Dec |
| 2005 | Jan | Feb | Mar | Apr | May | Jun | Jul | Aug | Sep | Oct | Nov | Dec |
| 2006 | Jan | Feb | Mar | Apr | May | Jun | Jul | Aug | Sep | Oct | Nov | Dec |
| 2007 | Jan | Feb | Mar | Apr | May | Jun | Jul | Aug | Sep | Oct | Nov | Dec |
| 2008 | Jan | Feb | Mar | Apr | May | Jun | Jul | Aug | Sep | Oct | Nov | Dec |
| 2009 | Jan | Feb | Mar | Apr | May | Jun | Jul | Aug | Sep | Oct | Nov | Dec |
| 2010 | Jan | Feb | Mar | Apr | May | Jun | Jul | Aug | Sep | Oct | Nov | Dec |
| 2011 | Jan | Feb | Mar | Apr | May | Jun | Jul | Aug | Sep | Oct | Nov | Dec |
| 2012 | Jan | Feb | Mar | Apr | May | Jun | Jul | Aug | Sep | Oct | Nov | Dec |
| 2013 | Jan | Feb | Mar | Apr | May | Jun | Jul | Aug | Sep | Oct | Nov | Dec |
| 2014 | Jan | Feb | Mar | Apr | May | Jun | Jul | Aug | Sep | Oct | Nov | |