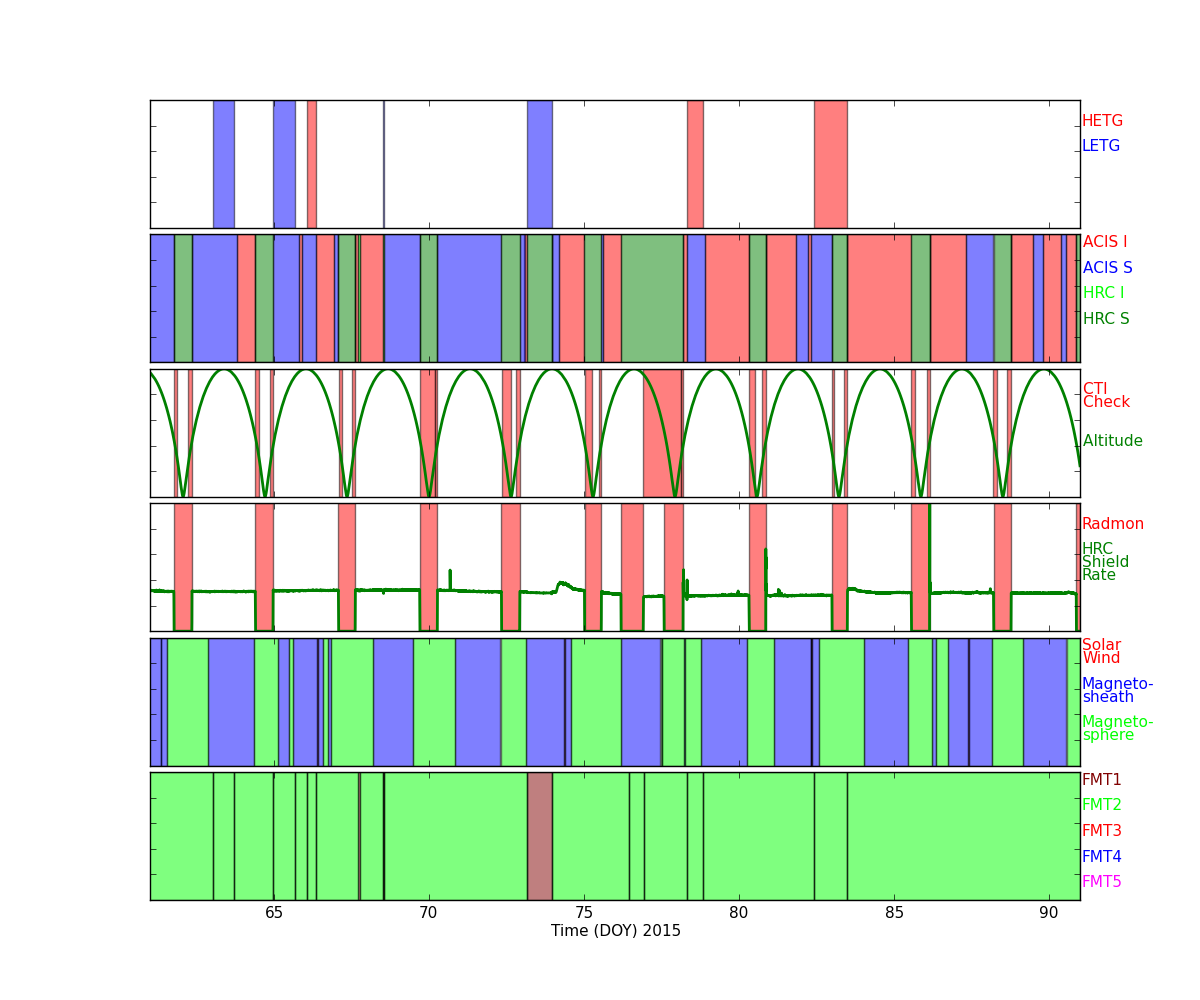
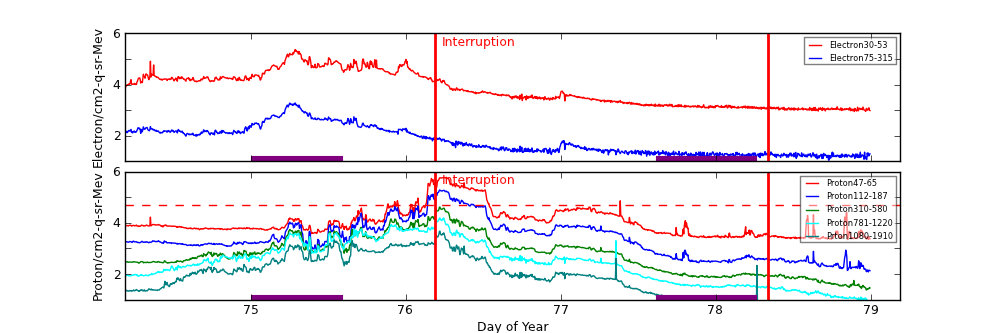
Science Run Interruptions
Observing stopped by ground activation of SCS-107 at 2015:076:04:34 (UTC). Radiation Count Rate Plots for Periods Which Interrupted Science Runs).
ACIS
ACIS DOSE Registered-Photon-Map
The steps we took to compute the dose map are;
- Level 1 Event files for a specified month are obtained from archive.
- Image data including I2, I3, S2, S3 CCDs are extracted from all event files.
- All the extracted image data were merged to create a month long exposure map for the month.
- The exposure map is opened with ds9, and check a distribution of count rates against energy. From this, estimate the upper threshold value. Any events beyond this upper threshold are assumed erroneous events such as bad pixels.
- Using this upper threshold, the data is filtered, and create a cleaned exposure map for the month.
- The exposure map from each month from the Sep 1999 is added up to create a cumulative exposure map for each month.
- Using fimgstatistic, we compute count rate statistics for each CCDs.
- For observations with high data drop rates (e.g., Crab nebula, Cas A), we corrected the observations by adding events.
Please check more detail plots at Telemetered Photon Dose Trend page.
)
)
)
Statistics:
# IMAGE     NPIX     MEAN        RMS        MIN     MAX
ACIS_mar15 6004901   8.257       10.756     0.0     2424


I2 node 0  262654   7.238560    3.354597    0.0    62.0
I2 node 1  262654   7.645598    8.660253    0.0  2424.0
I2 node 2  262654   7.293917    3.281557    0.0    67.0
I2 node 3  262654   7.468316    4.805512    0.0  1536.0

I3 node 0  262654   7.730520    3.473802    0.0    64.0
I3 node 1  262654   7.871648    7.409300    0.0  1344.0
I3 node 2  262654   7.341965    3.162909    0.0    76.0
I3 node 3  262654   7.446792    3.340356    0.0   270.0

S2 node 0  262654   9.227719    5.082120    0.0  1819.0
S2 node 1  262654   10.192134   4.100391    0.0    56.0
S2 node 2  262654   14.728439   9.210021    0.0  2252.0
S2 node 3  262654   20.051316   10.060499   0.0   438.0

S3 node 0  262654   14.569133   7.429150    0.0    87.0
S3 node 1  262654   17.718402   7.814063    0.0    97.0
S3 node 2  262654   16.502447   7.354506    0.0    49.0
S3 node 3  262654   11.954046   4.828678    0.0    37.0
)
)
)
Statistics:
 IMAGE     NPIX      MEAN        RMS        MIN      MAX
ACIS_total 6004901   1873.236    2454.841   0.0      108414


I2 node 0  262654   1573.569835 301.624307   297.0    9098.0
I2 node 1  262654   1658.817689 416.733661   328.0   38477.0
I2 node 2  262654   1688.490357 353.063640   328.0    9210.0
I2 node 3  262654   1686.582475 425.021276   311.0   28029.0

I3 node 0  262654   1772.072881 421.952431   308.0    6948.0
I3 node 1  262654   1859.677788 1408.200554  317.0   35591.0
I3 node 2  262654   1625.826115 291.845929   300.0    8368.0
I3 node 3  262654   1611.642246 312.624288   284.0   27316.0

S2 node 0  262654   2193.100574 317.984710  1158.0   21229.0
S2 node 1  262654   2333.757804 510.183128  1224.0   12896.0
S2 node 2  262654   2576.956001 488.598513  1557.0   19456.0
S2 node 3  262654   2507.367315 351.657981  1470.0   42669.0

S3 node 0  262654   3896.183073 1799.205778 1606.0   13591.0
S3 node 1  262654   5072.702081 2081.040313    0.0   14066.0
S3 node 2  262654   3876.558839 988.123962  1591.0    9389.0
S3 node 3  262654   3007.281754 454.662634  1722.0   10379.0
)
|
)
|
)
|
)
|
| Dec 2014 | Sep 2014 | Jun 2014 | Mar 2014 |
|---|
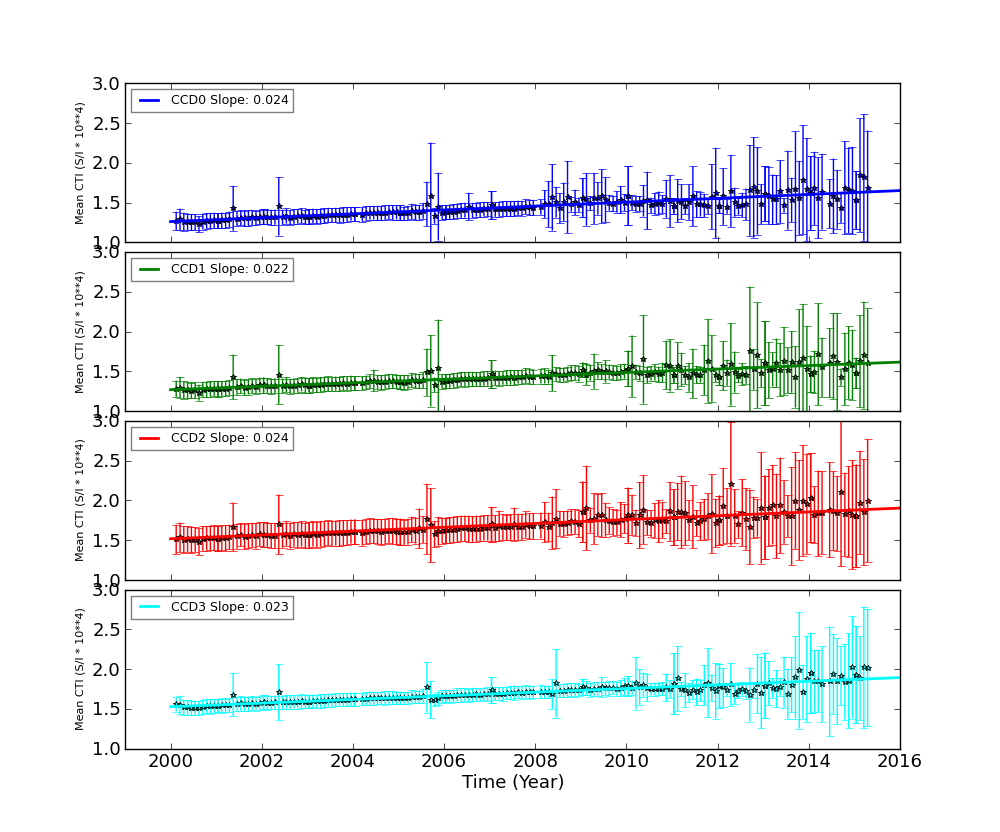
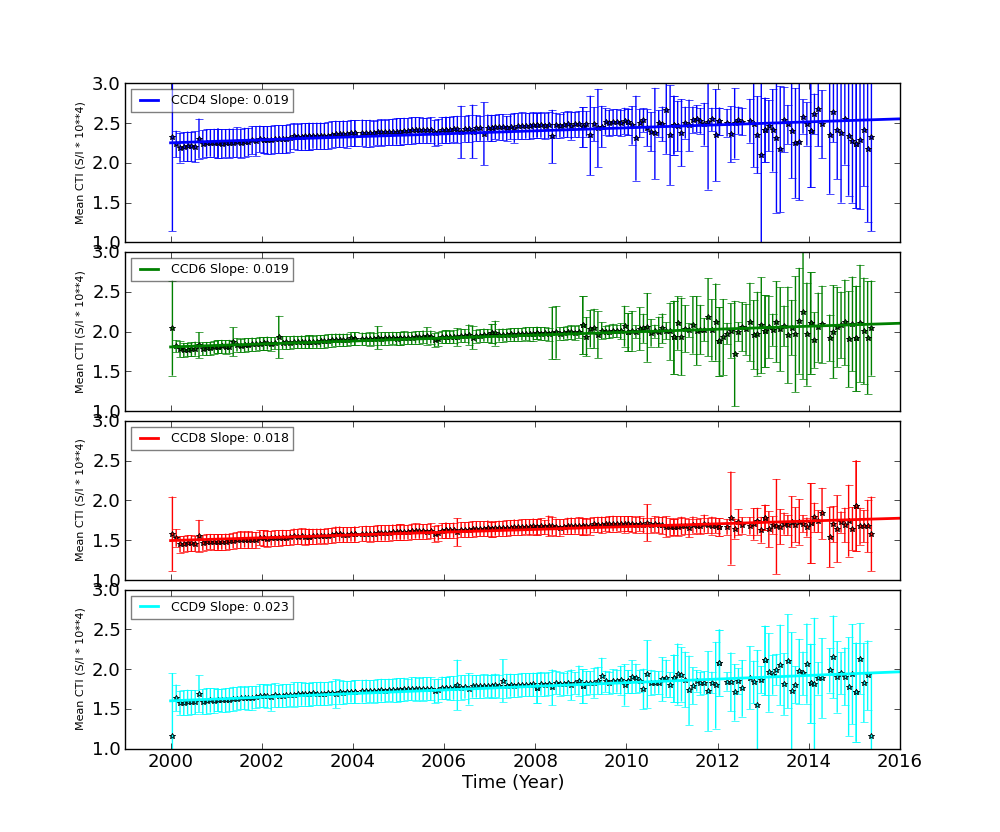
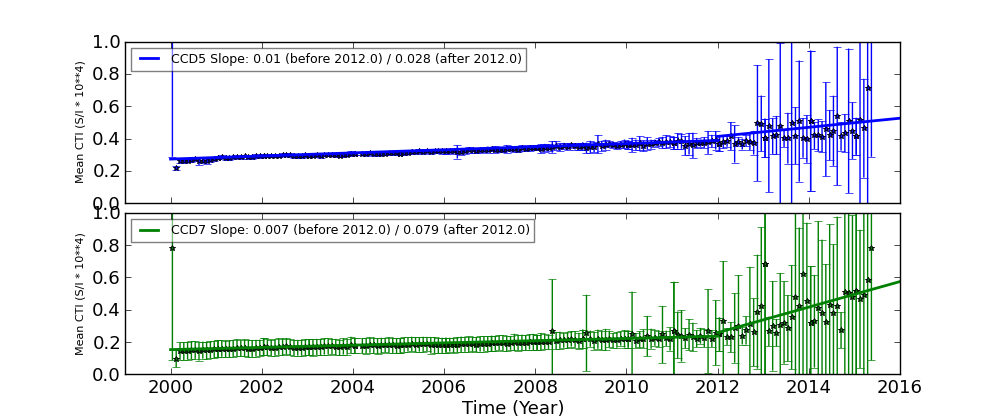
The Mean Detrended CTI
We report CTIs with a refined data definition. CTIs were computed for the temperature dependency corrected data. Please see CTI page for detailed explanation. CTI's are computed for Mn K alpha, and defined as slope/intercept x10^4 of row # vs ADU. Data file: here
Imaging CCDs
Spectral CCDs
Backside CCDs
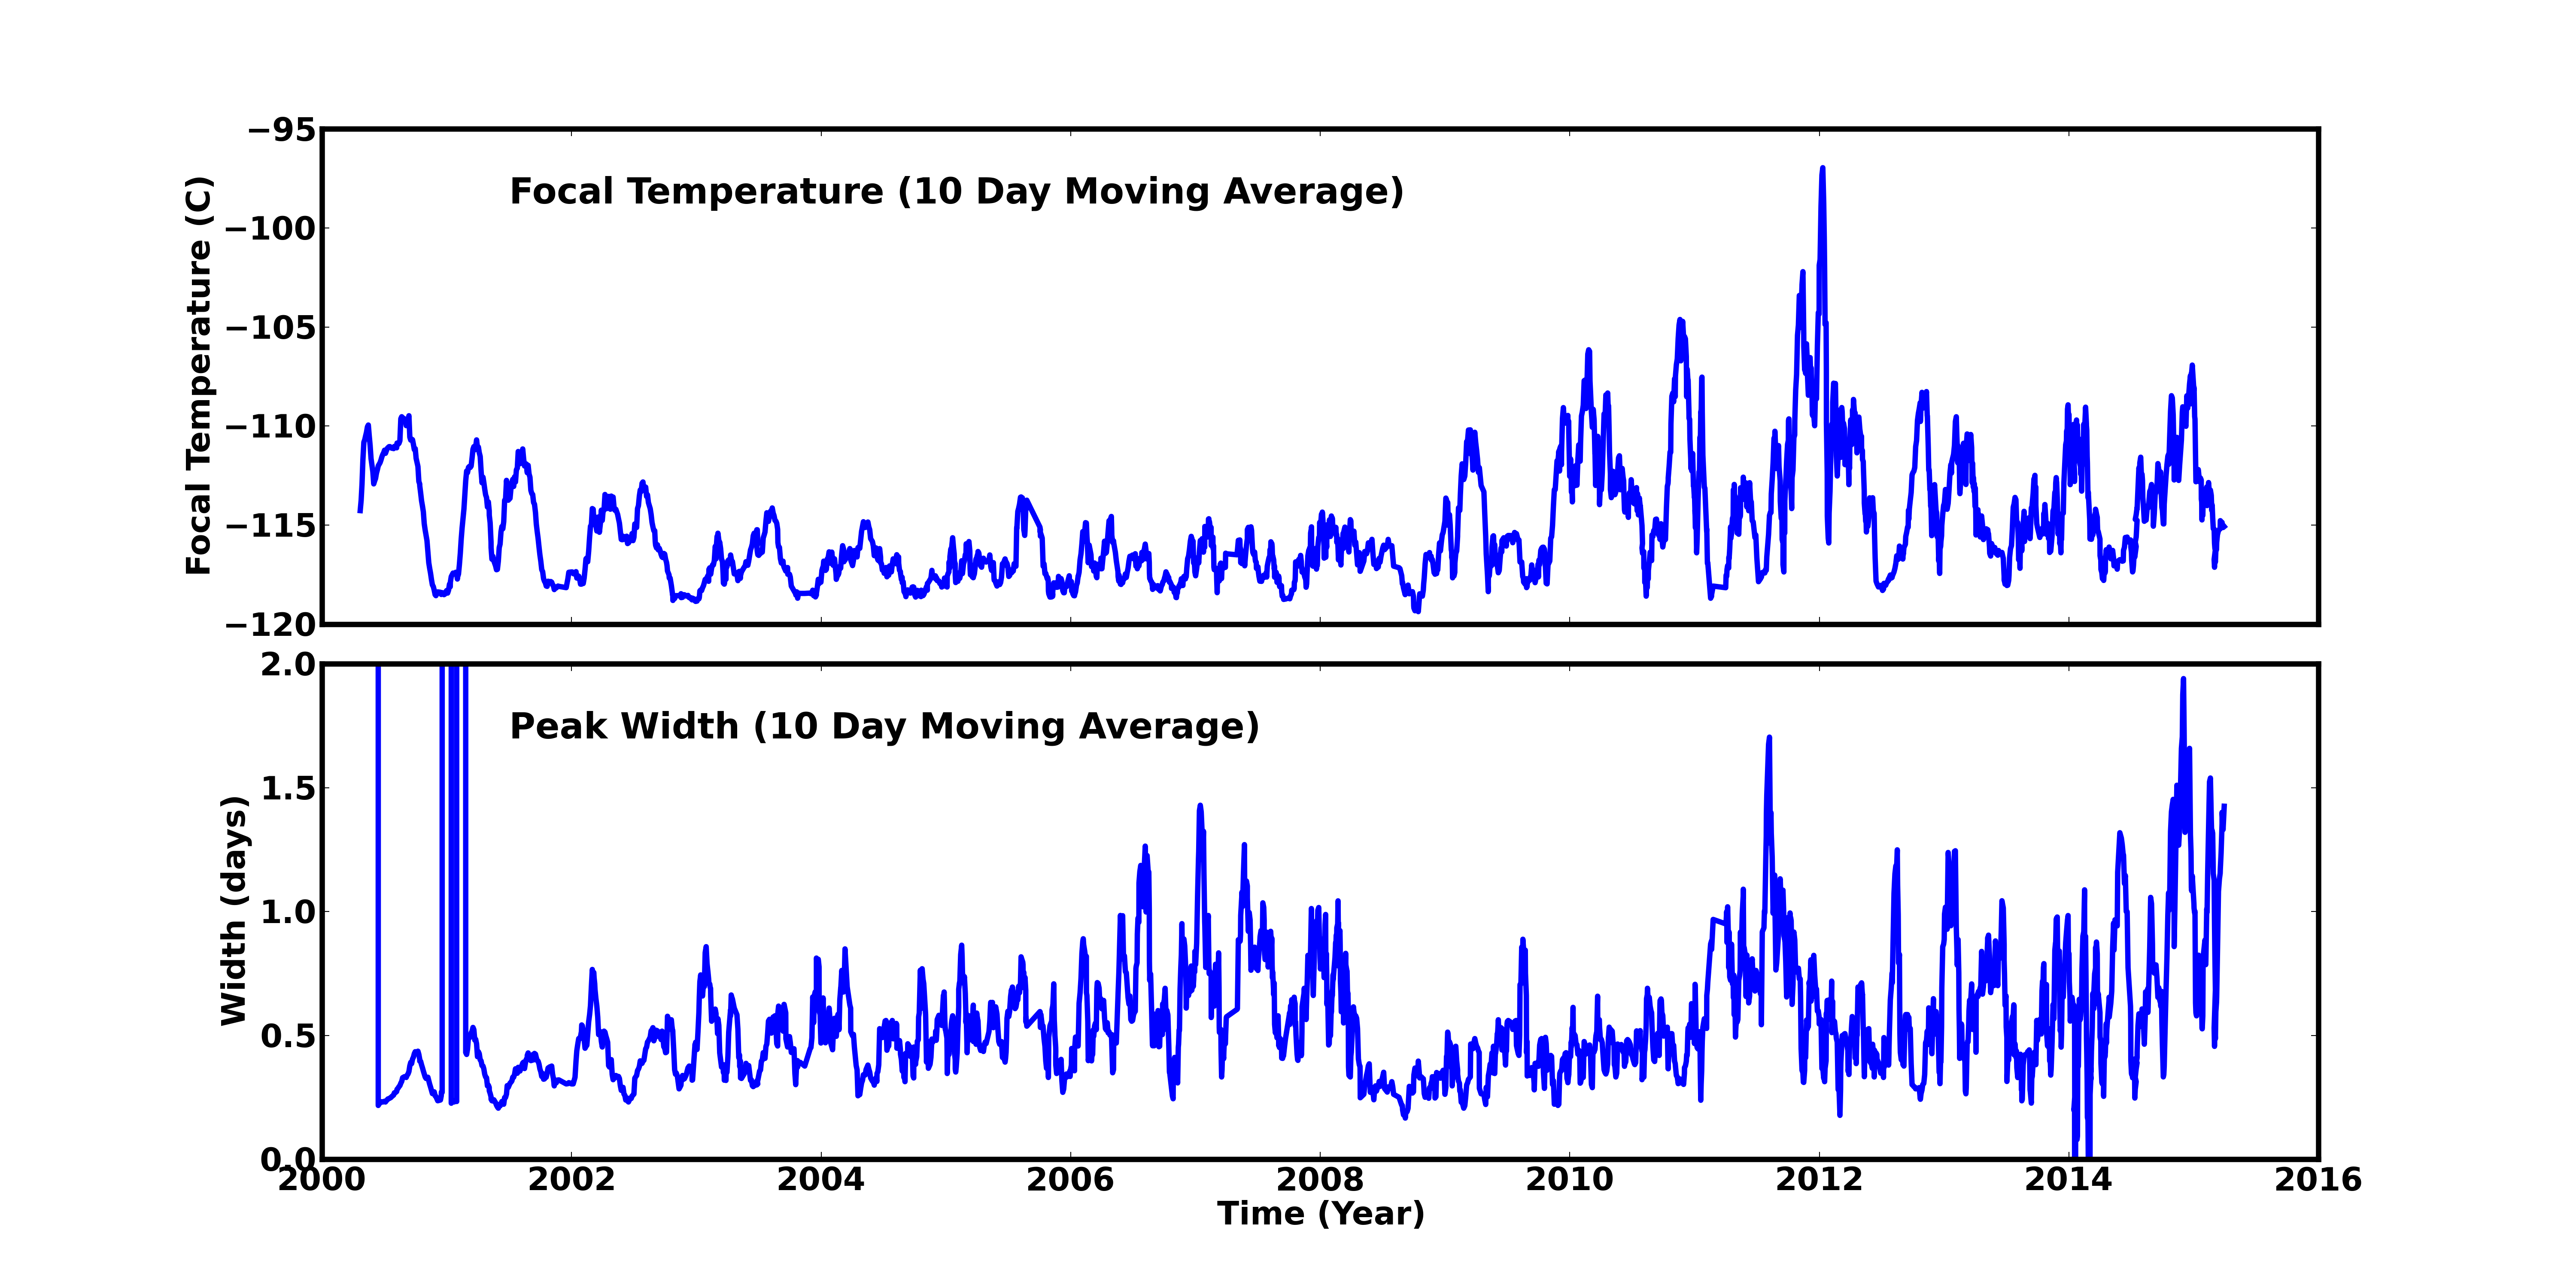
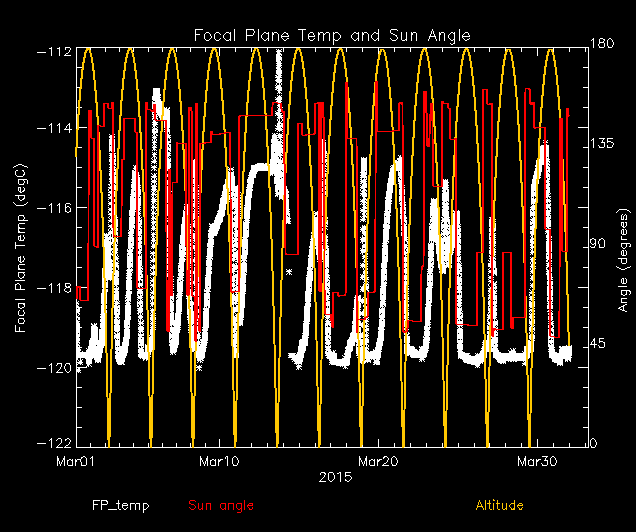
Focal Plane Temperature
Mar 2015 Focal Temperature
| The Mean (max) FPT: | |
|---|---|
| -113.72 | +/- 4.54 C |
| Mean Width: | |
| 0.99 | +/- 0.83 days |
Averaged Focal Plane Temperature
We are using 10 period moving averages to show trends of peak temperatures and peak widths. Note, the gaps in the width plot are due to missing/corrupted data.
Focal Plane Temperature, Sun Angle and Altitude
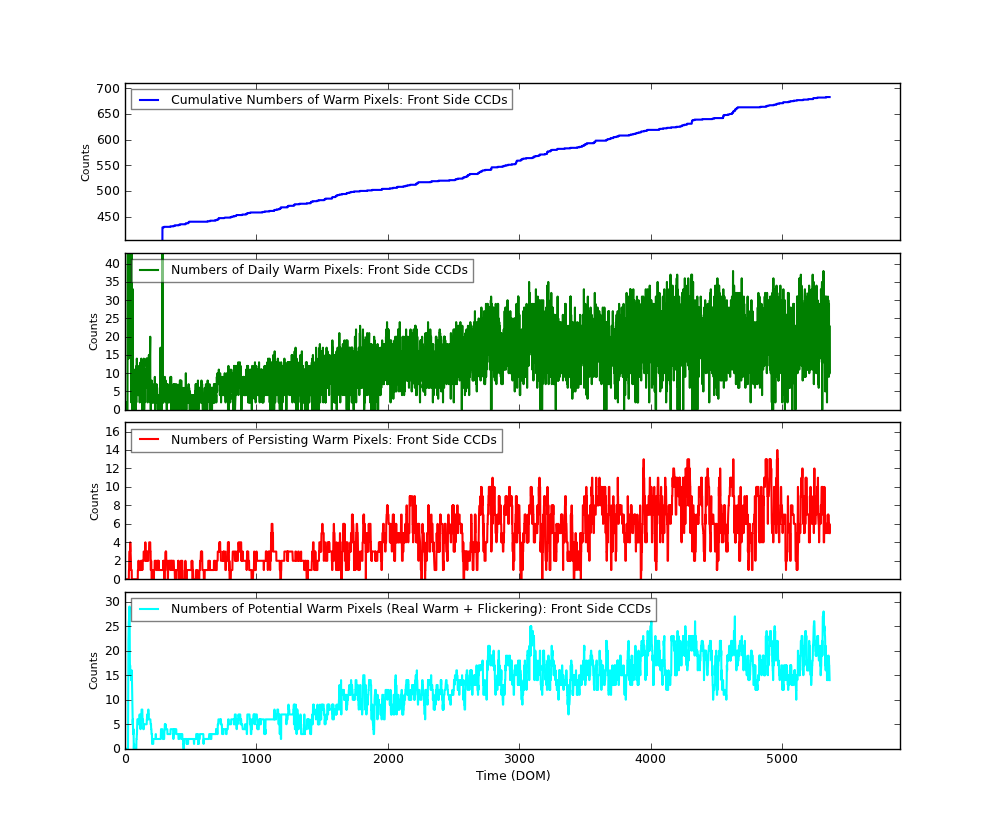
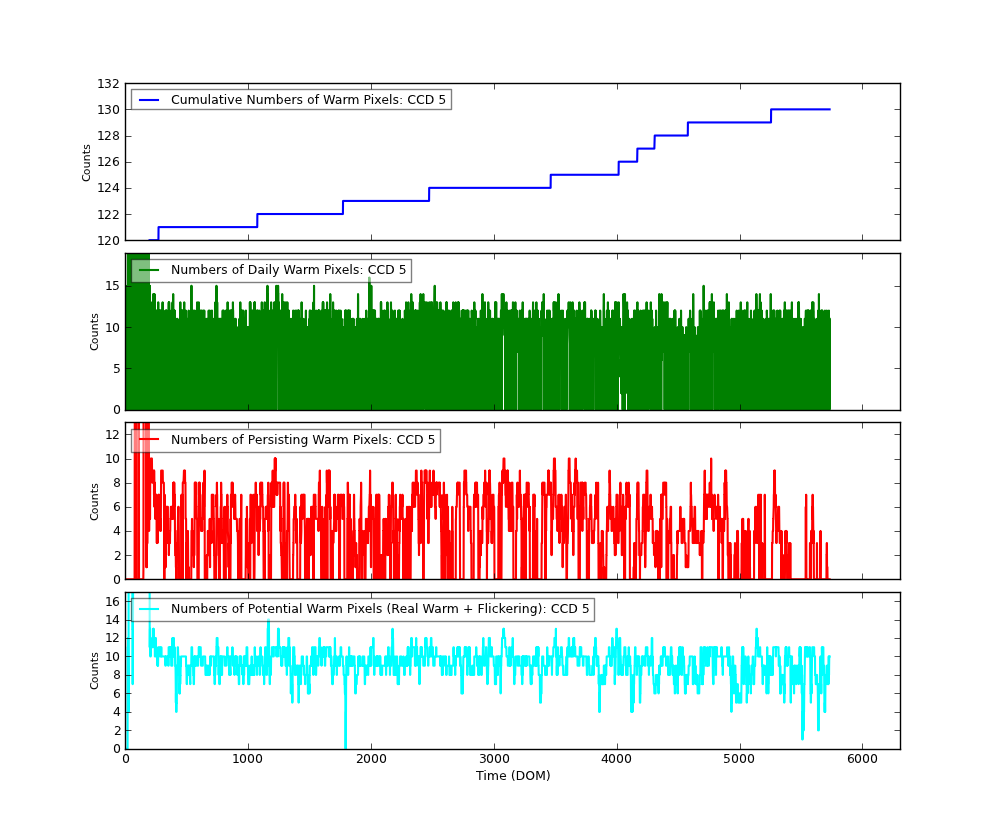
Bad Pixels
The plots below were generated with a new warm pixel finding script. Please see Acis Bad Pixel Page for details.
Front Side CCDs
Back Side CCD (CCD5)
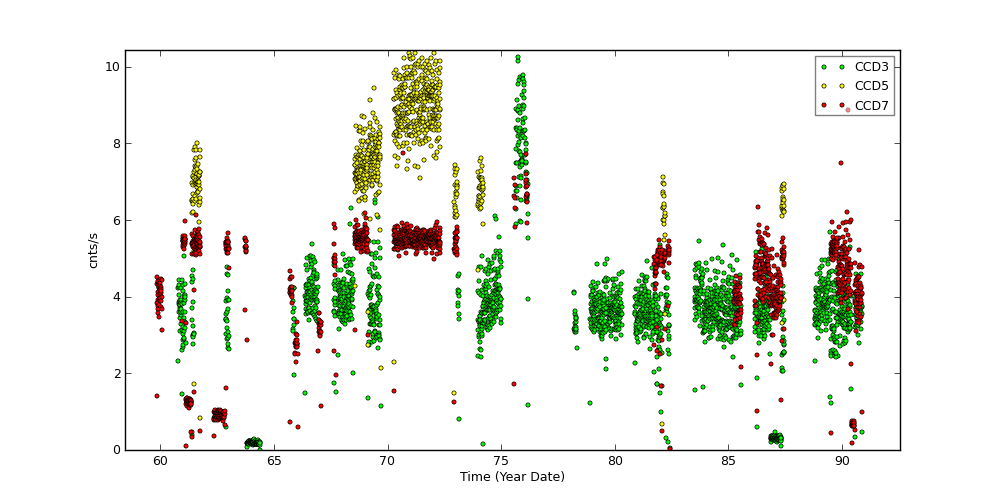
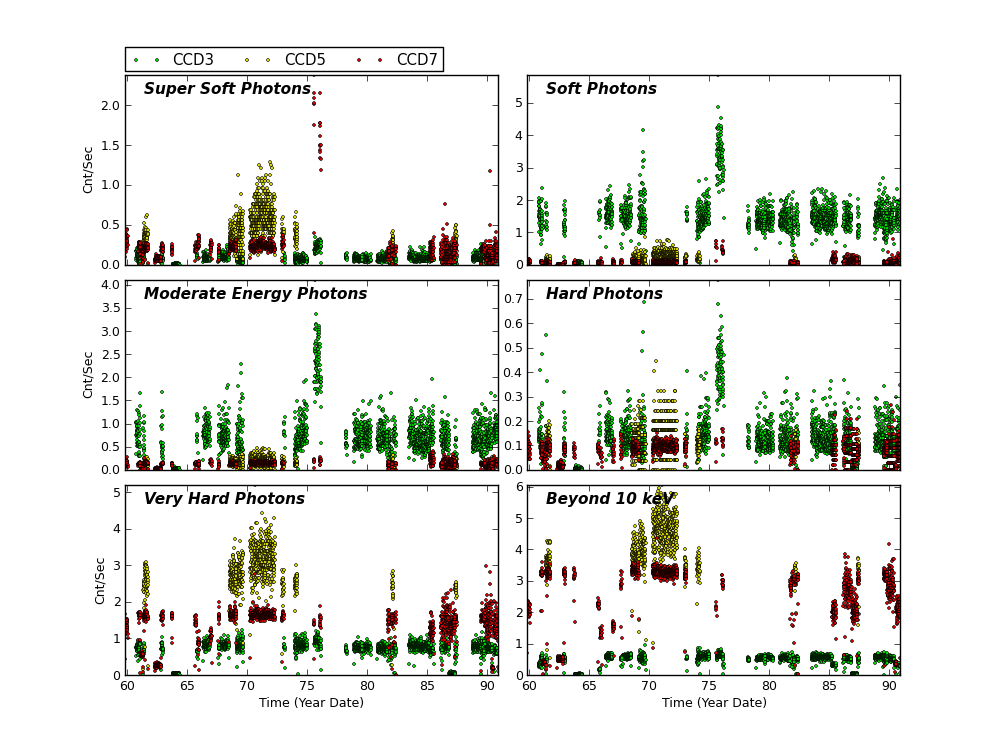
Science Instrument Background Rates
| Name | Low (keV) | High(KeV) | Description |
|---|---|---|---|
| SSoft | 0.00 | 0.50 | Super soft photons |
| Soft | 0.50 | 1.00 | Soft photons |
| Med | 1.00 | 3.00 | Moderate energy photons |
| Hard | 3.00 | 5.00 | Hard Photons |
| Harder | 5.00 | 10.00 | Very Hard photons |
| Hardest | 10.00 | Beyond 10 keV |
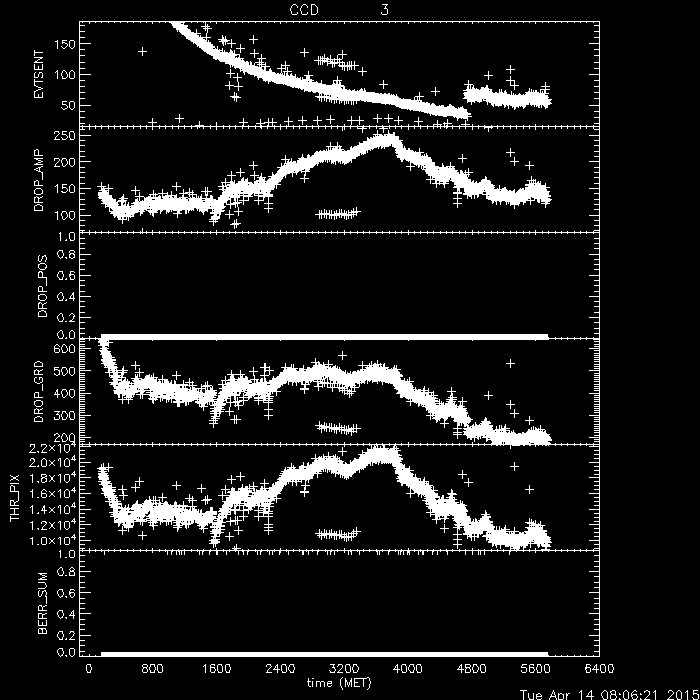
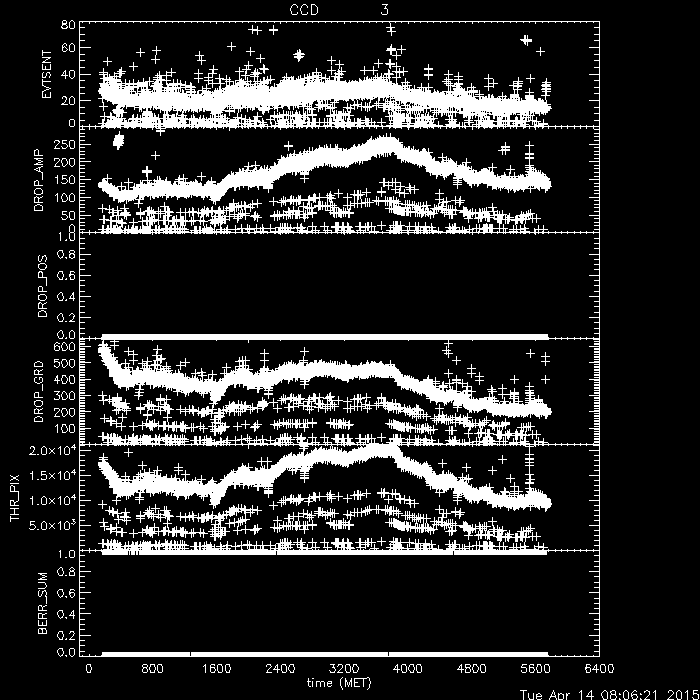
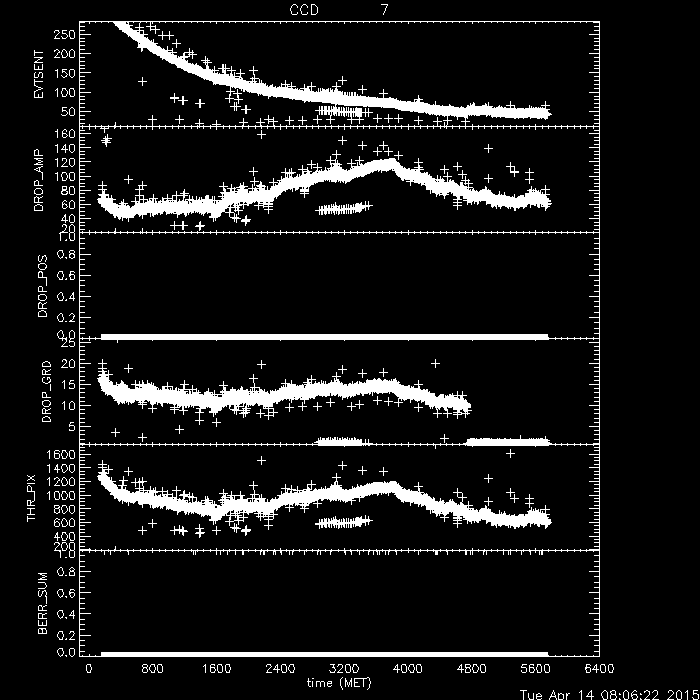
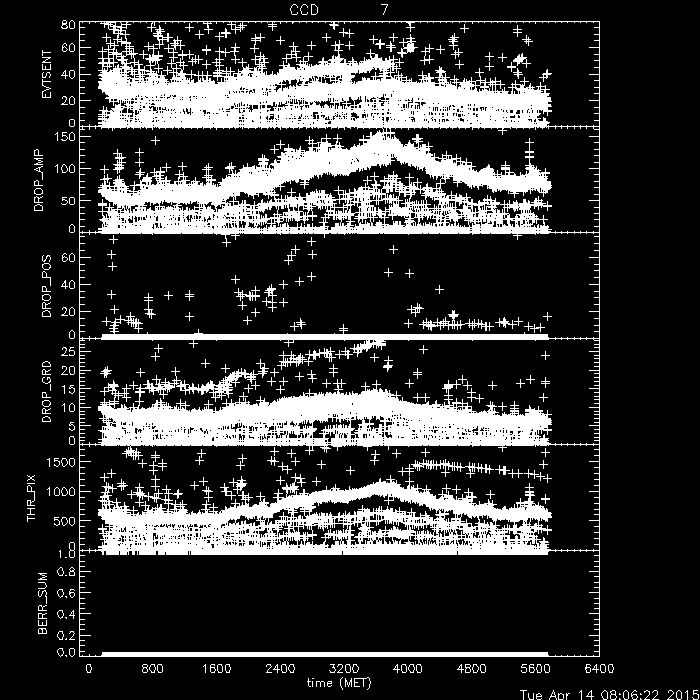
ACIS Rejected Events
The links below are plots of stat1 quantities, showing on-board rejected events. The average EVTSENT, DROP_AMP, DROP_POS, DROP_GRD, THR_PIX, and maximum BERR_SUM obtained from L1 acis*stat1.fits files are plotted for each observation. CTI observations are plotted separately from regular science observations.
Column definitions:
- EVTSENT - number of events sent in data record
- DROP_AMP - number of discarded events due to corrected amplitude
- DROP_POS - number of discarded events due to CCD position
- DROP_GRD - number of discarded events due to grade code
- THR_PIX - number of pixels above respective threshold level
- BERR_SUM - number of pixel bias errors so far in science run
Note the half-life decline of the CTI source is clearly evidenced in the steady janline of EVTSENT.
CCD3 CTI Observations
CCD3 Science Observations
CCD7 CTI Observations
CCD7 Science Observations
ACIS Gain Trends
We computed ACIS gain and offset from ACIS event1 files used in CTI computation, following the step described by C. Grant ACIS gain @ -120C page.
Instead computing gains and offsets from individual observations, we combined all data from each month and computed an monthly averaged gain and offset.
The following plots show CCD3 and CCD5 gains and offset trends.
| CCD 3 | |
)
|
)
|
| CCD 5 | |
)
|
)
|
HRC
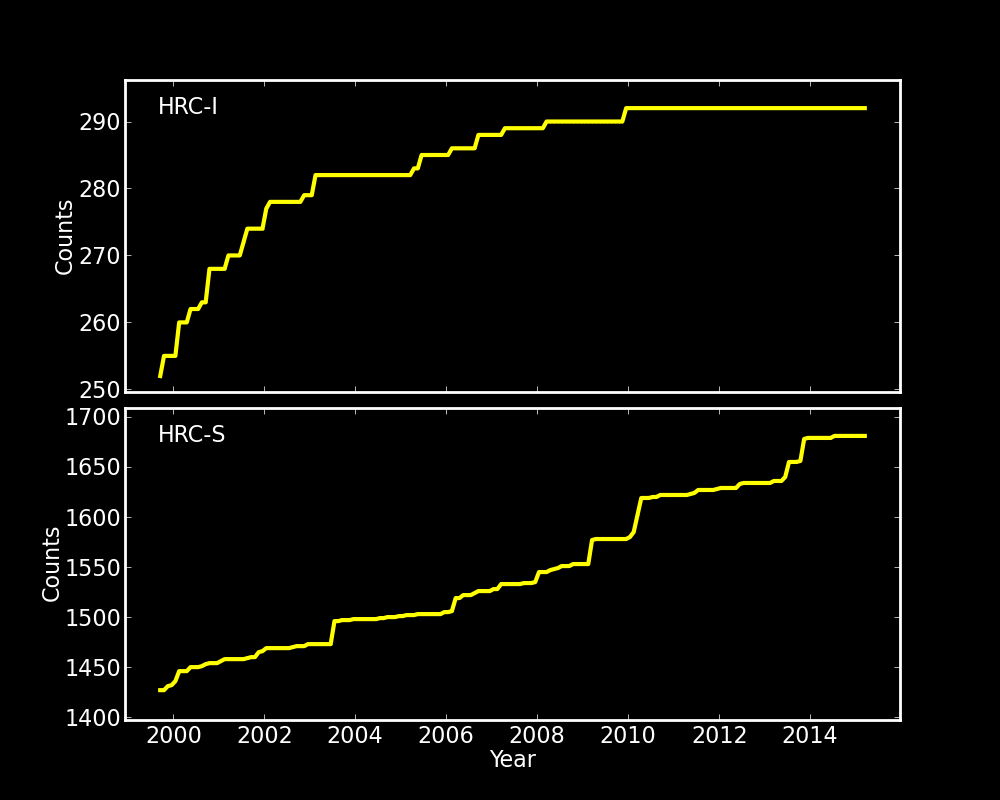
DOSE of Central 4K Pore-Pairs
Please refer to Maximum Dose Trends for more details.
)
|
|---|
         IMAGE                NPIX      MEAN    STDDEV      MIN       MAX
HRCI_03_2015.fits          16777216   0.005    0.0766      0.0       8.0
)
        IMAGE                NPIX      MEAN    STDDEV      MIN       MAX
HRCI_08_1999_03_2015.fits  16777216   4.314    4.906       0.0       292.0
)
          IMAGE                NPIX      MEAN    STDDEV      MIN       MAX
HRCS_03_2015.fits          16777216     0.069    0.8432     0.0        152.0
)
        IMAGE                NPIX     MEAN      STDDEV      MIN      MAX
HRCS_08_1999_03_2015.fits  16777216  15.658     27.499      0.0      1681.0
|
|
Max dose trend plots corrected for events that "pile-up"
in the center of the taps due to bad position information.
|
)
|
)
|
)
|
)
|
| Dec 2014 | Sep 2014 | Jun 2014 | Mar 2014 |
|---|
)
|
)
|
)
|
)
|
| Dec 2014 | Sep 2014 | Jun 2014 | Mar 2014 |
|---|
Gratings
Focus
We plot the width of the zero order streak of ACIS/HETG observations and the width of the zero order image for HRC/LETG observations of point sources. No significant defocusing trend is seen at this time. See Gratings Focus pages.
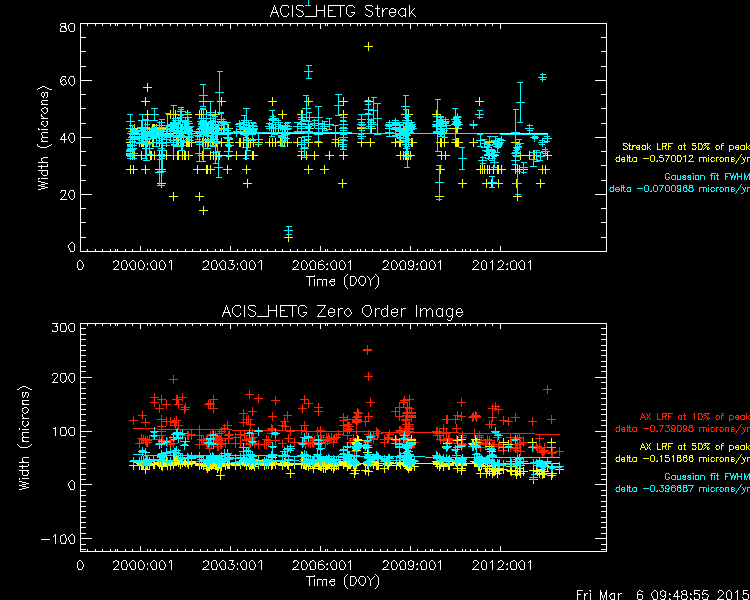
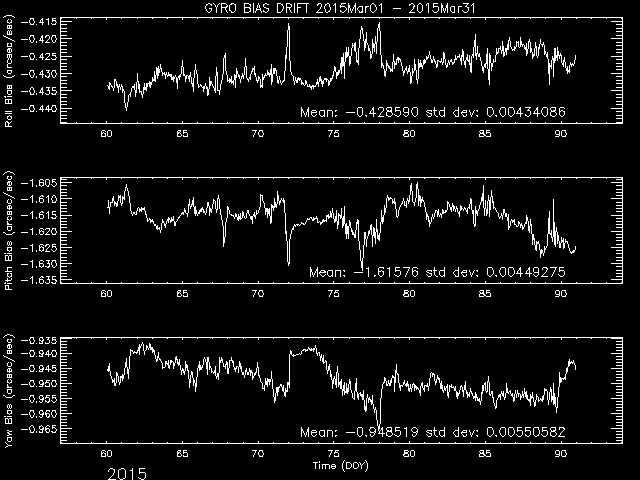
PCAD
ACA Trending
Gyro Bias Drift
Radiation History
Radiation Zone Timing
Plotted below are radiation zone timing plots based on the following definitions of radiation zone:
- RADZONE - Ephin levels (in any of the E1300,P4GM,P41GM channels) are more than 1/3 of RADMON safing thresholds.
- RADMON - Radmon is disabled for radiation zone (as commanded based on OFLS model, for comparison with actual radiation levels).
- PERIGEE - Time of closest earth approach (for comparison)
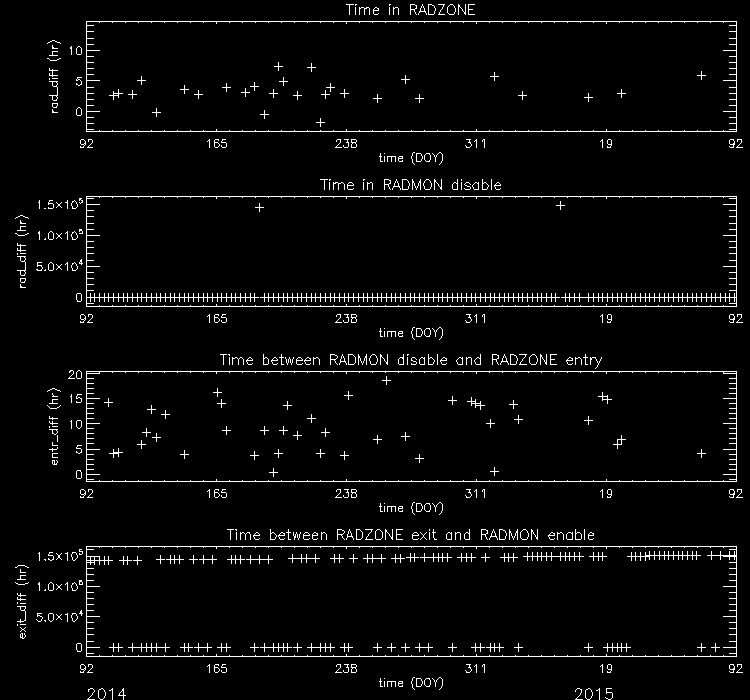
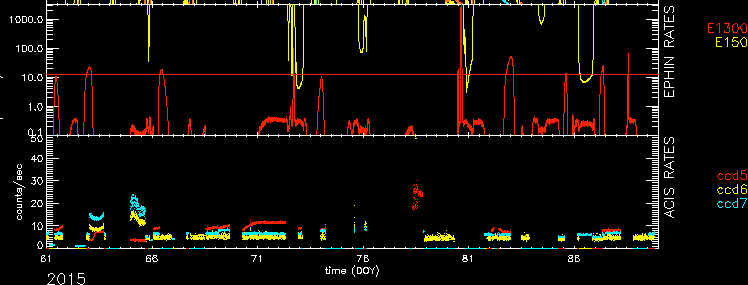
Radiation Count Rates of Mar 2015
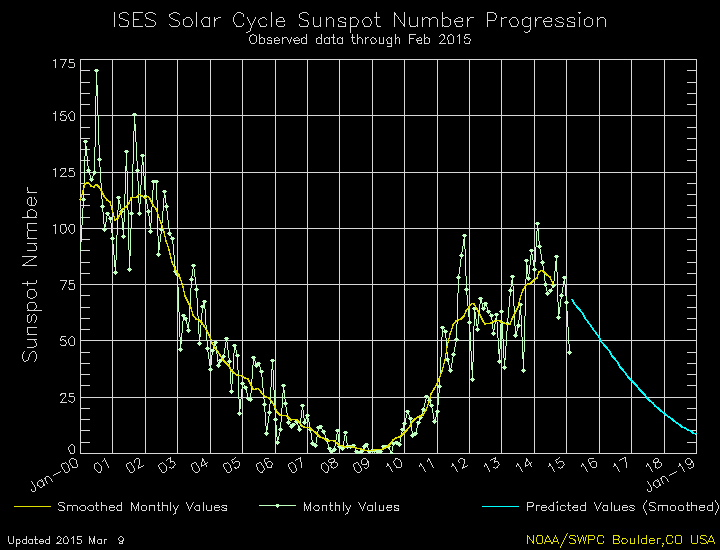
Sun Spot History
Trending
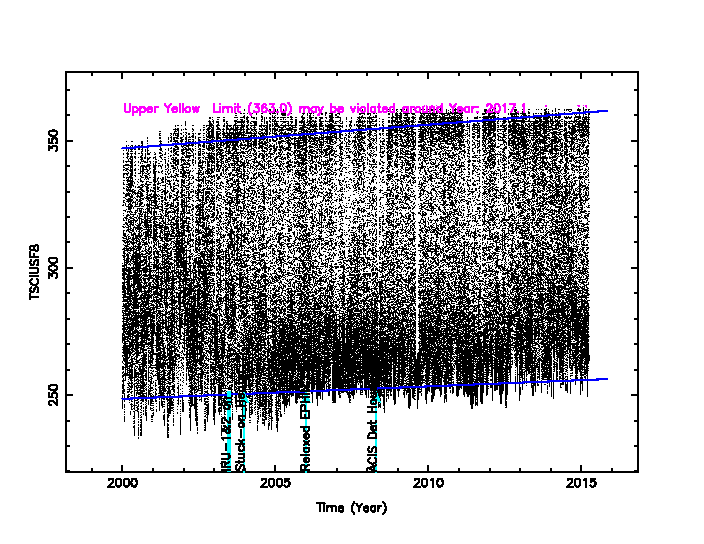
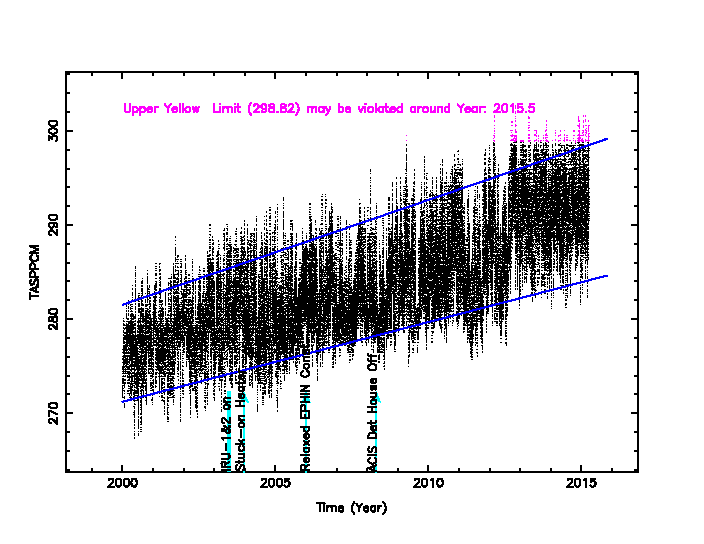
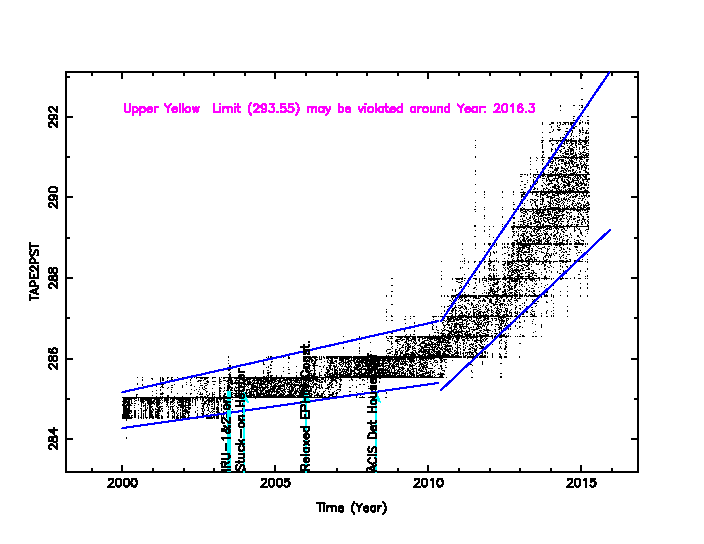
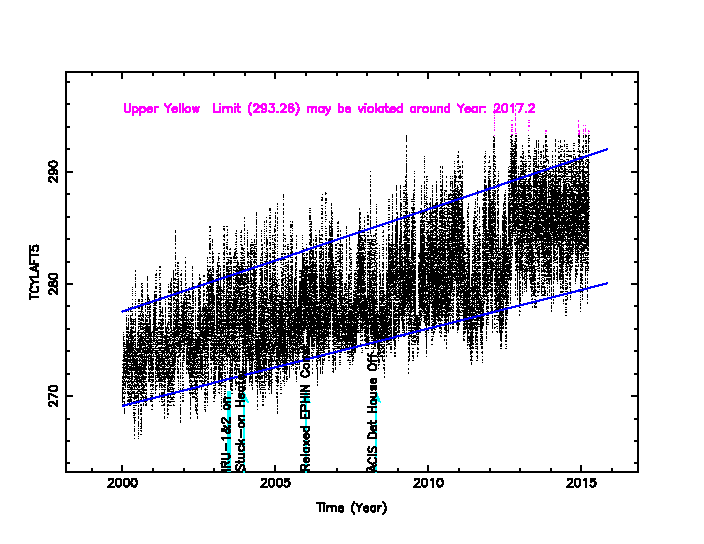
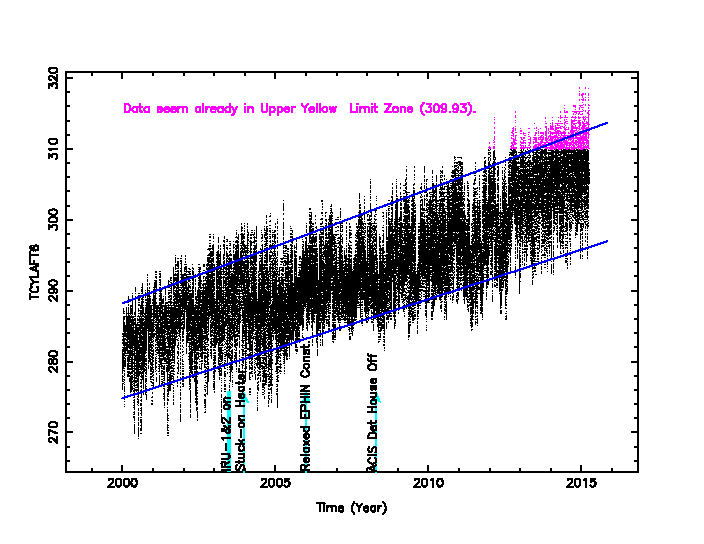
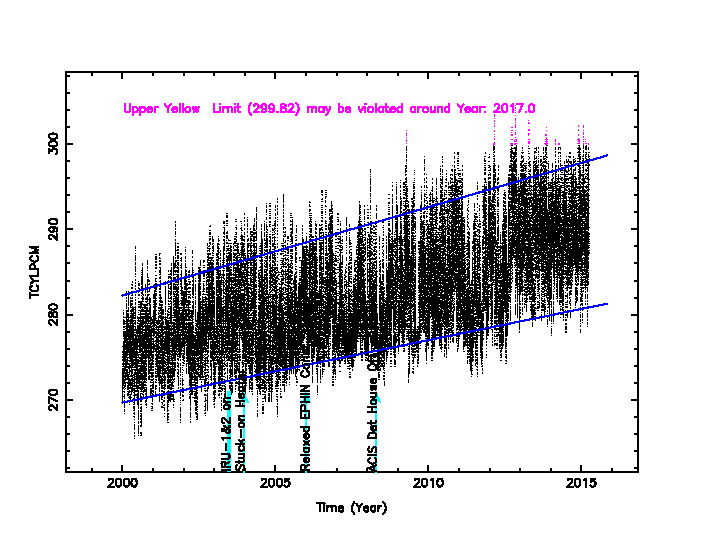
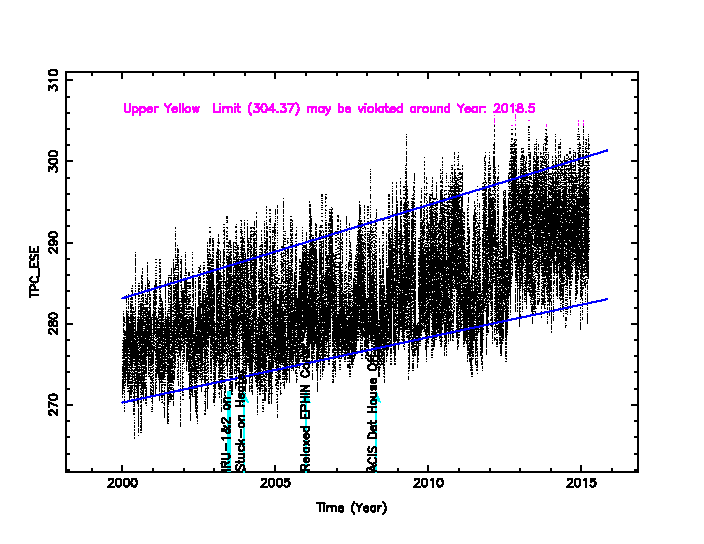
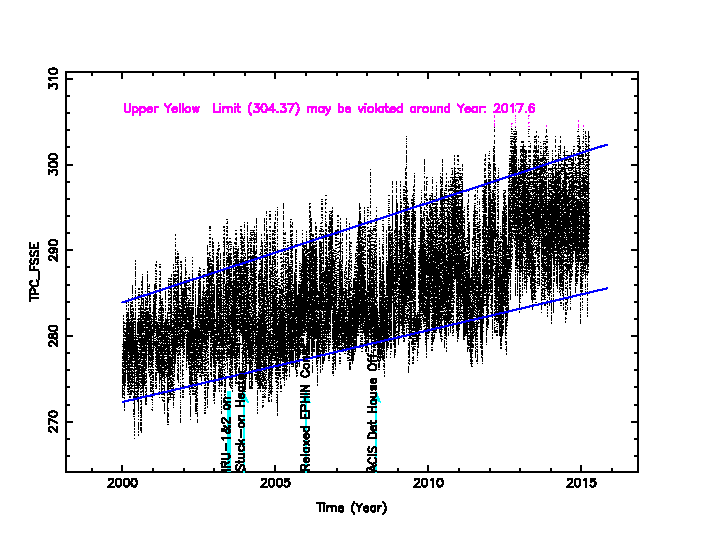
Critical Trends
| ACIS Temperatures - Daily Maximums | ||||||
|---|---|---|---|---|---|---|
| MSID | MEAN | RMS | DELTA/YR | DELTA/YR/YR | UNITS | DESCRIPTION |
| 1PDEAAT | 304.93 | 8.85 | -8.949e-02 | 2.933e+00 | K | PSMC DEA PS A TEMP |
| 1PIN1AT | 291.68 | 7.95 | 6.498e-02 | 2.456e+00 | K | PSMC TEMP 1A |
)
)
| HRMA Computed Averages - Daily Maximums | ||||||
|---|---|---|---|---|---|---|
| MSID | MEAN | RMS | DELTA/YR | DELTA/YR/YR | UNITS | DESCRIPTION |
| OBAAVG | 291.23 | 2.04 | -1.418e+00 | 3.173e+01 | TEMP | OBA/TFTE |
)
| EPHIN Temperatures - Daily Maximums | ||||||
|---|---|---|---|---|---|---|
| MSID | MEAN | RMS | DELTA/YR | DELTA/YR/YR | UNITS | DESCRIPTION |
| TEIO | 329.07 | 20.66 | 5.748e+00 | 8.023e+00 | K | EPHIN ELECTRONICS HOUSING TEMP |
| TEPHIN | 334.24 | 6.53 | 1.448e+00 | -1.832e+01 | K | EPHIN SENSOR HOUSING TEMP |
)
)
| S/C Main Temperatures - Daily Maximums | ||||||
|---|---|---|---|---|---|---|
| MSID | MEAN | RMS | DELTA/YR | DELTA/YR/YR | UNITS | DESCRIPTION |
| TCYLFMZM | 306.68 | 25.84 | 2.278e+00 | 1.837e+00 | K | CNT CYL TEMP:-Z SIDE UNDER LAE-1 |
| TCYLFMZP | 308.78 | 24.70 | 2.224e+00 | 1.640e+00 | K | CNT CYL TEMP:-Z SIDE UNDER LAE-2 |
)
)
| S/C Ancillary Temperatures - Daily Maximums | ||||||
|---|---|---|---|---|---|---|
| MSID | MEAN | RMS | DELTA/YR | DELTA/YR/YR | UNITS | DESCRIPTION |
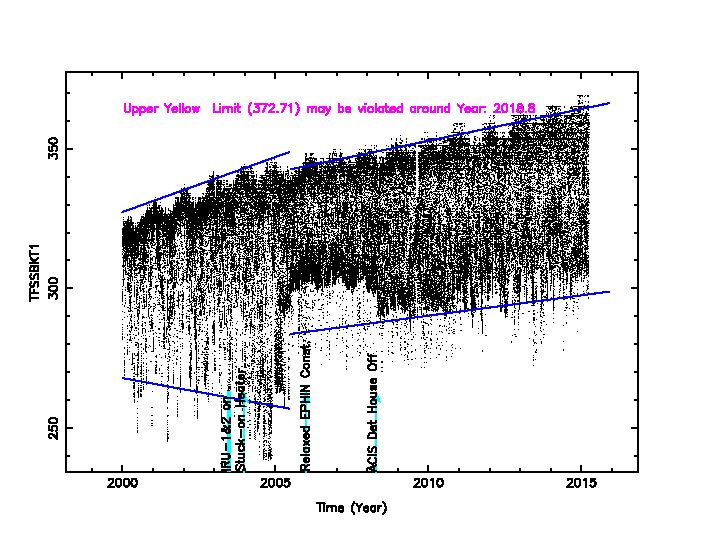
| TFSSBKT1 | 344.39 | 17.59 | 4.051e+00 | 6.934e+01 | K | FSS BRACKET-1 TEMP (+Y) |
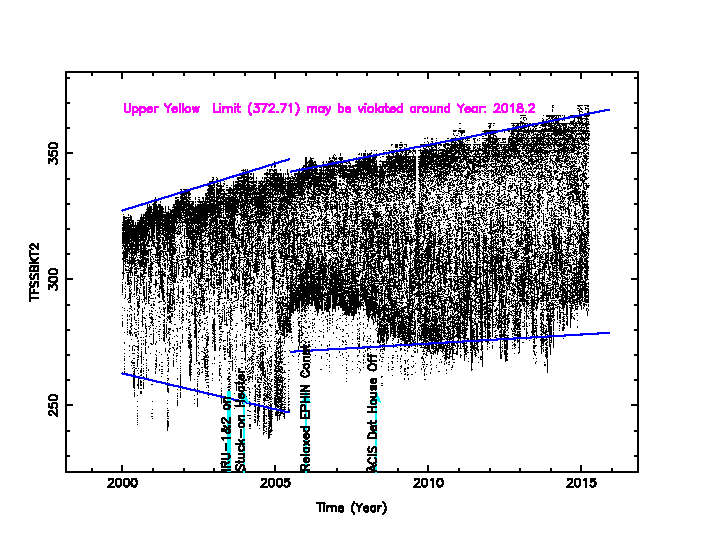
| TFSSBKT2 | 339.04 | 24.69 | 7.394e+00 | 9.523e+01 | K | FSS BRACKET-2 TEMP (+Y) |
| TSCTSF1 | 303.07 | 3.48 | 1.836e+00 | 2.616e+00 | K | SC-TS FITTING -1 TEMP |
| TSCTSF6 | 305.09 | 3.92 | 2.119e+00 | 3.996e+00 | K | SC-TS FITTING -6 TEMP |
)
)
)
)
| MUPS - Daily Maximums | ||||||
|---|---|---|---|---|---|---|
| MSID | MEAN | RMS | DELTA/YR | DELTA/YR/YR | UNITS | DESCRIPTION |
| PM1THV1T | 333.47 | 8.23 | -2.762e-01 | -1.892e+02 | K | MUPS 1 THRUSTER VALVE 01 TEMP |
| PLINE02T | 317.64 | 11.13 | 3.347e+00 | 5.826e+00 | K | PROP LINE TEMP 02 |
| PLINE03T | 316.64 | 13.64 | 3.278e+00 | 7.846e+00 | K | PROP LINE TEMP 03 |
| PLINE04T | 302.24 | 12.73 | 3.233e+00 | 7.055e+00 | K | PROP LINE TEMP 04 |
)
)
)
)
Quarterly Trends
- HRMA Thermal
| Previous Quarter | ||||||
| MSID | MEAN | RMS | DELTA/YR | DELTA/YR/YR | UNITS | DESCRIPTION |
| 4RT568T | 292.83 | 1.02 | 3.004e-01 | 2.413e+01 | K | RT 568 - HRMA TEMP |
| 4RT575T | 295.90 | 1.37 | -1.234e-01 | 3.626e+00 | K | RT 575 - OB CONE TEMP |
| 4RT577T | 296.85 | 2.60 | 1.278e+00 | 8.666e+01 | K | RT 577 - OB CONE TEMP |
| 4RT578T | 294.28 | 2.28 | 1.467e+00 | 9.279e+01 | K | RT 578 - OB CONE TEMP |
| 4RT579T | 289.99 | 2.43 | 1.957e+00 | 1.503e+02 | K | RT 579 - OB CONE TEMP |
)
)
)
)
)
- HRMA Struts
| Previous Quarter | ||||||
| MSID | MEAN | RMS | DELTA/YR | DELTA/YR/YR | UNITS | DESCRIPTION |
| 4RT584T | 295.05 | 0.80 | -4.073e-01 | -9.957e+00 | K | RT 584 - STRUT TEMP |
| 4RT585T | 295.13 | 0.79 | -5.883e-01 | -9.535e-01 | K | RT 585 - STRUT TEMP |
| 4RT586T | 292.25 | 0.66 | -5.397e-01 | 6.670e+00 | K | RT 586 - STRUT TEMP |
| 4RT596T | 287.65 | 0.78 | -6.491e-02 | 1.921e+01 | K | RT 596 - TFTE TEMP |
| 4RT597T | 298.29 | 1.86 | -6.523e-01 | -3.413e+01 | K | RT 597 - TFTE TEMP |
| 4RT598T | 297.62 | 1.79 | -7.401e-01 | -1.982e+01 | K | RT 598 - TFTE TEMP |
)
)
)
)
)
)
- OB Foward Bullkhead
| Previous Quarter | ||||||
| MSID | MEAN | RMS | DELTA/YR | DELTA/YR/YR | UNITS | DESCRIPTION |
| 4RT701T | 294.12 | 1.22 | -6.721e-02 | 2.905e+00 | K | RT 701 - OB BULKHEAD TEMP |
| 4RT706T | 284.98 | 0.98 | 8.558e-02 | 2.195e+01 | K | RT 706 - OB BULKHEAD TEMP |
| 4RT710T | 294.06 | 1.24 | -2.985e-01 | 1.201e+01 | K | RT 710 - OB BULKHEAD TEMP |
)
)
)
Envelope Trending
Spacecraft Anc Temperature
Spacecraft Main Temperature
Spacecraft Motions
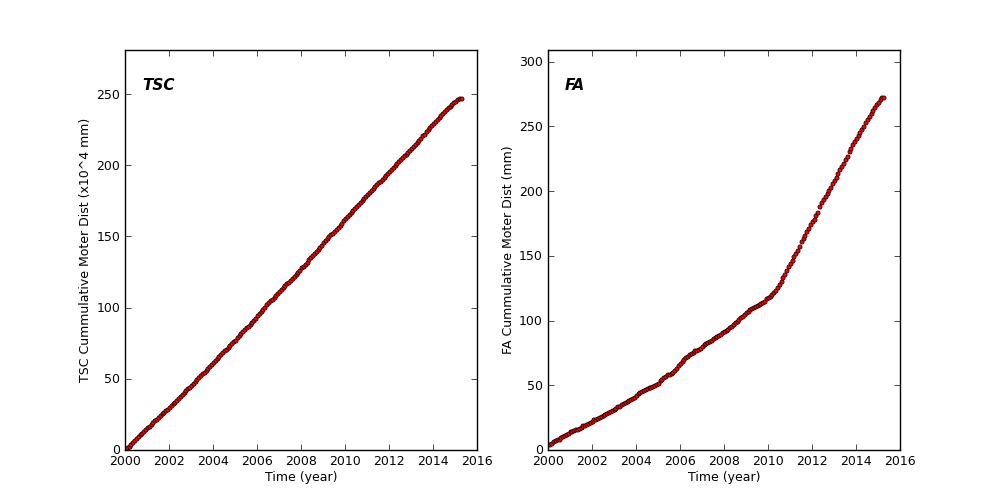
TSC and FA Cummulative Moter Distance
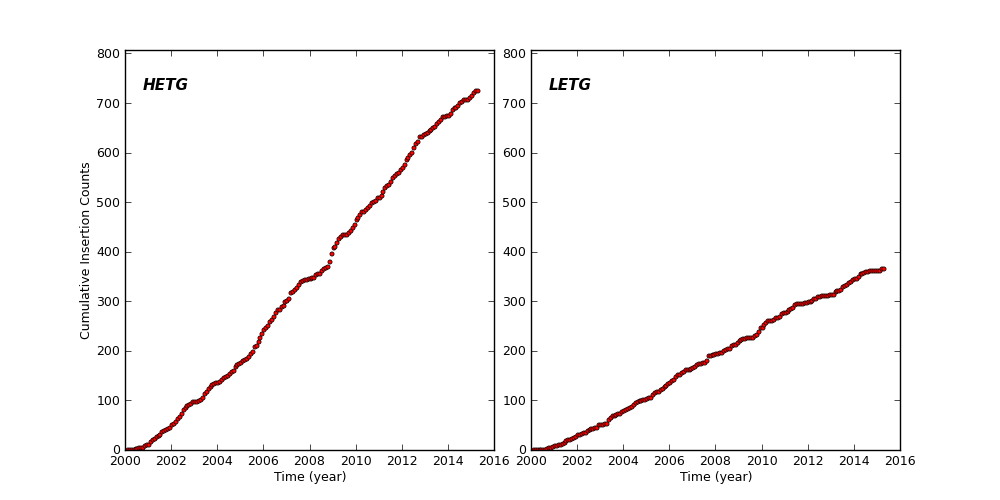
HETG and LETG Cummulative Insertion Counts
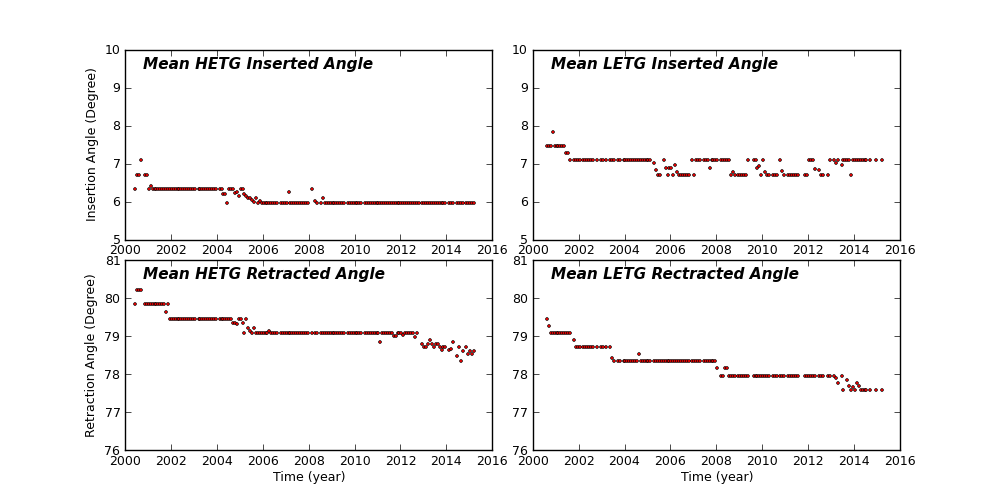
HETG/LETG Insertion/Retraction Angle
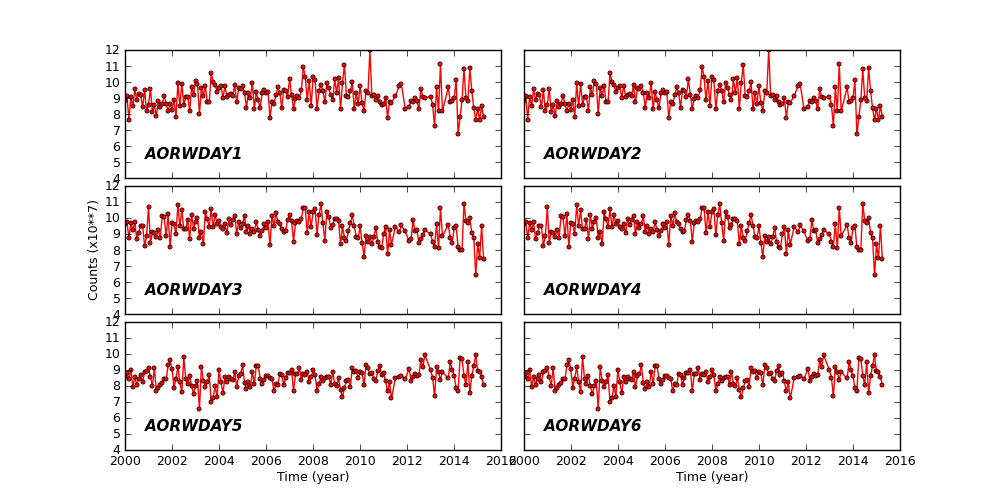
Reaction Wheel Rotations
Links to Past Monthly Reports
| Year | Month | |||||||||||
|---|---|---|---|---|---|---|---|---|---|---|---|---|
| 2015 | Jan | Feb | ||||||||||
| 2014 | Jan | Feb | Mar | Apr | May | Jun | Jul | Aug | Sep | Oct | Nov | Dec |
| 2013 | Jan | Feb | Mar | Apr | May | Jun | Jul | Aug | Sep | Oct | Nov | Dec |
| 2012 | Jan | Feb | Mar | Apr | May | Jun | Jul | Aug | Sep | Oct | Nov | Dec |
| 2011 | Jan | Feb | Mar | Apr | May | Jun | Jul | Aug | Sep | Oct | Nov | Dec |
| 2010 | Jan | Feb | Mar | Apr | May | Jun | Jul | Aug | Sep | Oct | Nov | Dec |
| 2009 | Jan | Feb | Mar | Apr | May | Jun | Jul | Aug | Sep | Oct | Nov | Dec |
| 2008 | Jan | Feb | Mar | Apr | May | Jun | Jul | Aug | Sep | Oct | Nov | Dec |
| 2007 | Jan | Feb | Mar | Apr | May | Jun | Jul | Aug | Sep | Oct | Nov | Dec |
| 2006 | Jan | Feb | Mar | Apr | May | Jun | Jul | Aug | Sep | Oct | Nov | Dec |
| 2005 | Jan | Feb | Mar | Apr | May | Jun | Jul | Aug | Sep | Oct | Nov | Dec |
| 2004 | Jan | Feb | Mar | Apr | May | Jun | Jul | Aug | Sep | Oct | Nov | Dec |
| 2003 | Jan | Feb | Mar | Apr | May | Jun | Jul | Aug | Sep | Oct | Nov | Dec |
| 2002 | Jan | Feb | Mar | Apr | May | Jun | Jul | Aug | Sep | Oct | Nov | Dec |
| 2001 | Jan | Feb | Mar | Apr | May | Jun | Jul | Aug | Sep | Oct | Nov | Dec |
| 2000 | Jan | Feb | Mar | Apr | May | Jun | Jul | Aug | Sep | Oct | Nov | Dec |
| 1999 | Jul | Aug | Sep | Oct | Nov | Dec | ||||||