ACIS
ACIS DOSE Registered-Photon-Map
The steps we took to compute the dose map are;
- Level 1 Event files for a specified month are obtained from archive.
- Image data including I2, I3, S2, S3 CCDs are extracted from all event files.
- All the extracted image data were merged to create a month long exposure map for the month.
- The exposure map is opened with ds9, and check a distribution of count rates against energy. From this, estimate the upper threshold value. Any events beyond this upper threshold are assumed erroneous events such as bad pixels.
- Using this upper threshold, the data is filtered, and create a cleaned exposure map for the month.
- The exposure map from each month from the Sep 1999 is added up to create a cumulative exposure map for each month.
- Using fimgstatistic, we compute count rate statistics for each CCDs.
- For observations with high data drop rates (e.g., Crab nebula, Cas A), we corrected the observations by adding events.
Please check more detail plots at Telemetered Photon Dose Trend page.
)
)
)
Statistics:
# IMAGE     NPIX     MEAN        RMS        MIN     MAX
ACIS_jun15 6004901   11.694      17.051     0.0     6797


I2 node 0  262654   7.672448     3.411970   0.0    62.0
I2 node 1  262654   8.117188     4.019061   0.0   389.0
I2 node 2  262654   8.128772     3.549743   0.0    70.0
I2 node 3  262654   8.136598    15.577448   0.0  6797.0

I3 node 0  262654   9.538285     4.143460   0.0    91.0
I3 node 1  262654   10.529587   12.877622   0.0  4527.0
I3 node 2  262654   8.693283     3.554114   0.0    95.0
I3 node 3  262654   8.772677     3.684346   0.0   141.0

S2 node 0  262654   12.466954   15.064991   0.0  3361.0
S2 node 1  262654   14.849926    8.360119   0.0    76.0
S2 node 2  262654   21.434509   19.647658   0.0  6586.0
S2 node 3  262654   26.762085   19.142629   0.0   429.0

S3 node 0  262654   22.992157   21.741904   0.0   181.0
S3 node 1  262654   25.728369   16.513481   0.0   146.0
S3 node 2  262654   27.731216   18.357524   1.0   100.0
S3 node 3  262654   21.165632   13.250624   0.0   214.0
)
)
)
Statistics:
 IMAGE     NPIX      MEAN        RMS          MIN      MAX
ACIS_total 6004901   1904.866    2491.219     0.0     109358


I2 node 0  262654   1596.161597  306.293246   302.0    9132.0
I2 node 1  262654   1683.430152  424.554758   332.0   40531.0
I2 node 2  262654   1717.248525  362.450312   331.0    9253.0
I2 node 3  262654   1714.775351  434.057910   316.0   28082.0

I3 node 0  262654   1803.099661  431.856768   314.0    7041.0
I3 node 1  262654   1893.581622 1430.636499   321.0   36046.0
I3 node 2  262654   1650.547972  297.842435   304.0    8575.0
I3 node 3  262654   1635.598161  317.448175   286.0   27608.0

S2 node 0  262654   2221.531464  321.516297  1185.0   21253.0
S2 node 1  262654   2365.559621  517.376865  1241.0   13046.0
S2 node 2  262654   2616.843183  501.777557  1603.0   19839.0
S2 node 3  262654   2552.225600  366.559264  1526.0   43470.0

S3 node 0  262654   3954.126095 1815.423175  1642.0   13656.0
S3 node 1  262654   5183.461765 2122.216726     0.0   14126.0
S3 node 2  262654   3974.425092 1038.143884  1608.0    9621.0
S3 node 3  262654   3051.983178  474.693913  1750.0   10463.0
)
|
)
|
)
|
)
|
| Mar 2015 | Dec 2014 | Sep 2014 | Jun 2014 |
|---|
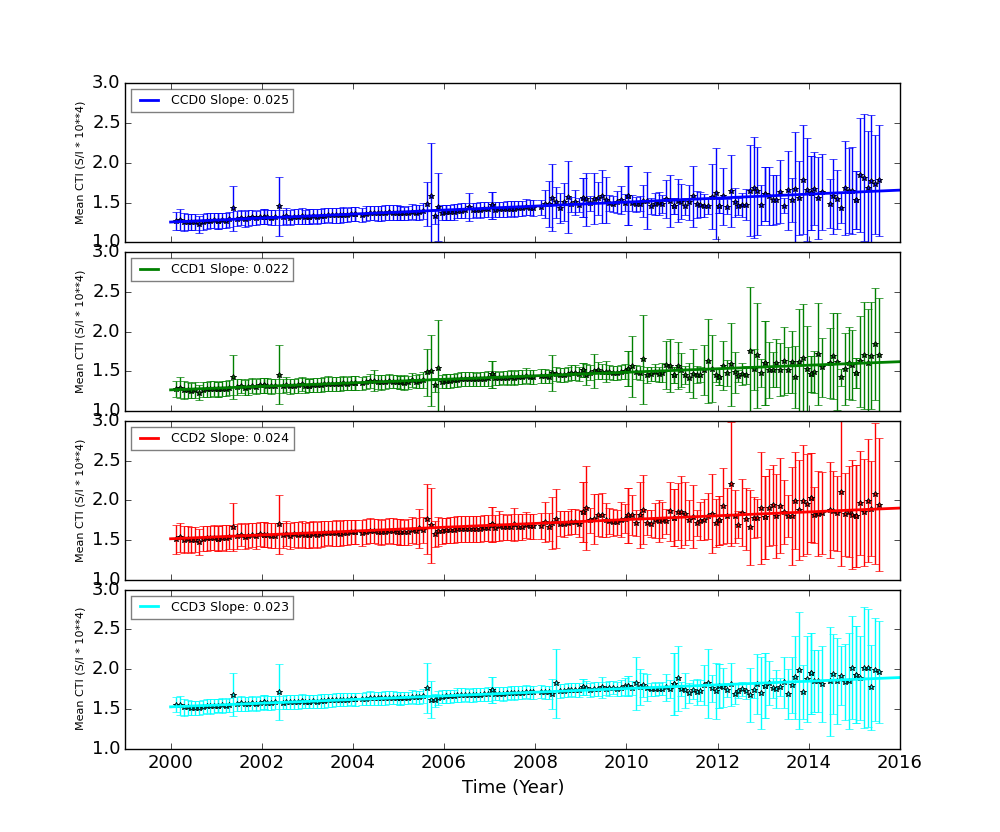
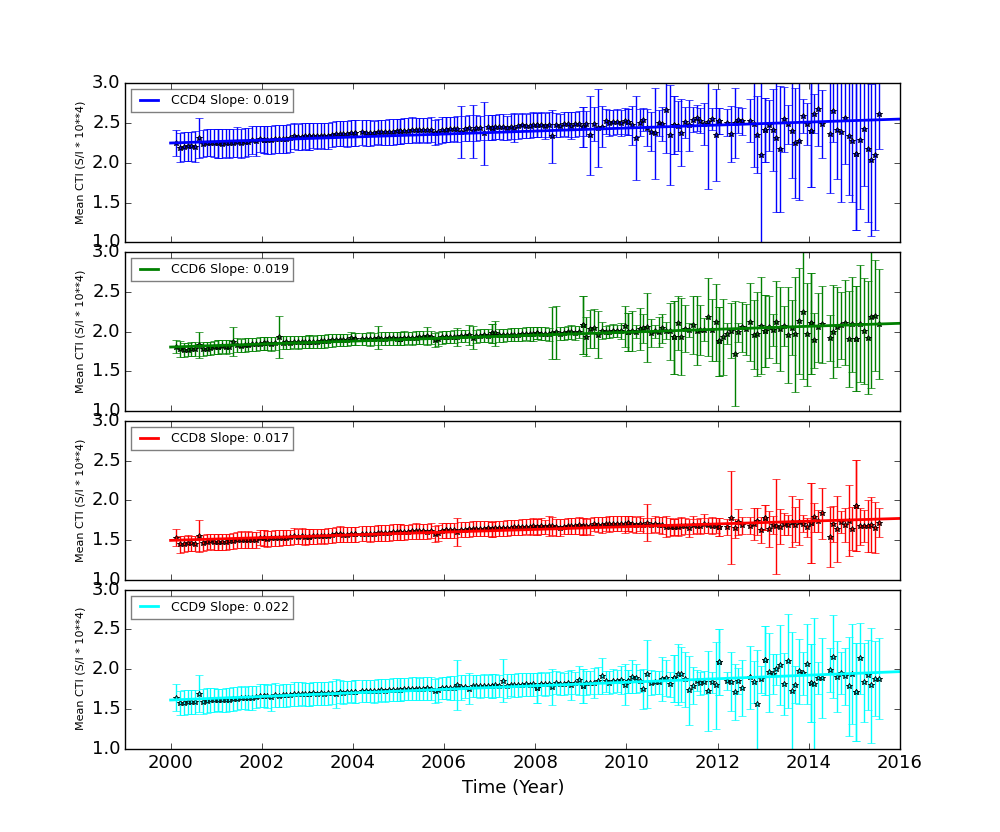
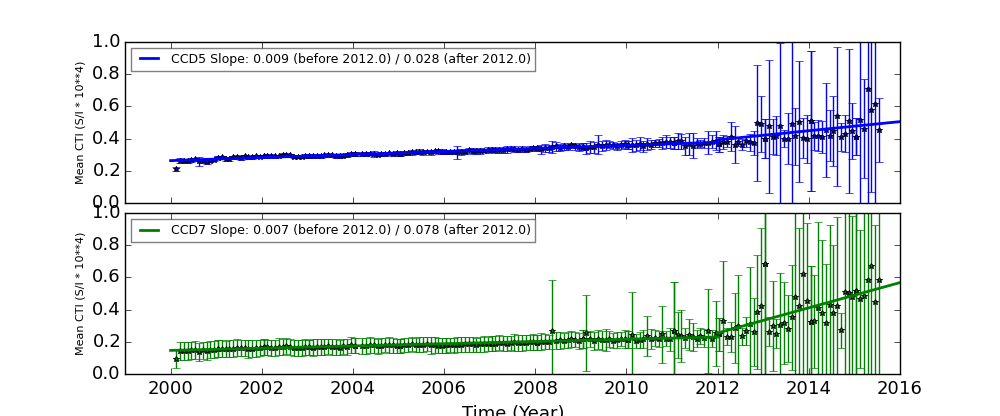
The Mean Detrended CTI
We report CTIs with a refined data definition. CTIs were computed for the temperature dependency corrected data. Please see CTI page for detailed explanation. CTI's are computed for Mn K alpha, and defined as slope/intercept x10^4 of row # vs ADU. Data file: here
Imaging CCDs
Spectral CCDs
Backside CCDs
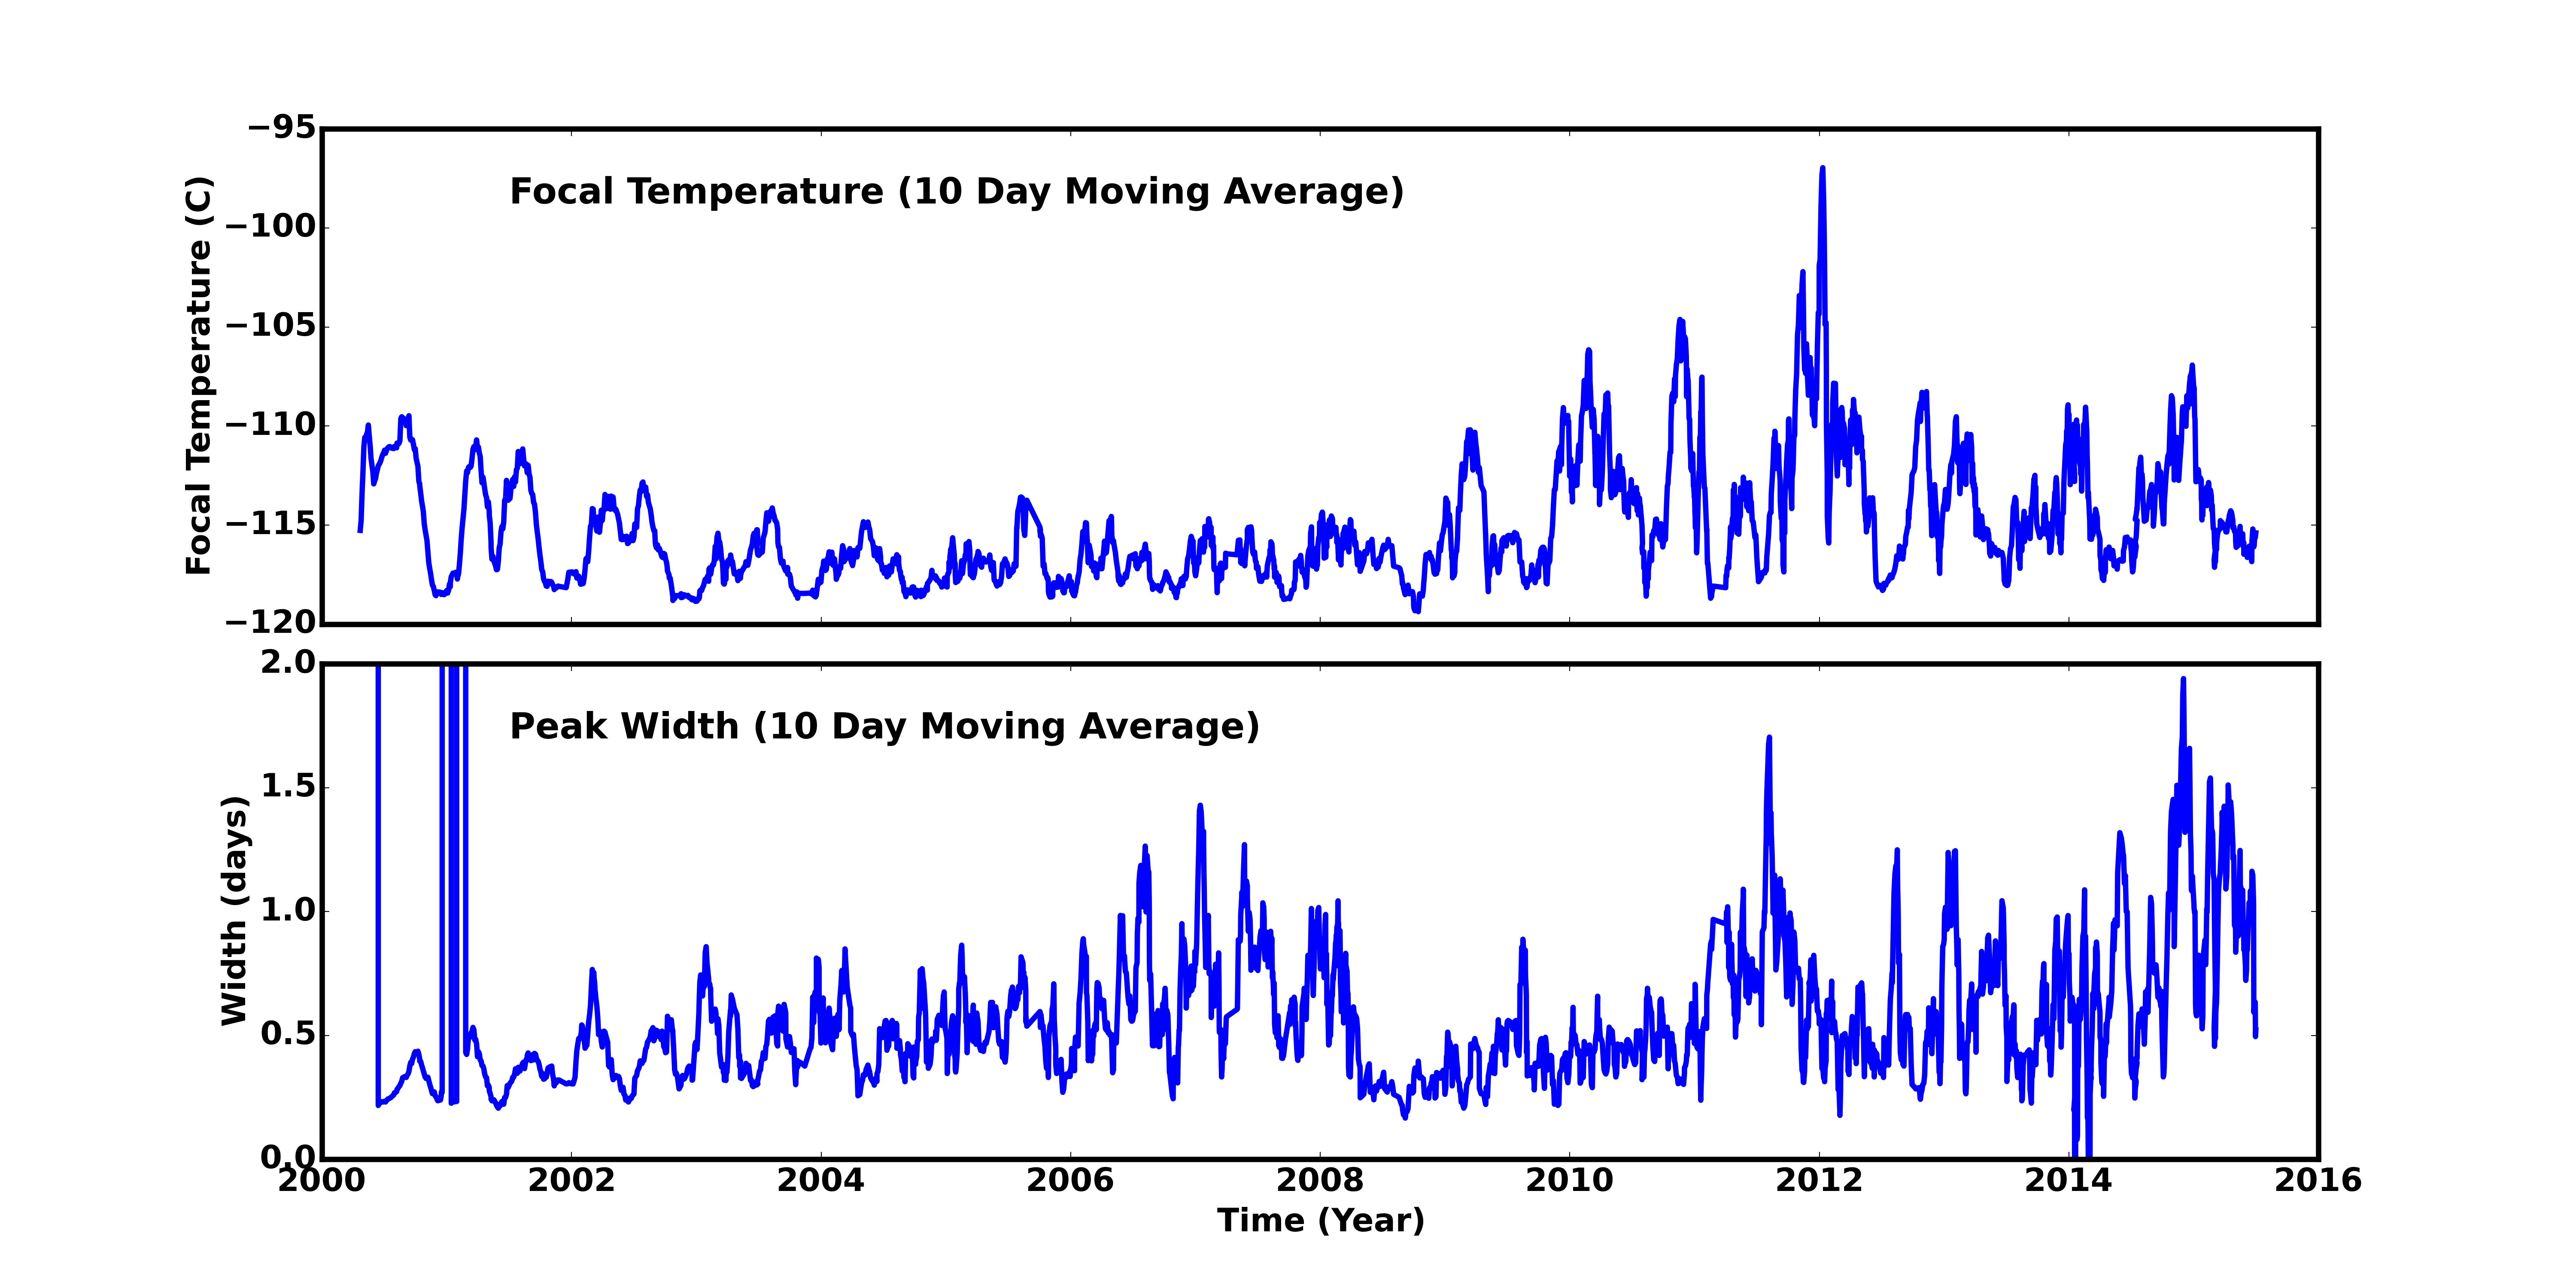
Focal Plane Temperature
Jun 2015 Focal Temperature
| The Mean (max) FPT: | |
|---|---|
| -116.16 | +/- 2.74 C |
| Mean Width: | |
| 0.77 | +/- 0.67 days |
Averaged Focal Plane Temperature
We are using 10 period moving averages to show trends of peak temperatures and peak widths. Note, the gaps in the width plot are due to missing/corrupted data.
Focal Plane Temperature, Sun Angle and Altitude
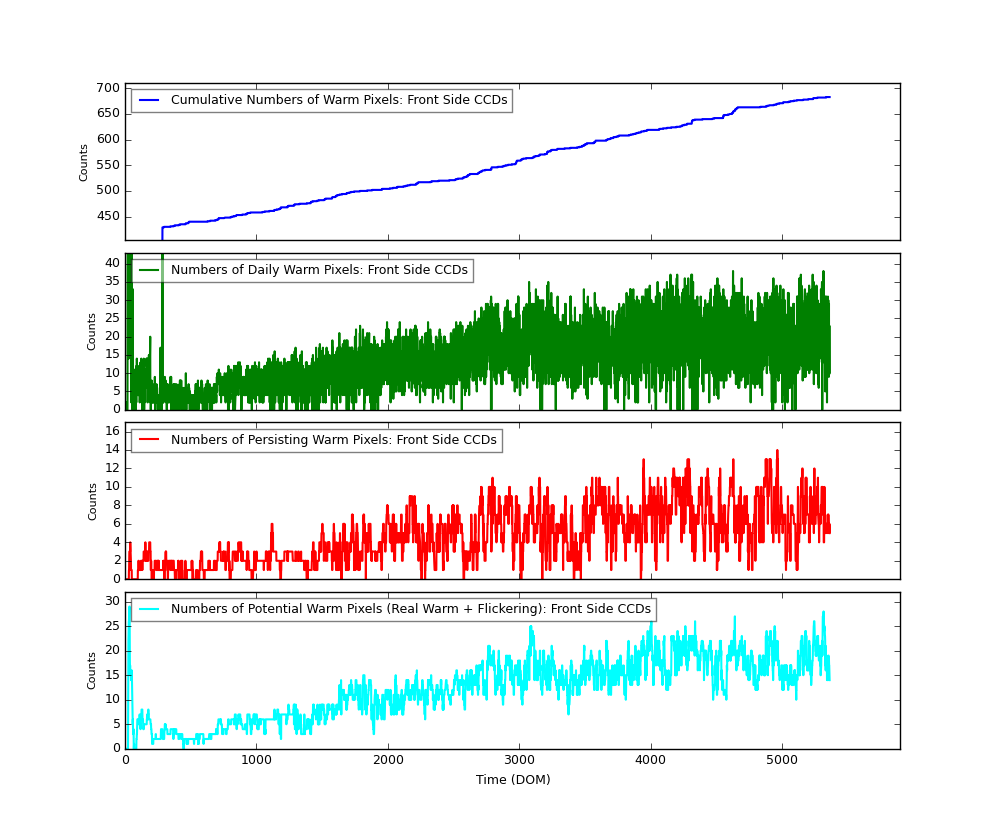
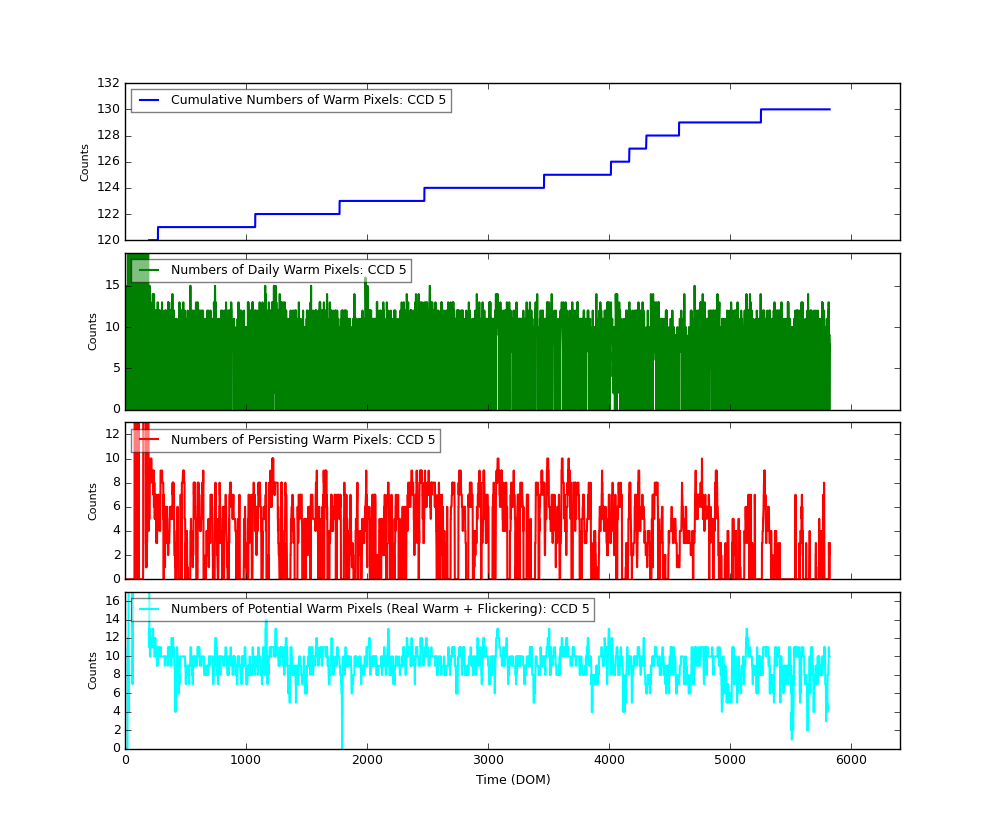
Bad Pixels
The plots below were generated with a new warm pixel finding script. Please see Acis Bad Pixel Page for details.
Front Side CCDs
Back Side CCD (CCD5)
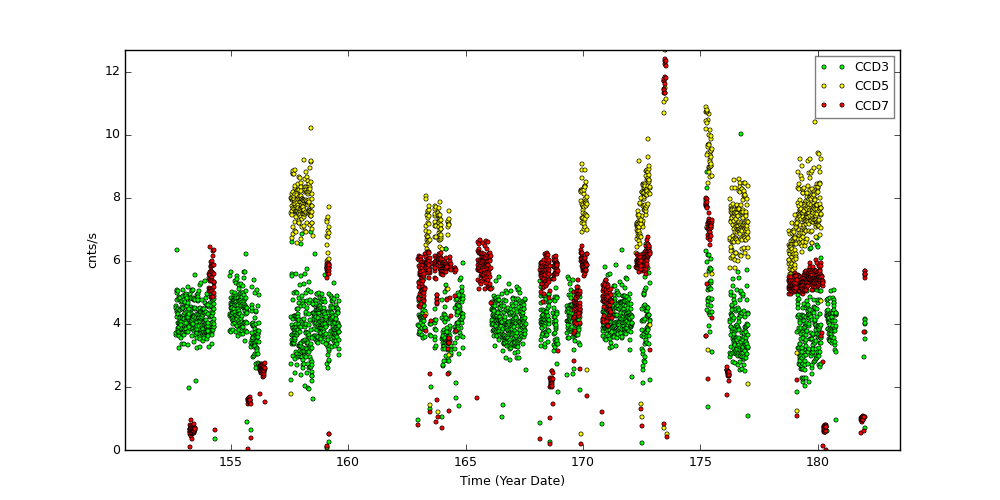
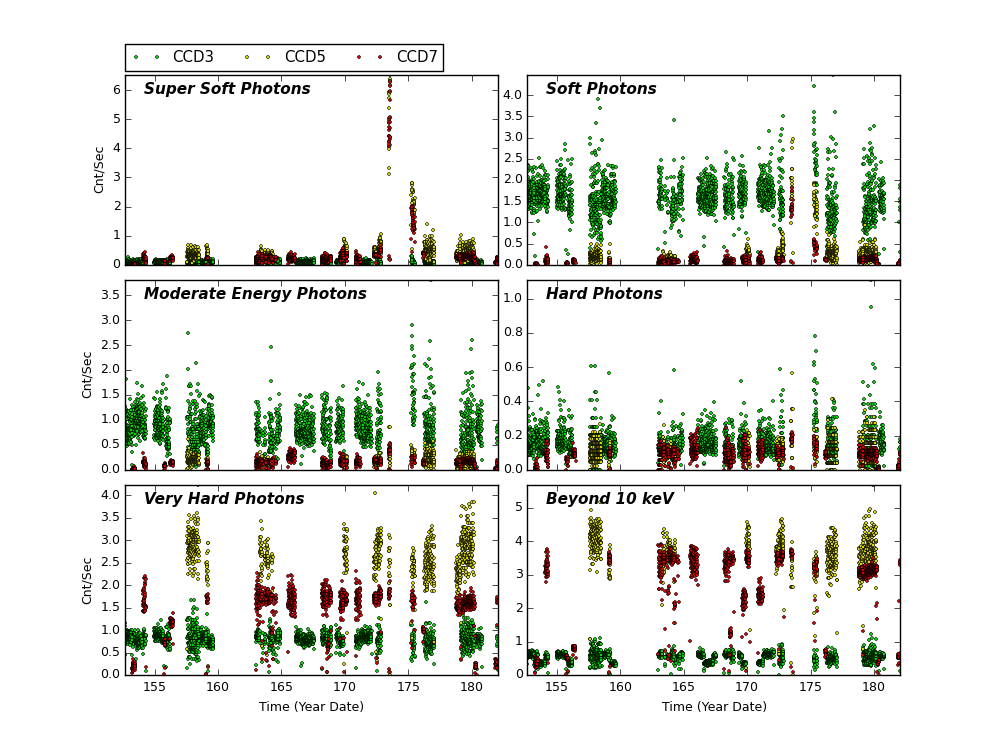
Science Instrument Background Rates
| Name | Low (keV) | High(KeV) | Description |
|---|---|---|---|
| SSoft | 0.00 | 0.50 | Super soft photons |
| Soft | 0.50 | 1.00 | Soft photons |
| Med | 1.00 | 3.00 | Moderate energy photons |
| Hard | 3.00 | 5.00 | Hard Photons |
| Harder | 5.00 | 10.00 | Very Hard photons |
| Hardest | 10.00 | Beyond 10 keV |
HRC
DOSE of Central 4K Pore-Pairs
Please refer to Maximum Dose Trends for more details.
No Data
)
        IMAGE                NPIX      MEAN    STDDEV      MIN       MAX
HRCI_08_1999_06_2015.fits  16777216   4.326    4.917       0.0       292.0
No Data
)
        IMAGE                NPIX     MEAN      STDDEV      MIN      MAX
HRCS_08_1999_06_2015.fits  16777216  15.700     27.718      0.0      1684.0
|
|
Max dose trend plots corrected for events that "pile-up"
in the center of the taps due to bad position information.
|
)
|
)
|
)
|
)
|
| Mar 2015 | Dec 2014 | Sep 2014 | Jun 2014 |
|---|
)
|
)
|
)
|
)
|
| Mar 2015 | Dec 2014 | Sep 2014 | Jun 2014 |
|---|
Gratings
Focus
We plot the width of the zero order streak of ACIS/HETG observations and the width of the zero order image for HRC/LETG observations of point sources. No significant defocusing trend is seen at this time. See Gratings Focus pages.
PCAD
ACA Trending
Fid Light Drift
Fid light positions on ACA drift with time. The drift trends of Fid light 2 with ACIS-I and ACIS-S configurations are shown below.
The top panel shows Fid light 2 drift in ACENT I (app. along with -Y axis), and the
bottom panel shows that in ACENT J (app. along with Z axis). The unit is a pixel, and
one pixel is approximately 0.5 arcsec. The slope listed at the top right corner is
the change in a position per year (arcsec/yr). The vertical line on DOM = 1411 (Jun 1, 2003)
indicates a transition date of use of IRU-1 to IRU-2.
See also Tom Aldcroft's updated page:
https://cxc.cfa.harvard.edu/mta/ASPECT/fid_drift
Fid 2 (ACIS-I)
Fid 2 (ACIS-S)
Fid 8 (HRC-I)
Fid 12 (HRC-S)
Gyro Bias Drift
Radiation History
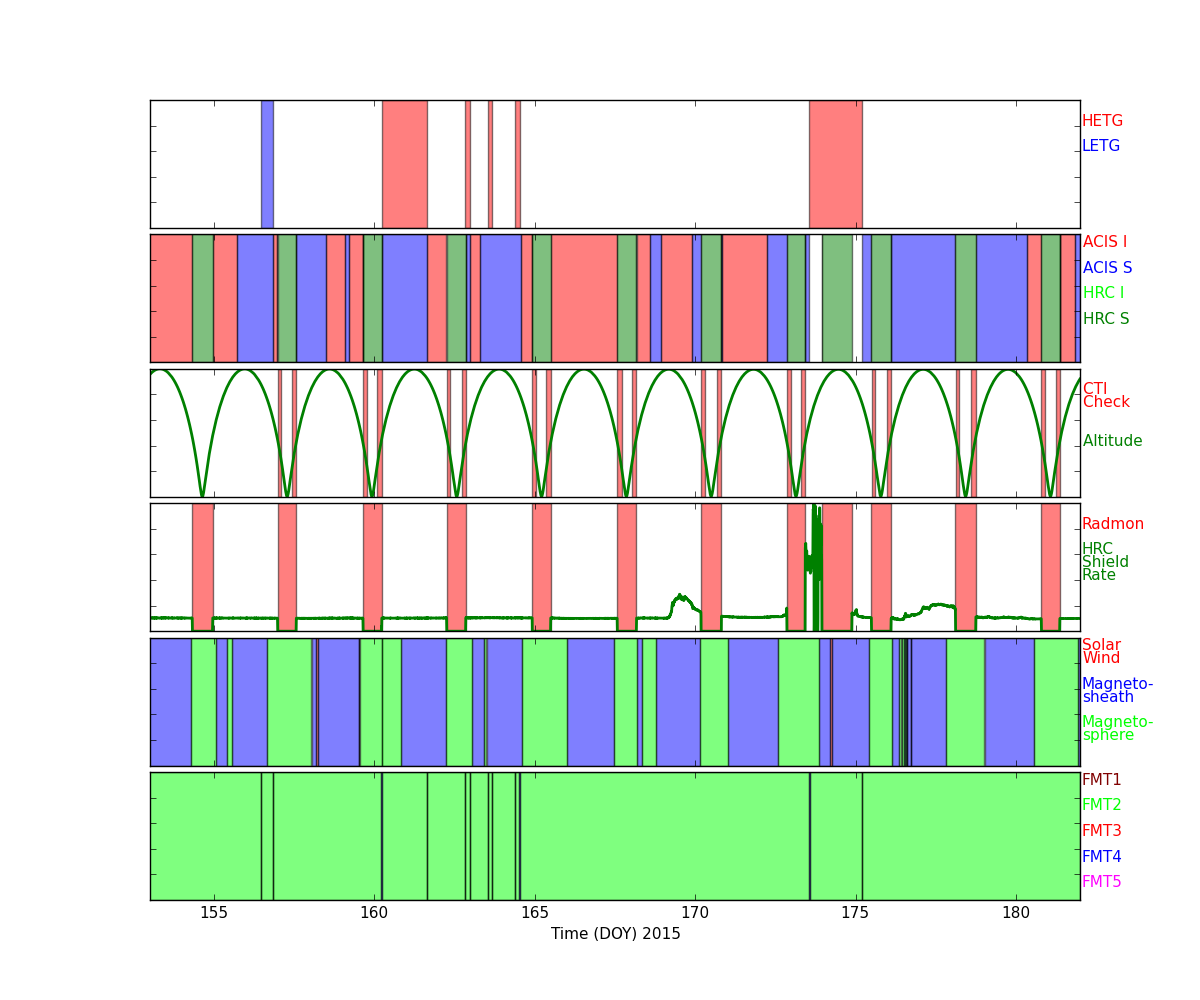
Radiation Zone Timing
Plotted below are radiation zone timing plots based on the following definitions of radiation zone:
- RADZONE - Ephin levels (in any of the E1300,P4GM,P41GM channels) are more than 1/3 of RADMON safing thresholds.
- RADMON - Radmon is disabled for radiation zone (as commanded based on OFLS model, for comparison with actual radiation levels).
- PERIGEE - Time of closest earth approach (for comparison)
Radiation Count Rates of Jun 2015
Sun Spot History
Trending
Critical Trends
| ACIS Temperatures - Daily Maximums | ||||||
|---|---|---|---|---|---|---|
| MSID | MEAN | RMS | DELTA/YR | DELTA/YR/YR | UNITS | DESCRIPTION |
| 1PDEAAT | 304.90 | 8.72 | -3.344e-01 | 5.512e-01 | K | PSMC DEA PS A TEMP |
| 1PIN1AT | 291.73 | 7.81 | -1.061e-01 | 1.163e-02 | K | PSMC TEMP 1A |
)
)
| HRMA Computed Averages - Daily Maximums | ||||||
|---|---|---|---|---|---|---|
| MSID | MEAN | RMS | DELTA/YR | DELTA/YR/YR | UNITS | DESCRIPTION |
| OBAAVG | 291.27 | 1.94 | -3.252e-01 | 6.943e+00 | TEMP | OBA/TFTE |
)
| EPHIN Temperatures - Daily Maximums | ||||||
|---|---|---|---|---|---|---|
| MSID | MEAN | RMS | DELTA/YR | DELTA/YR/YR | UNITS | DESCRIPTION |
| TEIO | 328.99 | 20.79 | 5.543e+00 | 6.611e+00 | K | EPHIN ELECTRONICS HOUSING TEMP |
| TEPHIN | 334.26 | 6.58 | 1.059e+00 | 5.900e+00 | K | EPHIN SENSOR HOUSING TEMP |
)
)
| S/C Main Temperatures - Daily Maximums | ||||||
|---|---|---|---|---|---|---|
| MSID | MEAN | RMS | DELTA/YR | DELTA/YR/YR | UNITS | DESCRIPTION |
| TCYLFMZM | 307.64 | 26.11 | 2.221e+00 | 1.135e+00 | K | CNT CYL TEMP:-Z SIDE UNDER LAE-1 |
| TCYLFMZP | 309.66 | 24.94 | 2.212e+00 | 6.079e-01 | K | CNT CYL TEMP:-Z SIDE UNDER LAE-2 |
)
)
| S/C Ancillary Temperatures - Daily Maximums | ||||||
|---|---|---|---|---|---|---|
| MSID | MEAN | RMS | DELTA/YR | DELTA/YR/YR | UNITS | DESCRIPTION |
| TFSSBKT1 | 343.31 | 19.14 | 9.356e-02 | 1.758e+01 | K | FSS BRACKET-1 TEMP (+Y) |
| TFSSBKT2 | 338.65 | 25.65 | 4.050e+00 | -7.843e+00 | K | FSS BRACKET-2 TEMP (+Y) |
| TSCTSF1 | 303.03 | 3.42 | 1.671e+00 | -8.560e-01 | K | SC-TS FITTING -1 TEMP |
| TSCTSF6 | 305.17 | 3.87 | 2.099e+00 | -5.975e-01 | K | SC-TS FITTING -6 TEMP |
)
)
)
)
| MUPS - Daily Maximums | ||||||
|---|---|---|---|---|---|---|
| MSID | MEAN | RMS | DELTA/YR | DELTA/YR/YR | UNITS | DESCRIPTION |
| PM1THV1T | 333.47 | 8.23 | -2.762e-01 | -1.892e+02 | K | MUPS 1 THRUSTER VALVE 01 TEMP |
| PLINE02T | 317.64 | 11.13 | 3.347e+00 | 5.826e+00 | K | PROP LINE TEMP 02 |
| PLINE03T | 316.64 | 13.64 | 3.278e+00 | 7.846e+00 | K | PROP LINE TEMP 03 |
| PLINE04T | 302.24 | 12.73 | 3.233e+00 | 7.055e+00 | K | PROP LINE TEMP 04 |
)
)
)
)
Quarterly Trends
- EPH Temperature and Voltage
| Previous Quarter | ||||||
| MSID | MEAN | RMS | DELTA/YR | DELTA/YR/YR | UNITS | DESCRIPTION |
| 5EIOT | 353.58 | 18.35 | 2.813e+01 | -8.715e+02 | K | EIO TEMP |
| 5EPHINT | 330.35 | 6.44 | 1.036e+01 | -3.640e+01 | K | EPHIN TEMP |
| HKEBOXTEMP | 335.43 | 6.52 | 1.083e+01 | -6.795e+01 | K | EPHIN HOUSEKEEPING EBOX: TEMPERATURE (5EHSE300) |
| HKP5V | 5.08 | 8.979e-03 | 4.000e-02 | -6.308e-02 | V | HK 5 Volts Rail - Voltage |
| HKP6I | 137.06 | 0.82 | 9.304e-01 | 9.419e+00 | AMP | HK 6 Volts Rail - Current |
| HKP6V | 5.78 | 1.146e-02 | -1.437e-02 | 4.781e-02 | V | HK 6 Volts Rail - Voltage |
| TEIO | 327.43 | 19.92 | 3.176e+01 | -9.460e+02 | K | EPHIN ELECTRONICS HOUSING TEMP |
| TEPHIN | 330.62 | 6.41 | 1.150e+01 | -1.007e+02 | K | EPHIN SENSOR HOUSING TEMP |
)
)
)
)
)
)
)
)
- ACA Thermal
| Previous Quarter | ||||||
| MSID | MEAN | RMS | DELTA/YR | DELTA/YR/YR | UNITS | DESCRIPTION |
| AACBPPT | 305.96 | 1.11 | 5.273e+00 | -3.220e+01 | K | AC BASEPLATE TEMP (PRIME) |
| AACBPRT | 300.83 | 1.11 | 5.307e+00 | -3.249e+01 | K | AC BASEPLATE TEMP (RDNT) |
| AACCCDPT | 257.45 | 1.05 | 4.803e+00 | -2.973e+01 | K | AC CCD TEMP (PRI) |
| AACCCDRT | 300.99 | 1.23 | 5.687e+00 | -3.346e+01 | K | AC CCD TEMP (RDNT) |
| AACH1T | 298.16 | 1.20 | 5.614e+00 | -3.500e+01 | K | AC HOUSING TEMP (ACH1) |
| AACH2T | 298.21 | 1.20 | 5.635e+00 | -3.326e+01 | K | AC HOUSING TEMP (ACH2) |
| AAOTALT | 297.80 | 1.19 | 5.565e+00 | -3.509e+01 | K | AC OPT TEL ASSY LENS TEMP |
| AAOTAPMT | 297.12 | 1.18 | 5.597e+00 | -3.513e+01 | K | AC OPT TEL ASSY PRIMARY MIRROR TEMP |
| AAOTASMT | 297.26 | 1.18 | 5.519e+00 | -4.060e+01 | K | AC OPT TEL ASSY SECONDARY MIRROR TEMP |
| AAOTH2MT | 297.73 | 1.19 | 5.607e+00 | -3.763e+01 | K | AC OPT TEL ASSY SECONDARY MIRROR TEMP (HRMA) |
)
)
)
)
)
)
)
)
)
)
Envelope Trending
EPS Battery
HRMA Heters
Spacecraft Motions
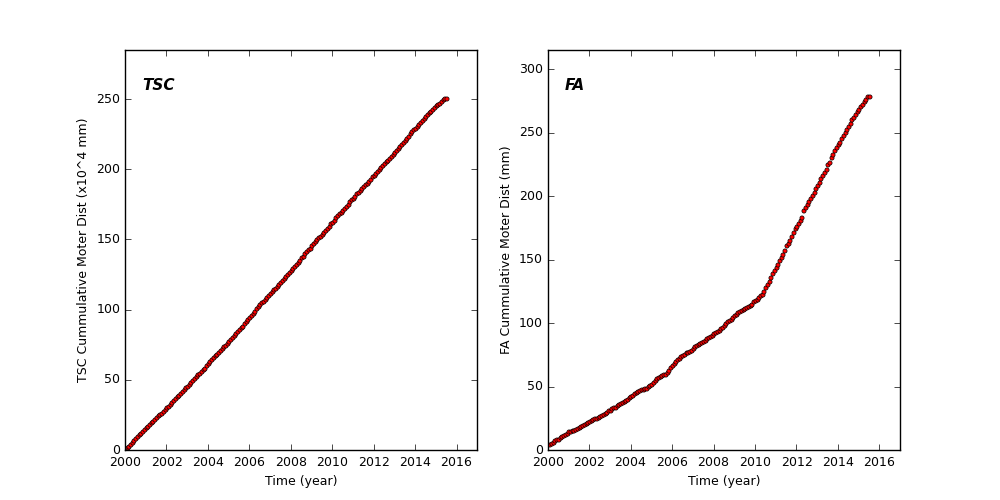
TSC and FA Cummulative Moter Distance
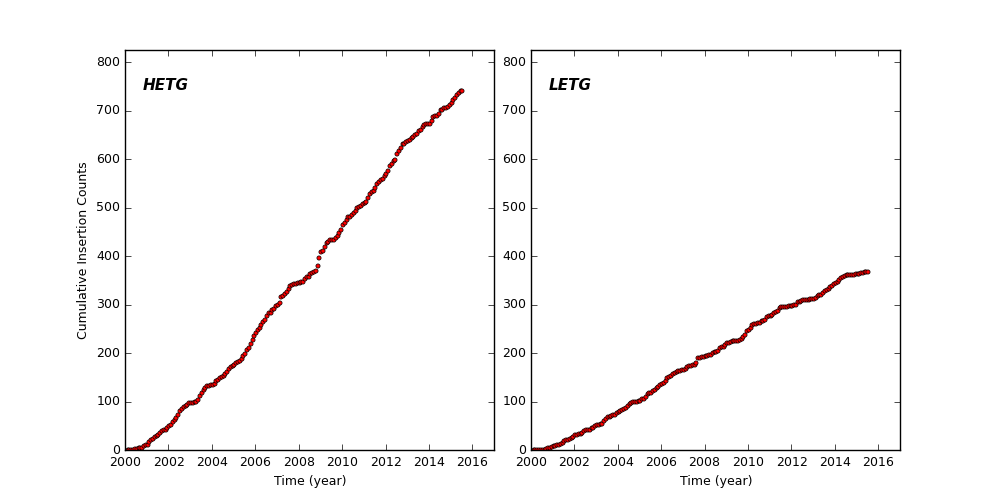
HETG and LETG Cummulative Insertion Counts
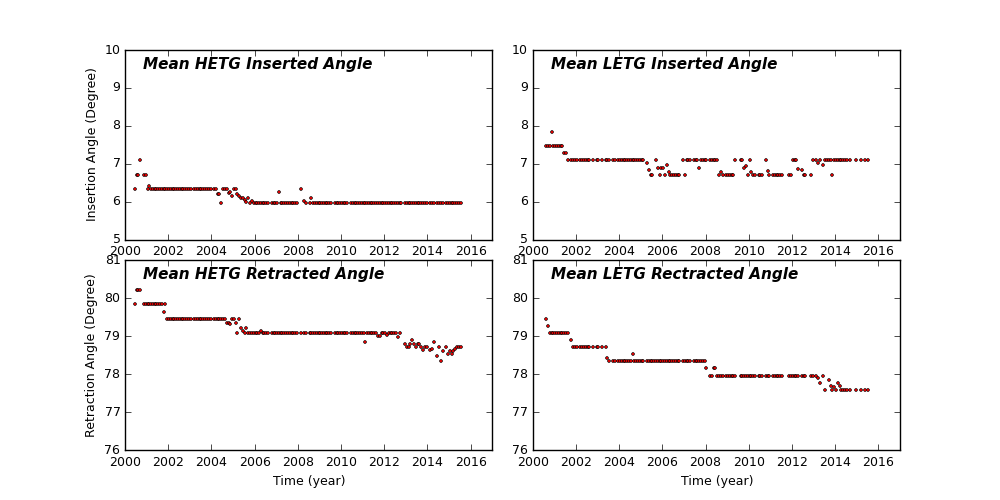
HETG/LETG Insertion/Retraction Angle
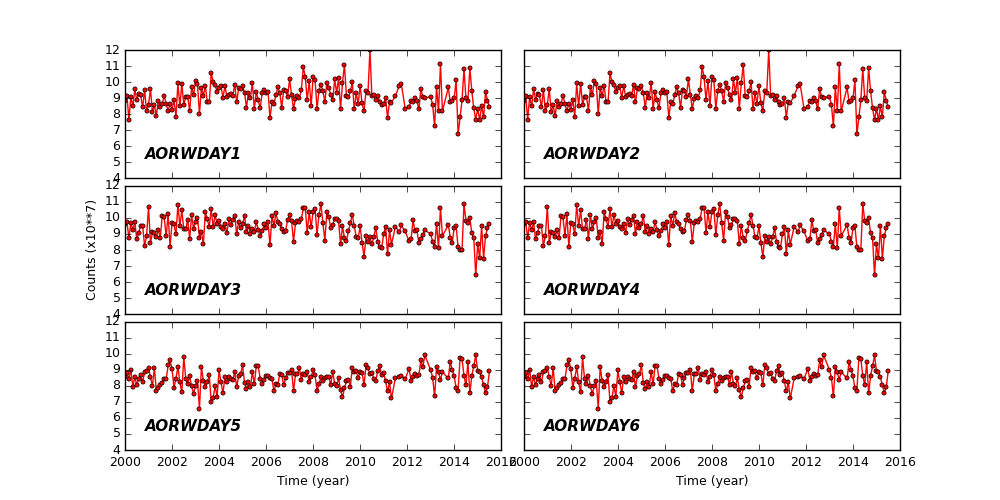
Reaction Wheel Rotations
Links to Past Monthly Reports
| Year | Month | |||||||||||
|---|---|---|---|---|---|---|---|---|---|---|---|---|
| 2015 | Jan | Feb | Mar | Apr | May | |||||||
| 2014 | Jan | Feb | Mar | Apr | May | Jun | Jul | Aug | Sep | Oct | Nov | Dec |
| 2013 | Jan | Feb | Mar | Apr | May | Jun | Jul | Aug | Sep | Oct | Nov | Dec |
| 2012 | Jan | Feb | Mar | Apr | May | Jun | Jul | Aug | Sep | Oct | Nov | Dec |
| 2011 | Jan | Feb | Mar | Apr | May | Jun | Jul | Aug | Sep | Oct | Nov | Dec |
| 2010 | Jan | Feb | Mar | Apr | May | Jun | Jul | Aug | Sep | Oct | Nov | Dec |
| 2009 | Jan | Feb | Mar | Apr | May | Jun | Jul | Aug | Sep | Oct | Nov | Dec |
| 2008 | Jan | Feb | Mar | Apr | May | Jun | Jul | Aug | Sep | Oct | Nov | Dec |
| 2007 | Jan | Feb | Mar | Apr | May | Jun | Jul | Aug | Sep | Oct | Nov | Dec |
| 2006 | Jan | Feb | Mar | Apr | May | Jun | Jul | Aug | Sep | Oct | Nov | Dec |
| 2005 | Jan | Feb | Mar | Apr | May | Jun | Jul | Aug | Sep | Oct | Nov | Dec |
| 2004 | Jan | Feb | Mar | Apr | May | Jun | Jul | Aug | Sep | Oct | Nov | Dec |
| 2003 | Jan | Feb | Mar | Apr | May | Jun | Jul | Aug | Sep | Oct | Nov | Dec |
| 2002 | Jan | Feb | Mar | Apr | May | Jun | Jul | Aug | Sep | Oct | Nov | Dec |
| 2001 | Jan | Feb | Mar | Apr | May | Jun | Jul | Aug | Sep | Oct | Nov | Dec |
| 2000 | Jan | Feb | Mar | Apr | May | Jun | Jul | Aug | Sep | Oct | Nov | Dec |
| 1999 | Jul | Aug | Sep | Oct | Nov | Dec | ||||||