ACIS
ACIS DOSE Registered-Photon-Map
The steps we took to compute the dose map are;
- Level 1 Event files for a specified month are obtained from archive.
- Image data including I2, I3, S2, S3 CCDs are extracted from all event files.
- All the extracted image data were merged to create a month long exposure map for the month.
- The exposure map is opened with ds9, and check a distribution of count rates against energy. From this, estimate the upper threshold value. Any events beyond this upper threshold are assumed erroneous events such as bad pixels.
- Using this upper threshold, the data is filtered, and create a cleaned exposure map for the month.
- The exposure map from each month from the Sep 1999 is added up to create a cumulative exposure map for each month.
- Using fimgstatistic, we compute count rate statistics for each CCDs.
- For observations with high data drop rates (e.g., Crab nebula, Cas A), we corrected the observations by adding events.
Please check more detail plots at Telemetered Photon Dose Trend page.
)
)
)
Statistics:
# IMAGE     NPIX     MEAN        RMS        MIN     MAX
ACIS_jul15 6004901   34.129      49.024     0.0     12185


I2 node 0  262654   37.927956    9.720828    7.0    180.0
I2 node 1  262654   38.309031   10.648470    7.0   1222.0
I2 node 2  262654   37.388897    9.189038    7.0   1036.0
I2 node 3  262654   38.060044   13.515525    7.0   2907.0

I3 node 0  262654   39.555404   11.266907    9.0    407.0
I3 node 1  262654   38.633458   30.039632    9.0   6325.0
I3 node 2  262654   36.074446    8.476390    6.0    230.0
I3 node 3  262654   38.485044   10.864436    0.0   1847.0

S2 node 0  262654   43.639702   33.375908    0.0   9670.0
S2 node 1  262654   42.393281   11.017278   10.0    203.0
S2 node 2  262654   45.336275   41.170817    0.0  12185.0
S2 node 3  262654   48.139153   12.919279    9.0   1359.0

S3 node 0  262654   61.698560   29.010774   15.0    383.0
S3 node 1  262654   61.164873   18.163327    0.0    575.0
S3 node 2  262654   56.370749   11.825845   19.0   1824.0
S3 node 3  262654   50.723953    9.755188   17.0    170.0
)
)
)
Statistics:
 IMAGE     NPIX      MEAN        RMS          MIN      MAX
ACIS_total 6004901  1938.995    2535.601      0.0    111493


I2 node 0  262654   1634.089553  312.855805   322.0   9190.0
I2 node 1  262654   1721.739182  432.331161   352.0  41753.0
I2 node 2  262654   1754.637422  367.980841   352.0   9291.0
I2 node 3  262654   1752.835395  441.544503   332.0  28133.0

I3 node 0  262654   1842.655065  439.805539   324.0   7153.0
I3 node 1  262654   1932.215081 1455.515132   335.0  36541.0
I3 node 2  262654   1686.622418  302.866003   318.0   8805.0
I3 node 3  262654   1674.083205  324.031010   297.0  27911.0

S2 node 0  262654   2265.171166  329.246139  1202.0  21307.0
S2 node 1  262654   2407.952902  524.856806  1271.0  13240.0
S2 node 2  262654   2662.179458  510.993053  1623.0  27283.0
S2 node 3  262654   2600.364753  371.400565  1535.0  44348.0

S3 node 0  262654   4015.824655 1827.332402  1669.0  13752.0
S3 node 1  262654   5244.626638 2129.388003     0.0  14234.0
S3 node 2  262654   4030.795841 1040.462668  1638.0   9738.0
S3 node 3  262654   3102.707131  476.550017  1776.0  10575.0
)
|
)
|
)
|
)
|
| Apr 2015 | Jan 2015 | Oct 2014 | Jul 2014 |
|---|
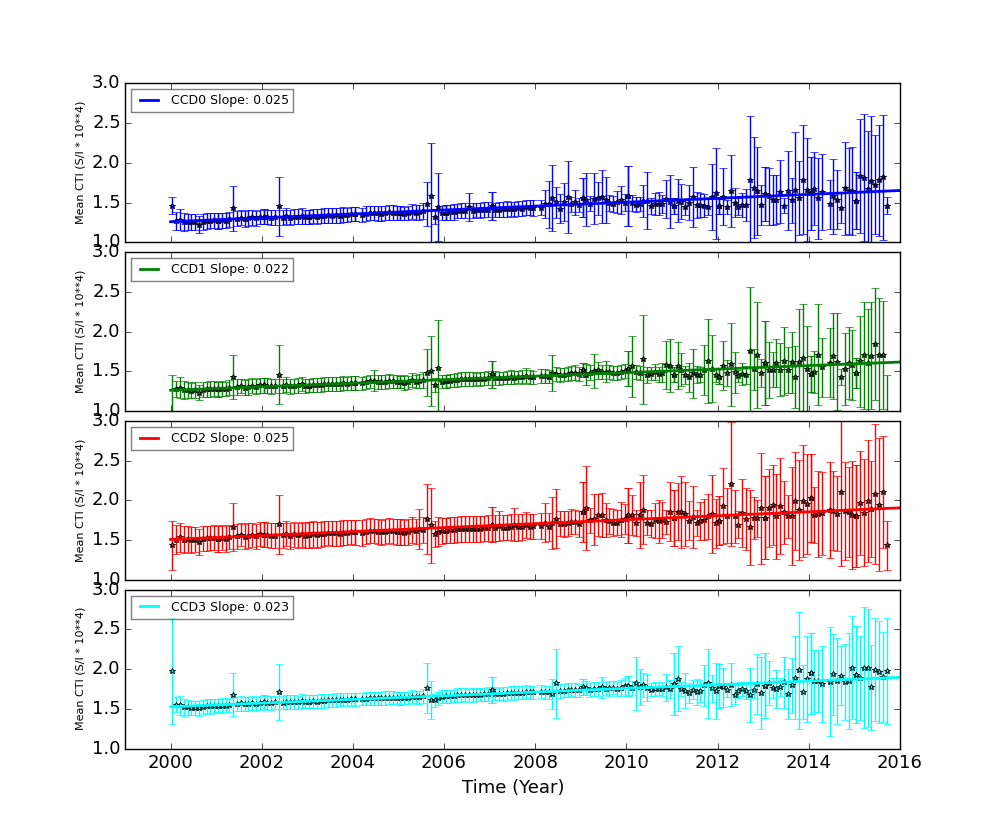
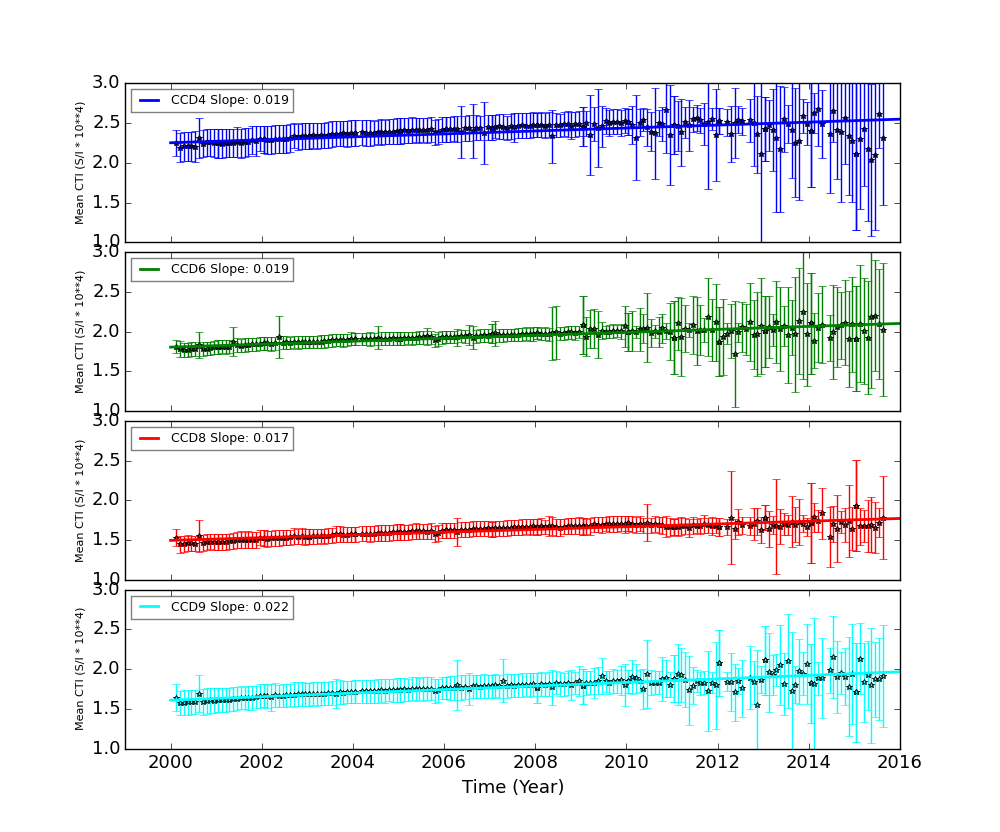
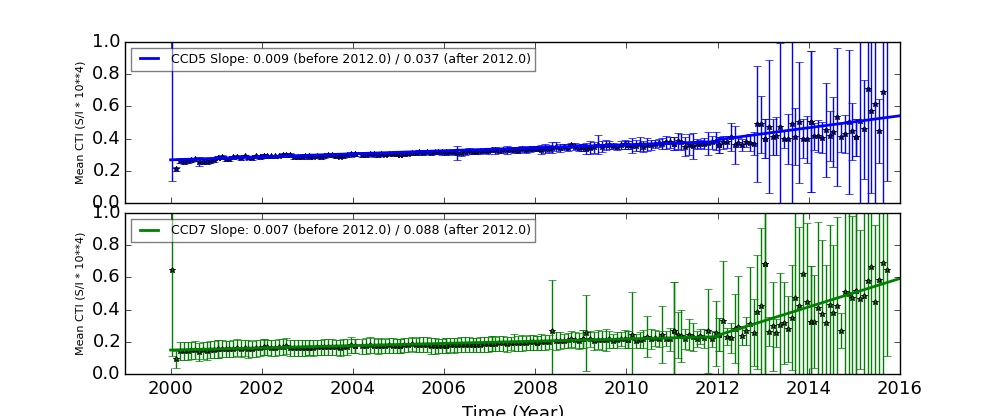
The Mean Detrended CTI
We report CTIs with a refined data definition. CTIs were computed for the temperature dependency corrected data. Please see CTI page for detailed explanation. CTI's are computed for Mn K alpha, and defined as slope/intercept x10^4 of row # vs ADU. Data file: here
Imaging CCDs
Spectral CCDs
Backside CCDs
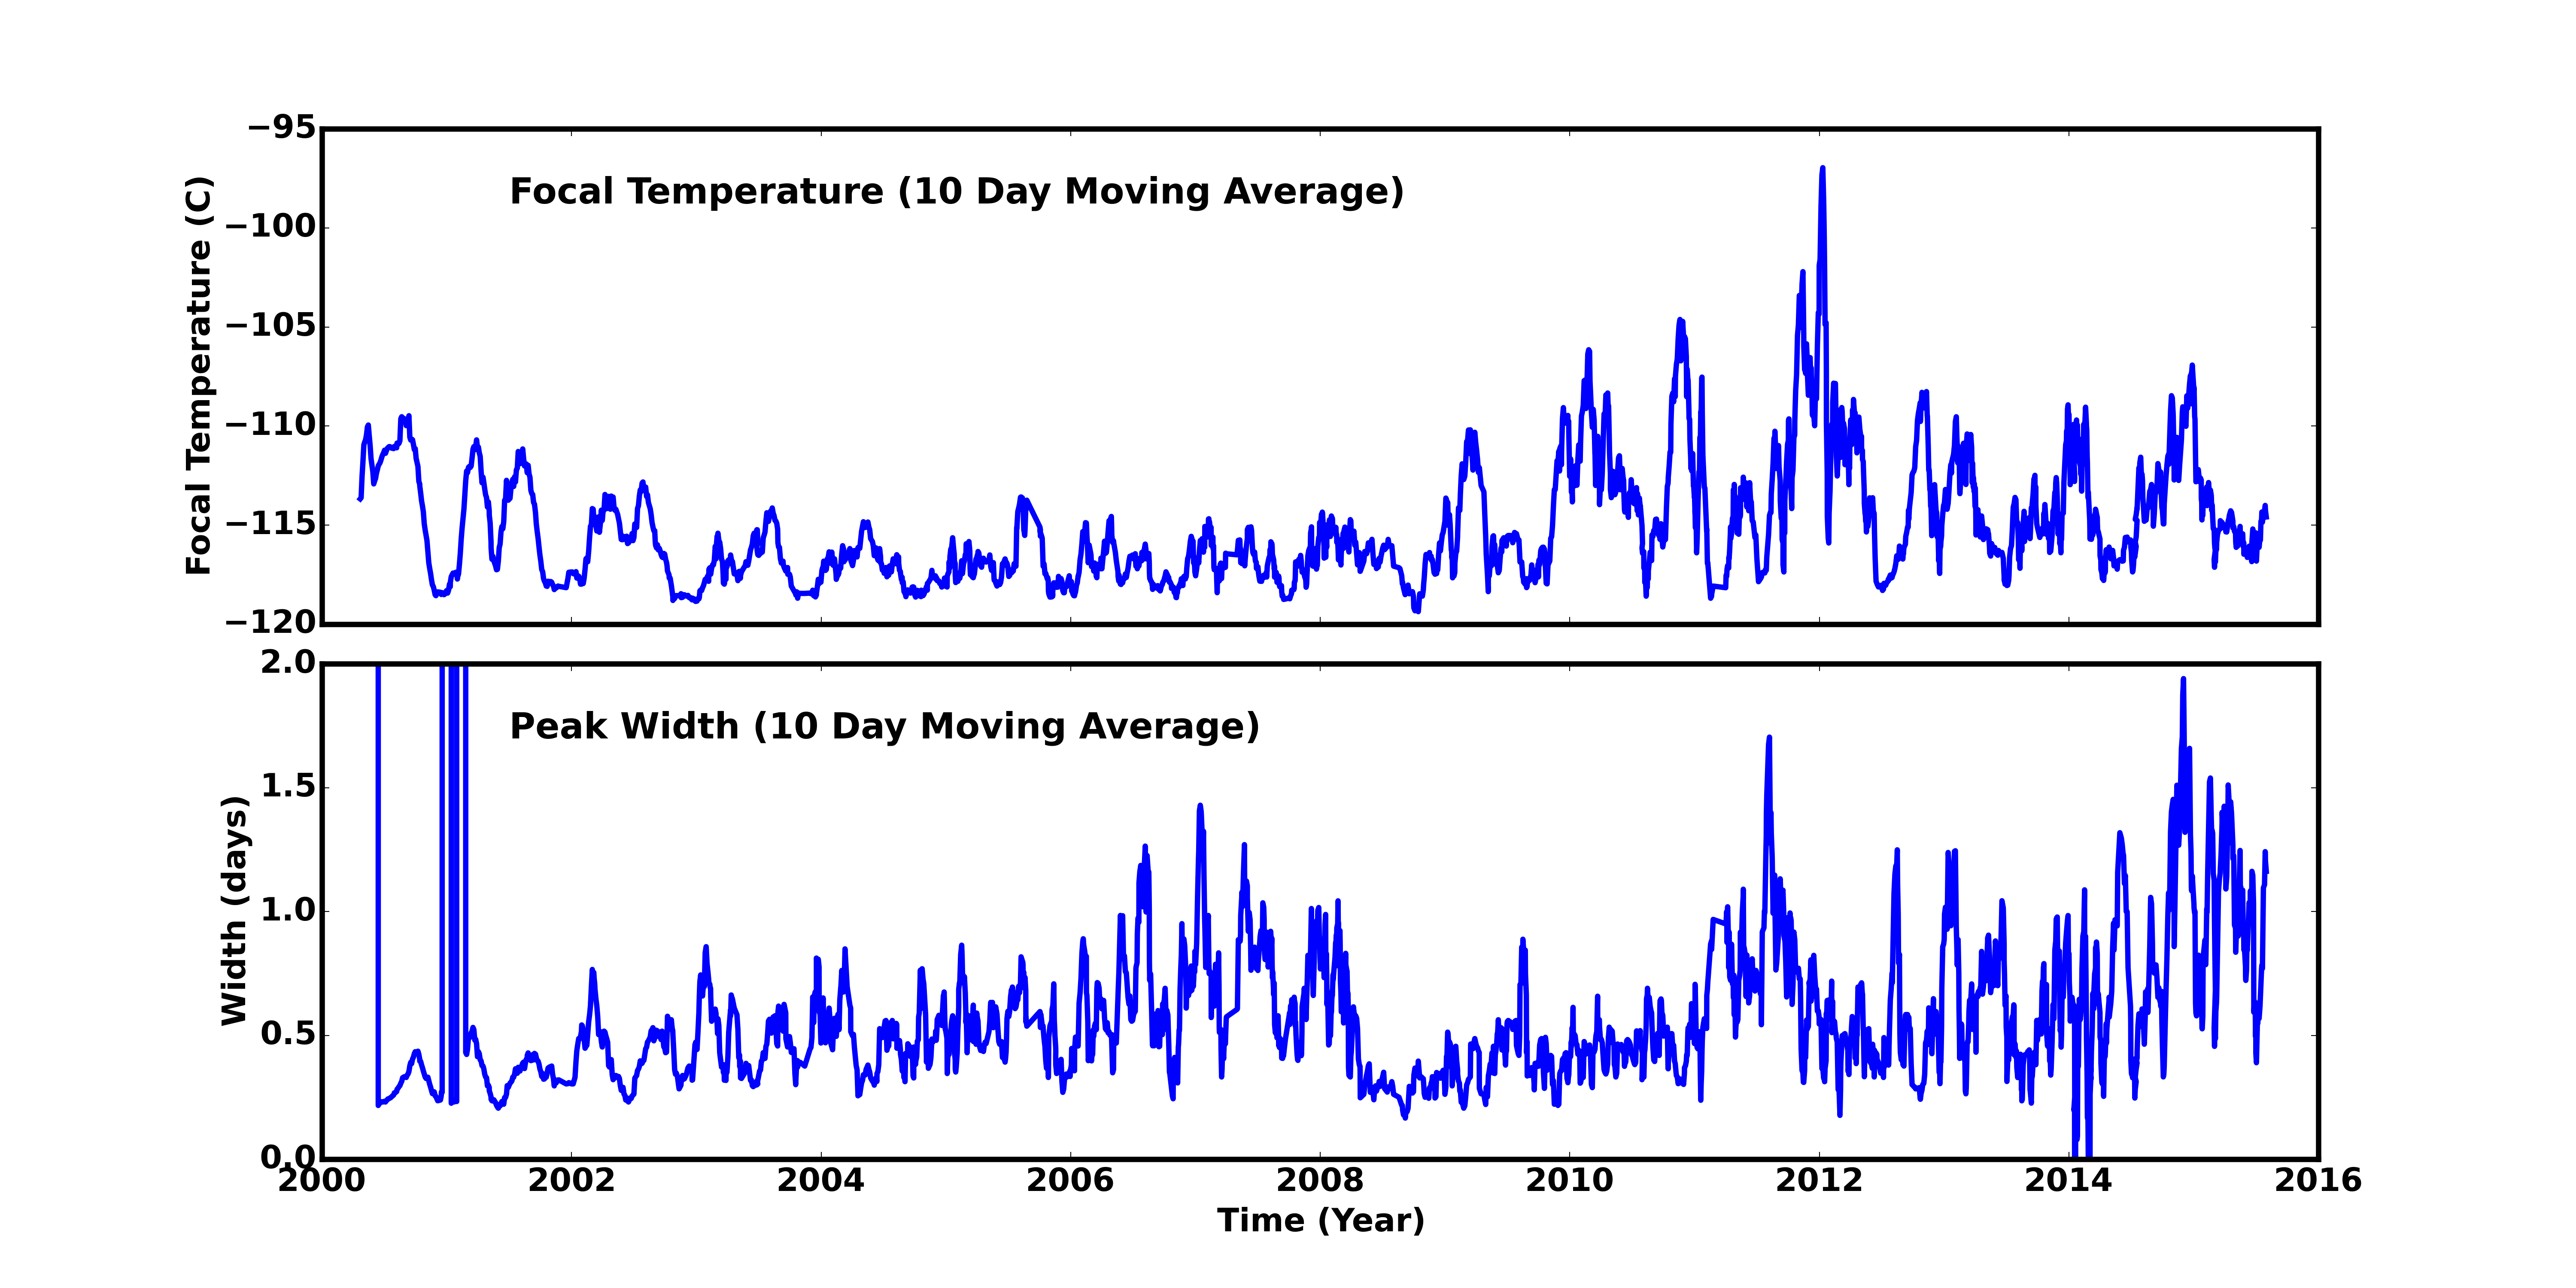
Focal Plane Temperature
Jun 2015 Focal Temperature
| The Mean (max) FPT: | |
|---|---|
| -115.02 | +/- 2.92 C |
| Mean Width: | |
| 0.93 | +/- 0.79 days |
Averaged Focal Plane Temperature
We are using 10 period moving averages to show trends of peak temperatures and peak widths. Note, the gaps in the width plot are due to missing/corrupted data.
Focal Plane Temperature, Sun Angle and Altitude
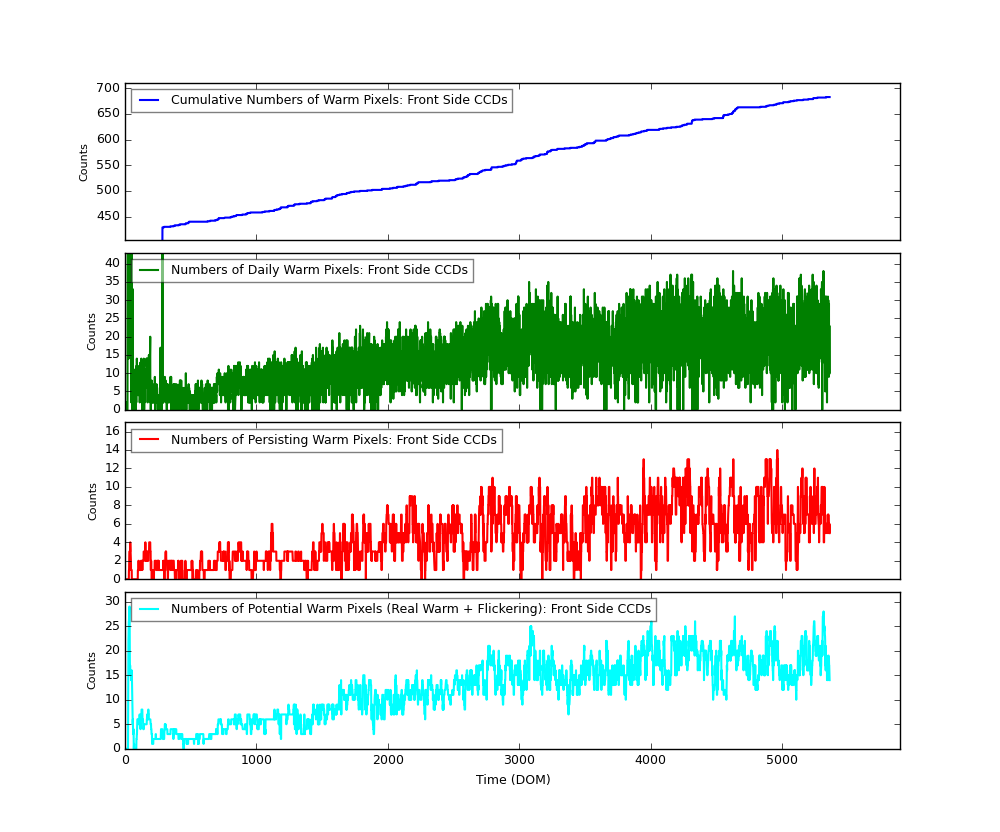
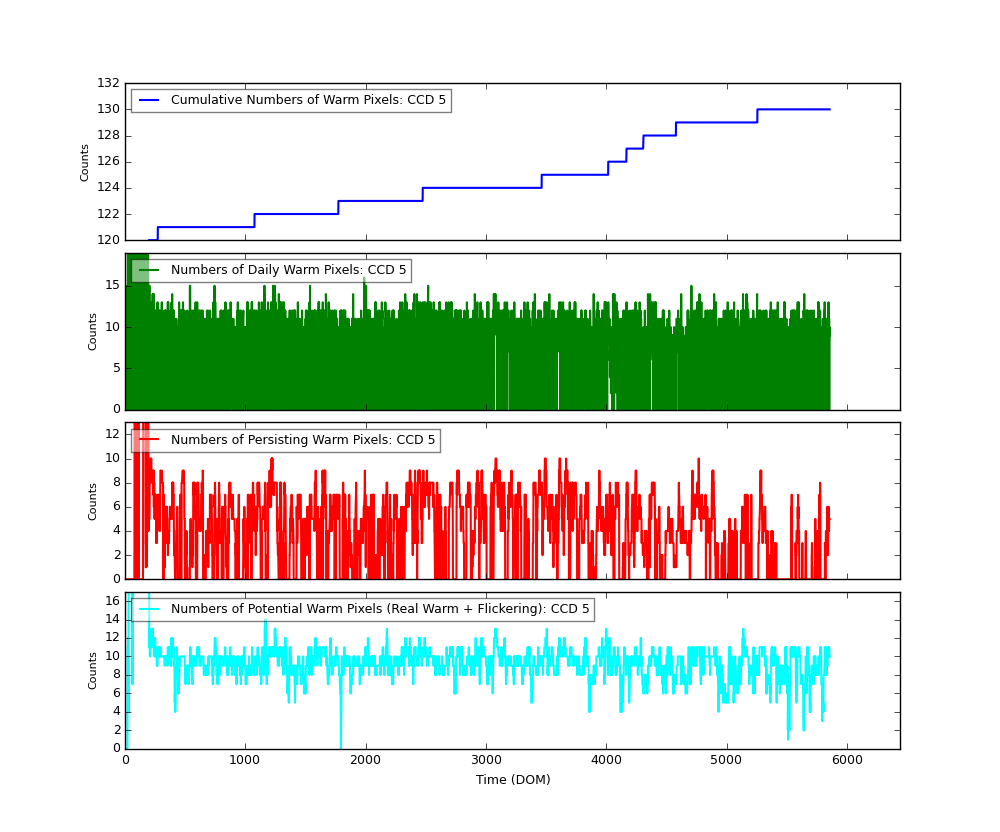
Bad Pixels
The plots below were generated with a new warm pixel finding script. Please see Acis Bad Pixel Page for details.
Front Side CCDs
Back Side CCD (CCD5)
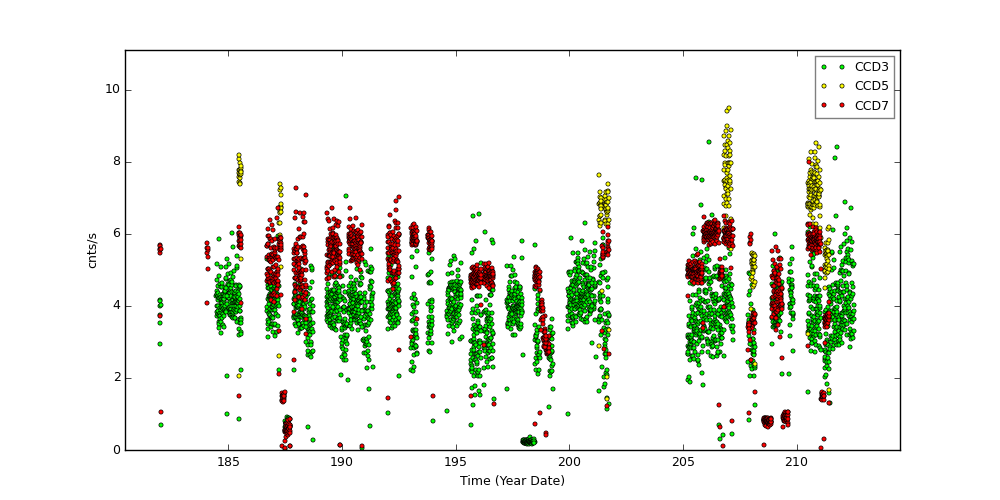
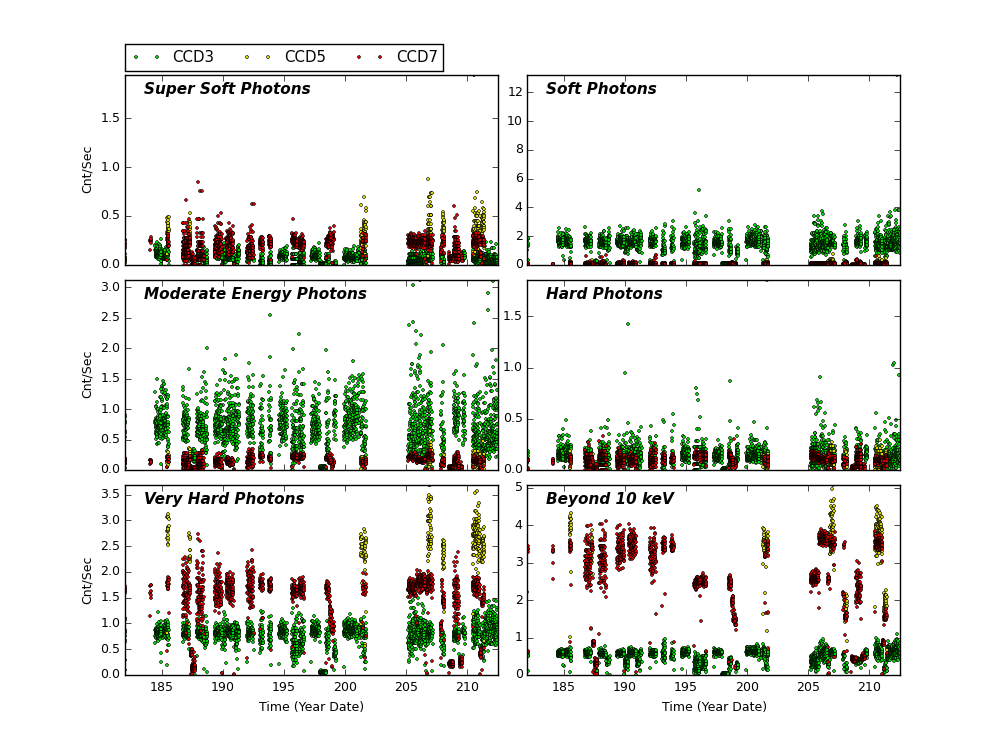
Science Instrument Background Rates
| Name | Low (keV) | High(KeV) | Description |
|---|---|---|---|
| SSoft | 0.00 | 0.50 | Super soft photons |
| Soft | 0.50 | 1.00 | Soft photons |
| Med | 1.00 | 3.00 | Moderate energy photons |
| Hard | 3.00 | 5.00 | Hard Photons |
| Harder | 5.00 | 10.00 | Very Hard photons |
| Hardest | 10.00 | Beyond 10 keV |
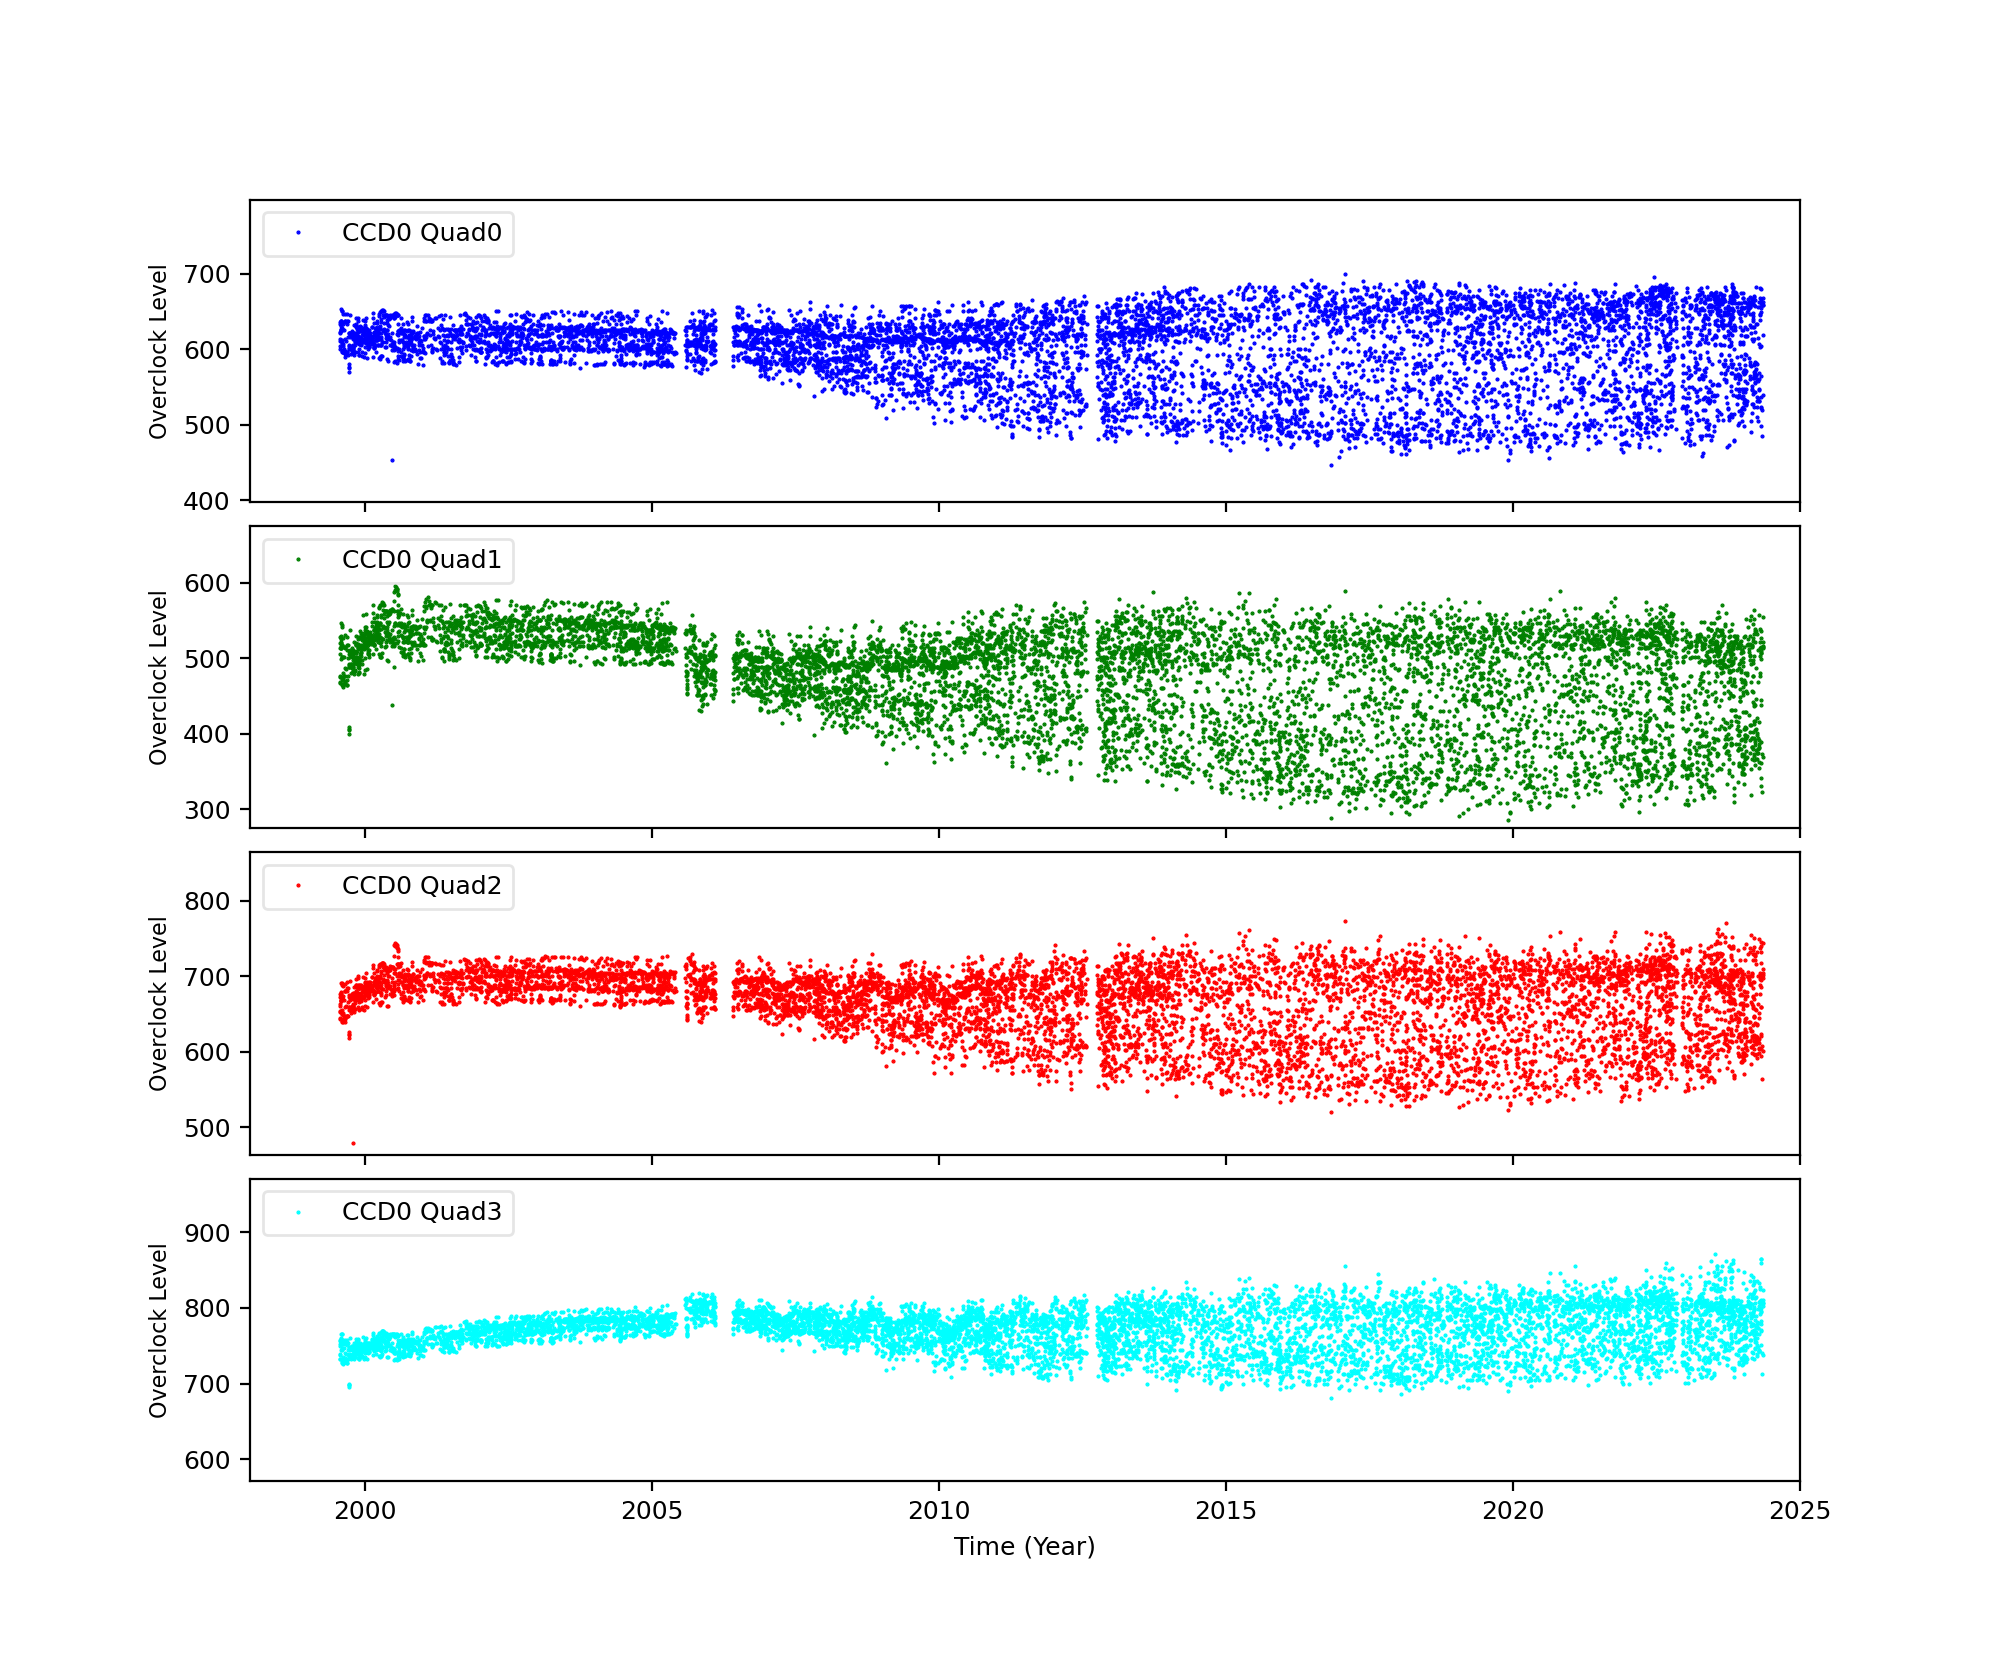
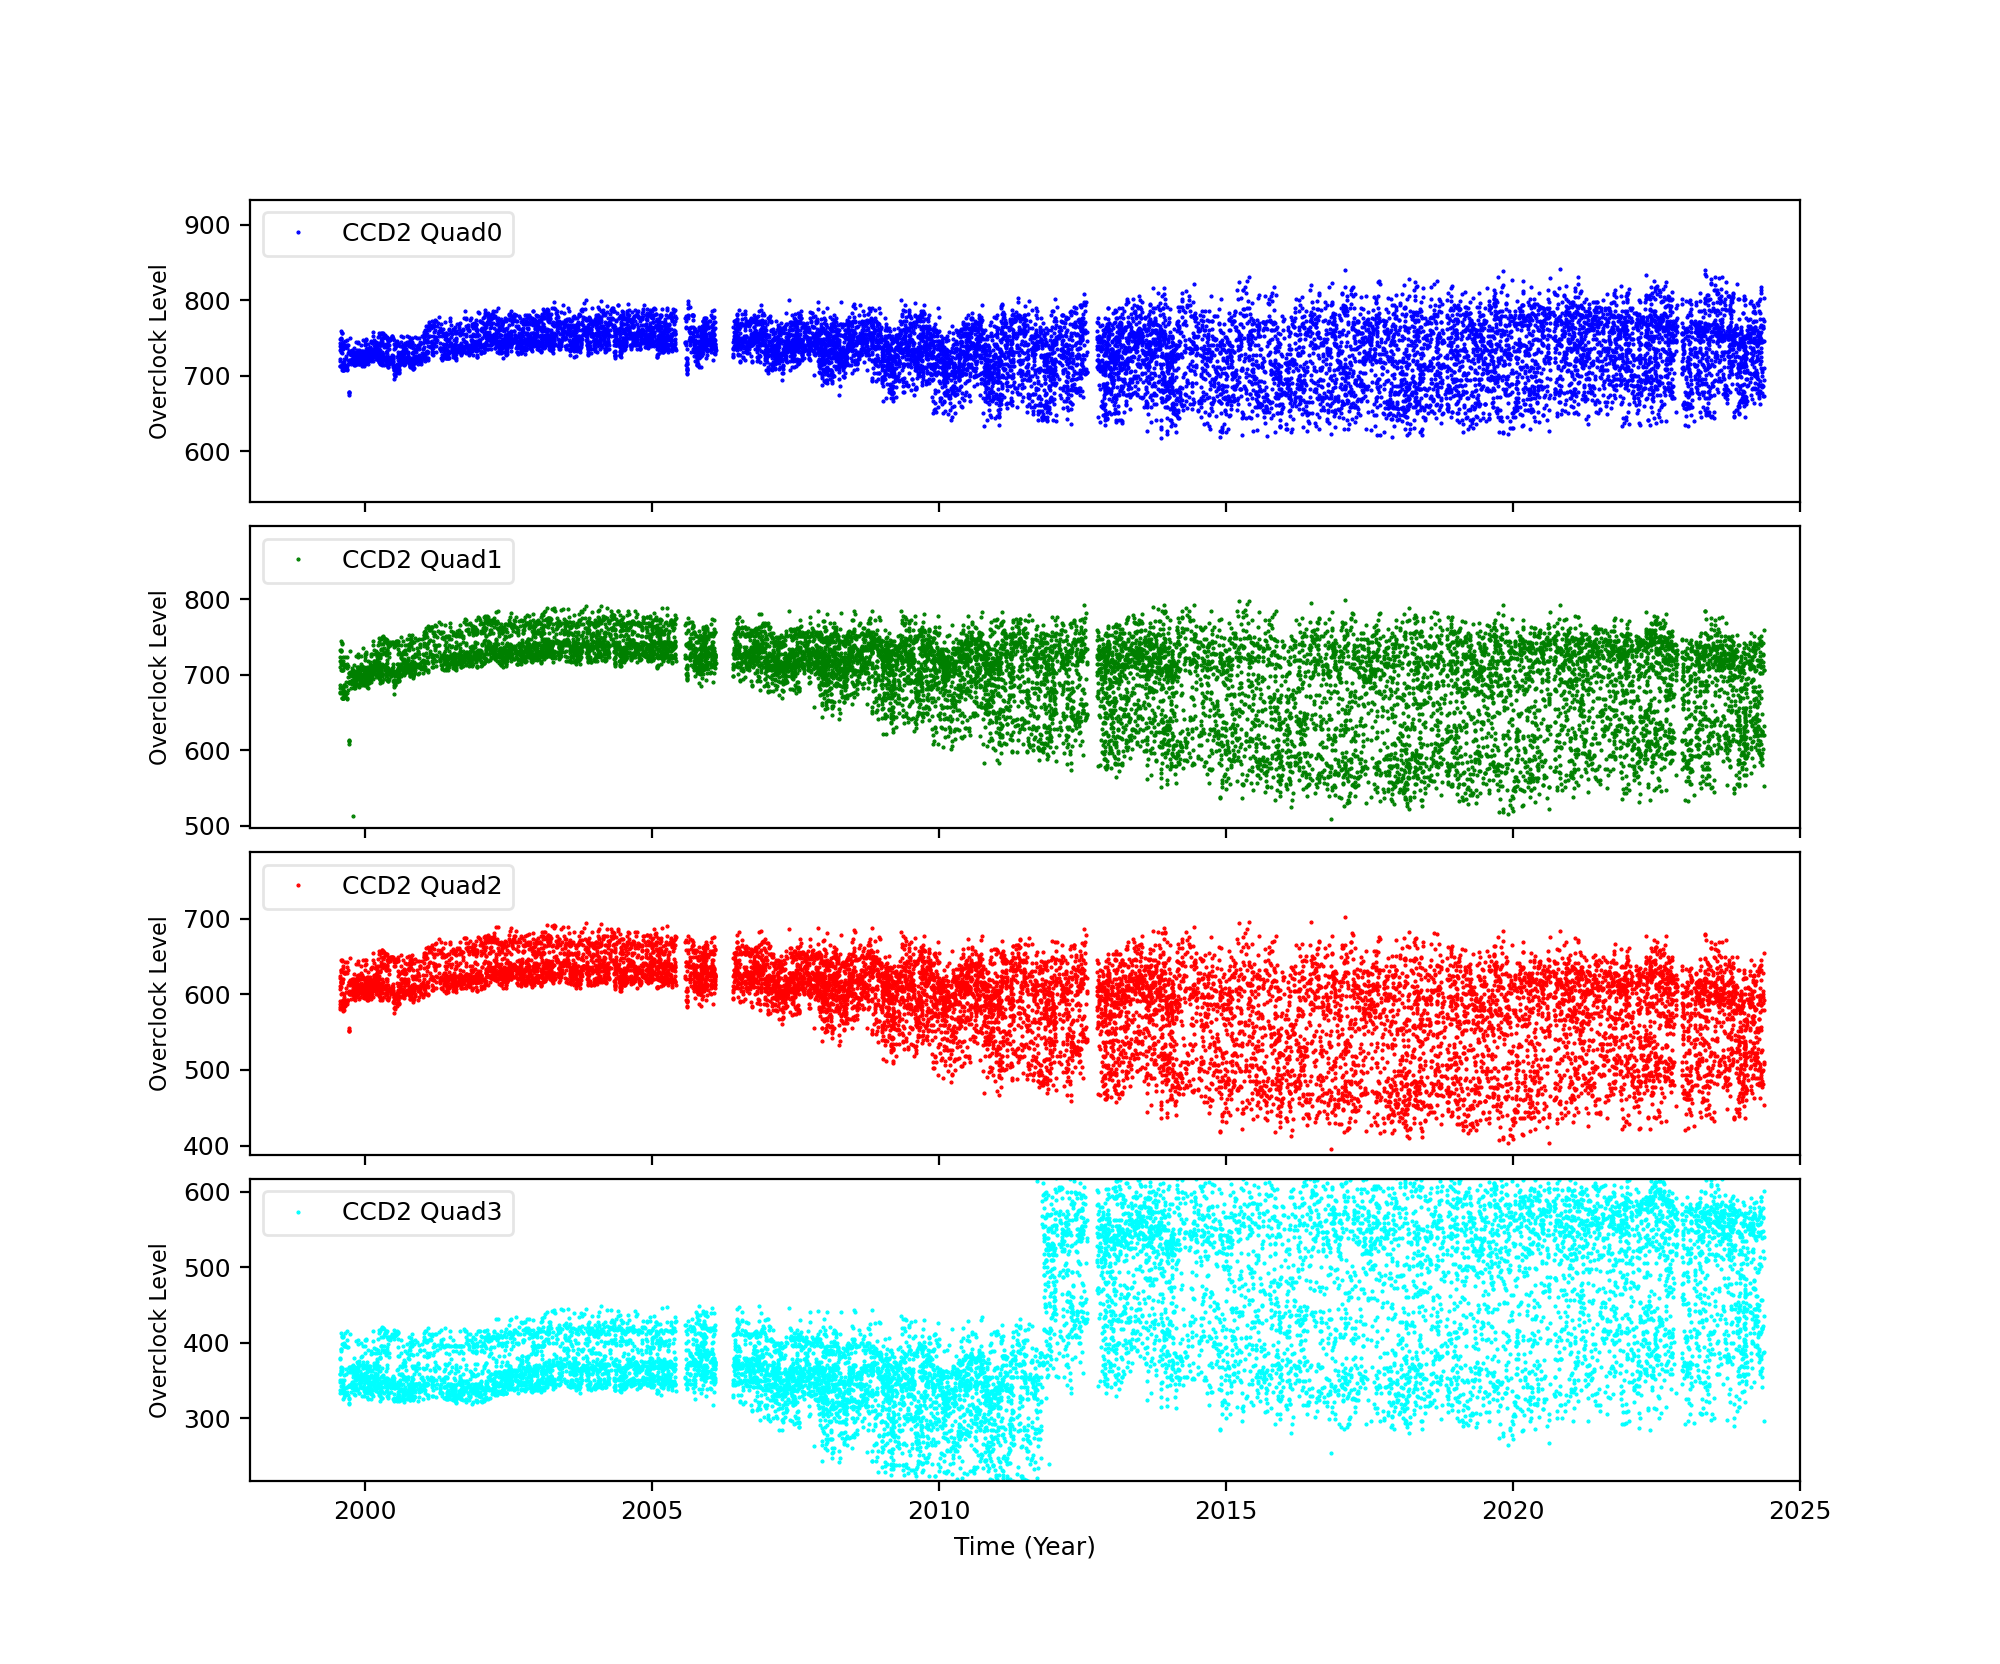
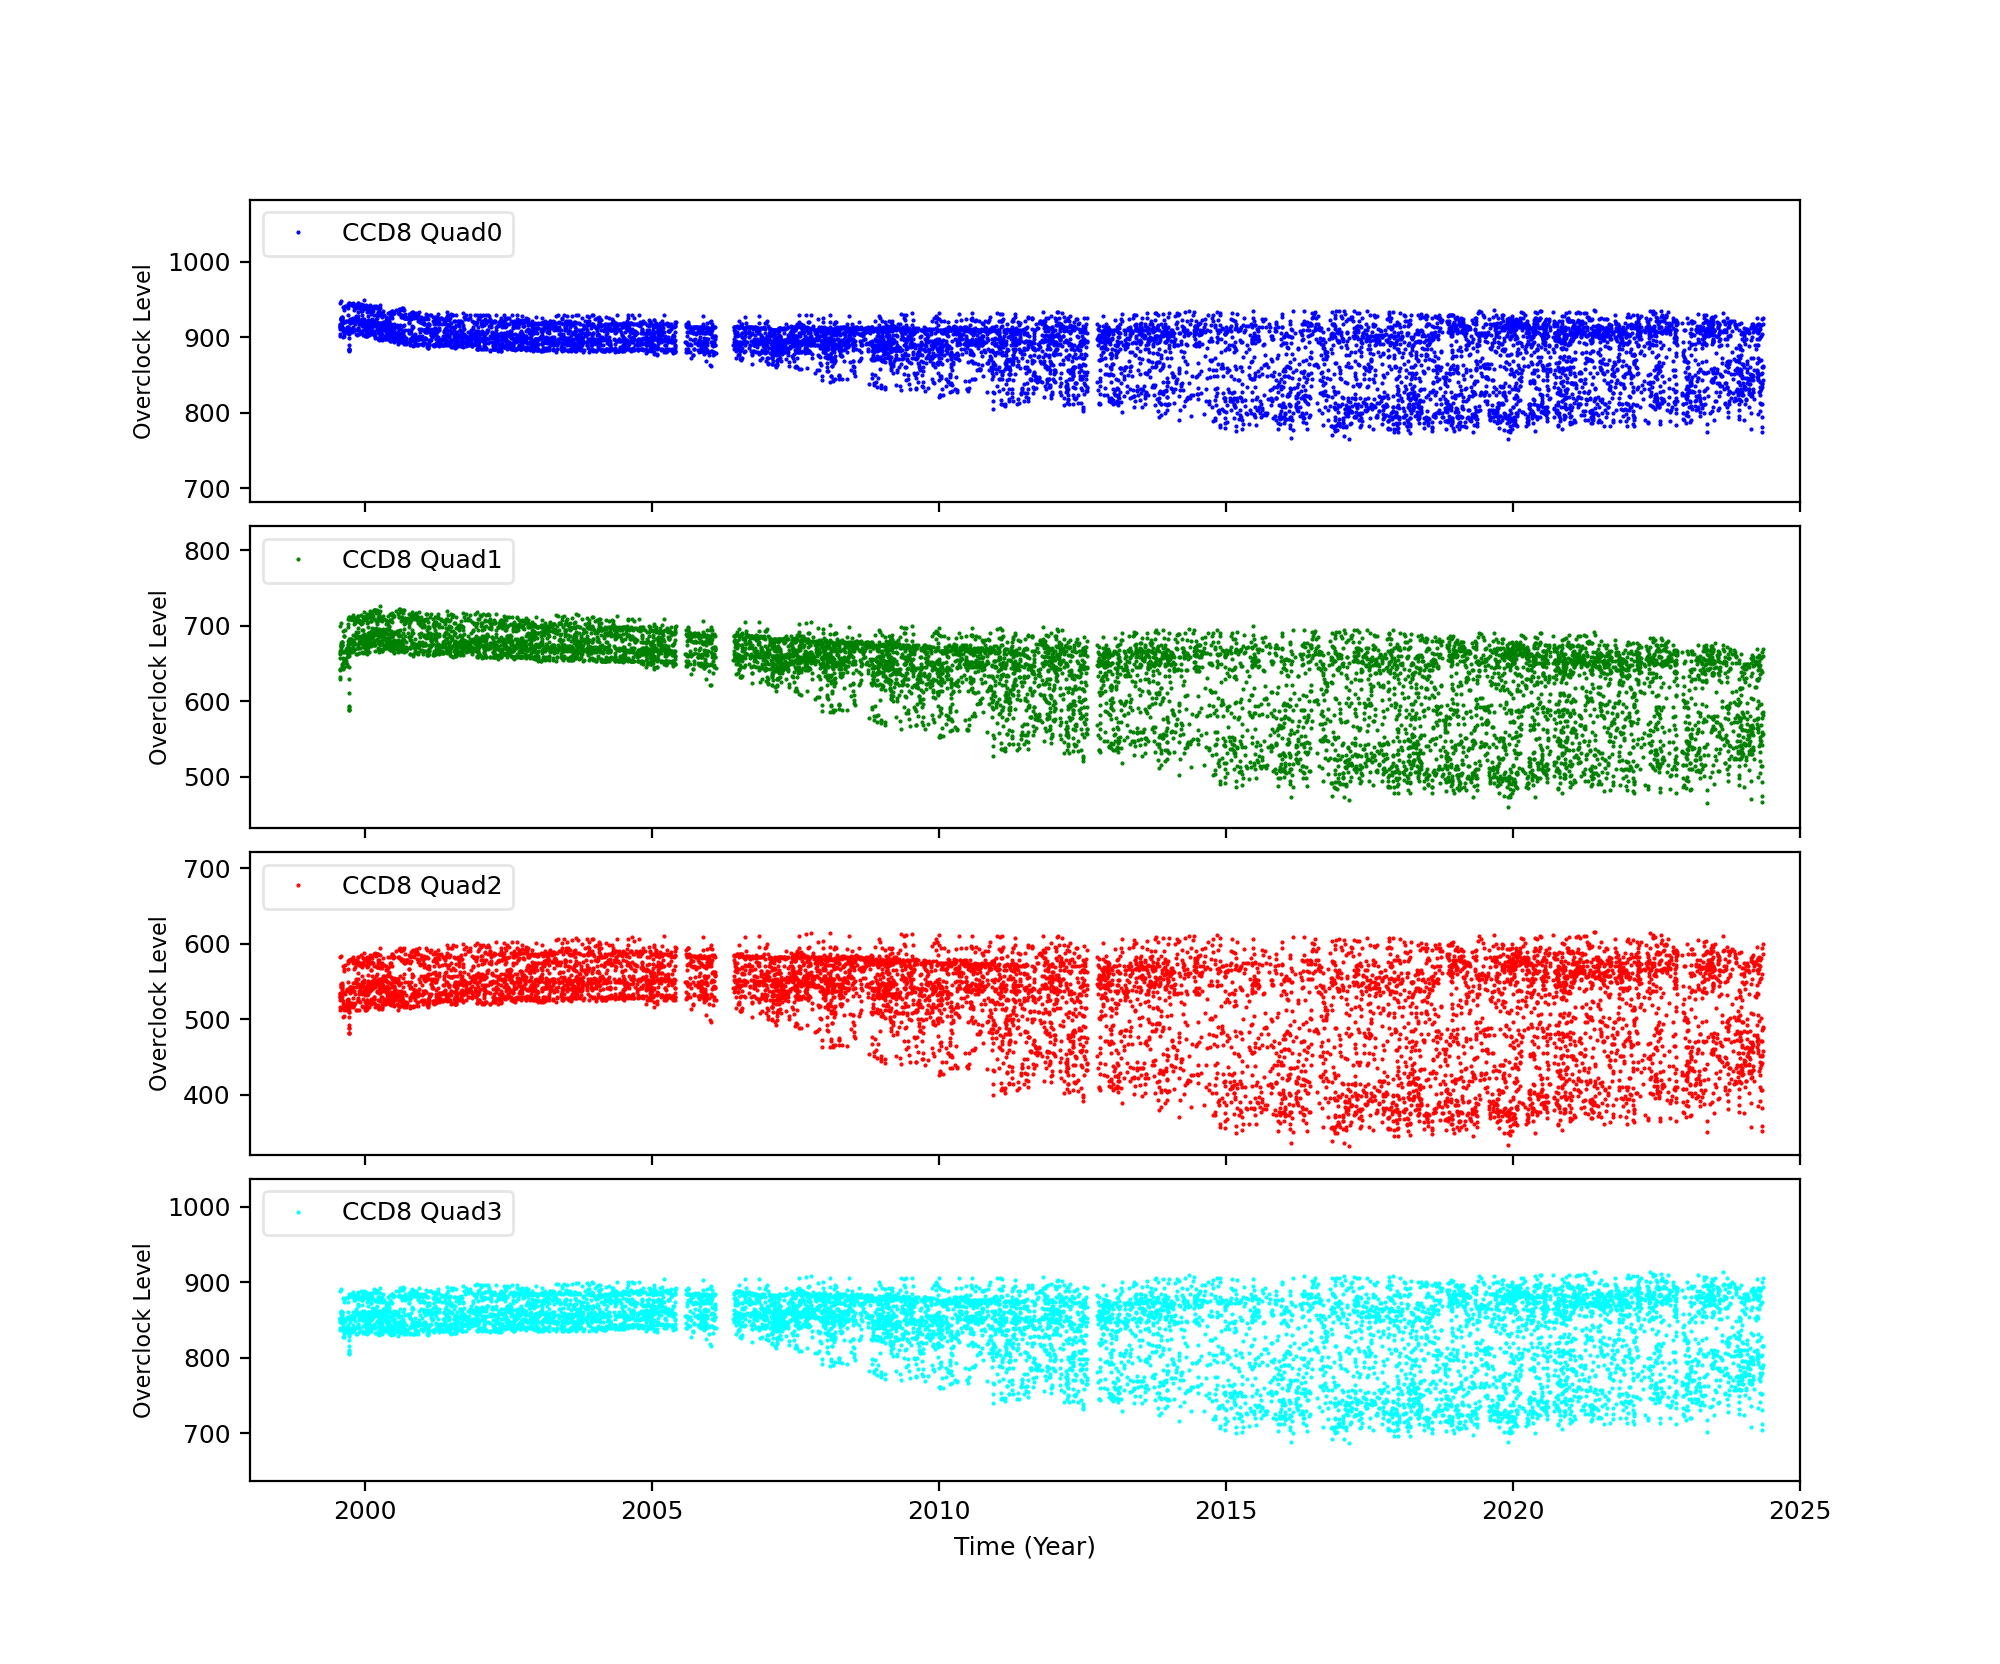
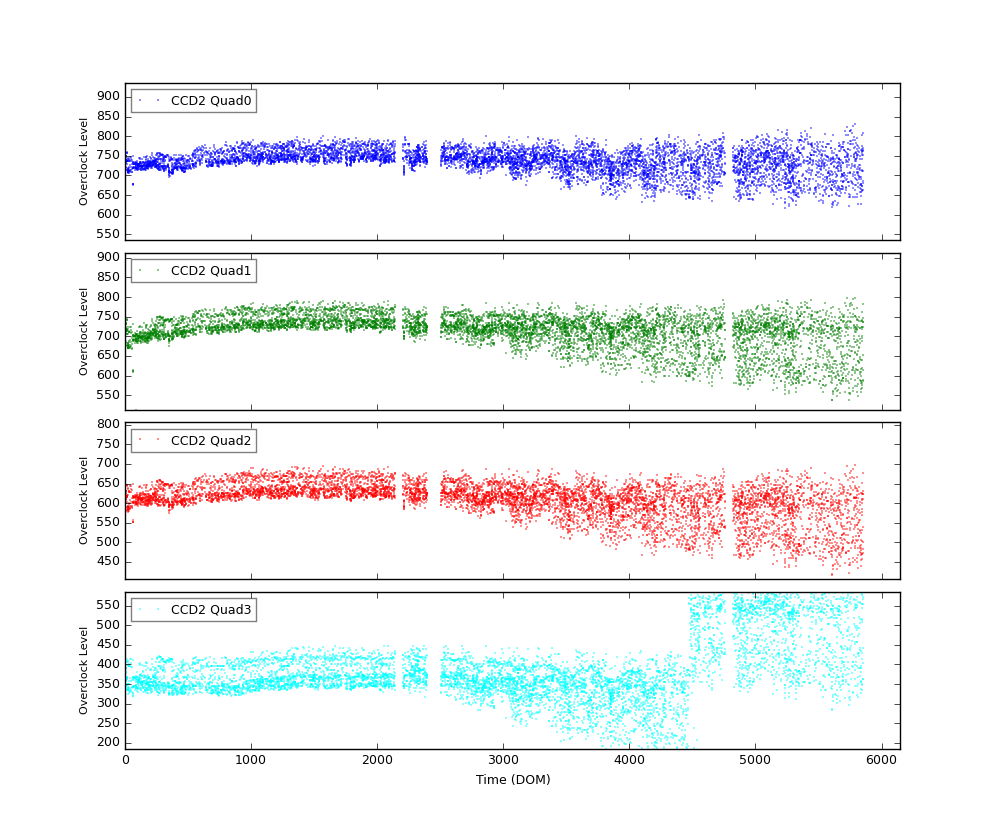
ACIS Bias Trends
The bias plus overclock level was calculated as follows:
- Get acisf*bias0.fits is obtained from a database or /dsops/ap/sdp/cache/*/acis/
- Data with timed mode exposure is selected.
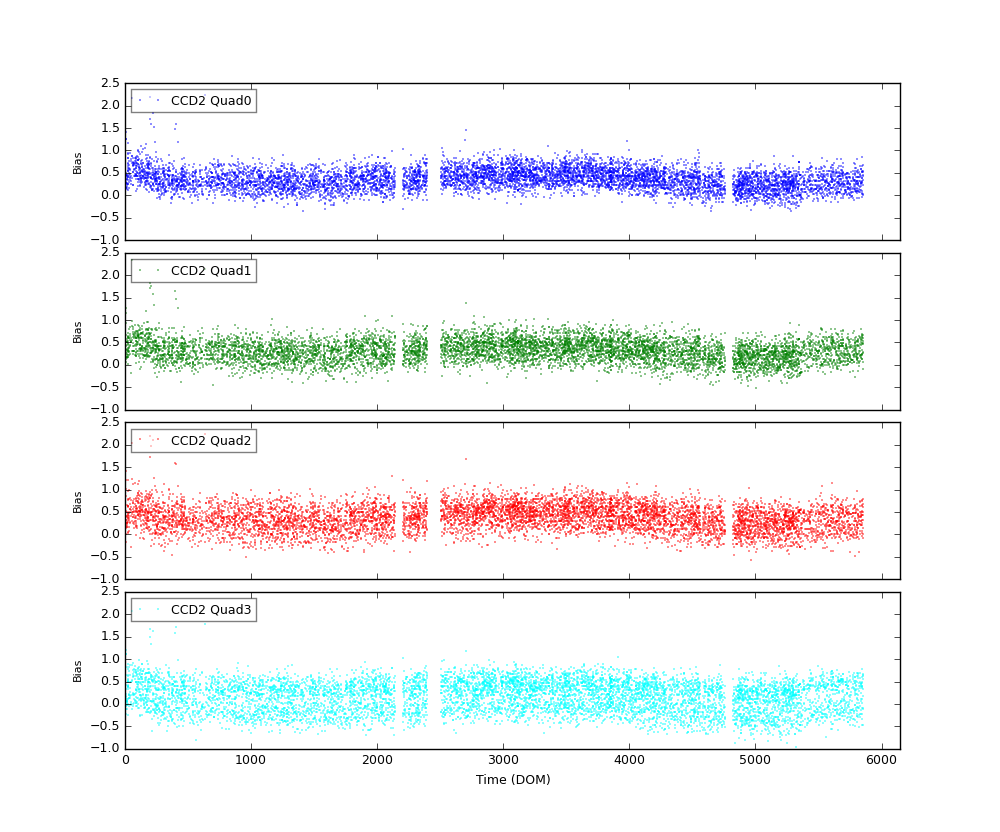
- Fits files were divided into 4 quads, then an average of bias level for each quad is computed. No corrections for dead spots, columns etc were included.
An example of Overclock values as reported in FITS file header:
An example of mean bias minus overclock value:
HRC
DOSE of Central 4K Pore-Pairs
Please refer to Maximum Dose Trends for more details.
)
|
|---|
        IMAGE                NPIX      MEAN    STDDEV      MIN       MAX
HRCI_07_2015.fits          16777216   0.012    0.0342      0.0       2.0
)
        IMAGE                NPIX      MEAN    STDDEV      MIN       MAX
HRCI_08_1999_07_2015.fits  16777216   4.328    4.917       0.0       292.0
)
     IMAGE                NPIX      MEAN    STDDEV      MIN       MAX
HRCS_07_2015.fits          16777216     0.047    0.4349     0.0        43.0
)
        IMAGE                NPIX     MEAN      STDDEV      MIN      MAX
HRCS_08_1999_07_2015.fits  16777216  15.747     27.909      0.0      1691.0
|
|
Max dose trend plots corrected for events that "pile-up"
in the center of the taps due to bad position information.
|
)
|
)
|
)
|
)
|
| Apr 2015 | Jan 2015 | Oct 2014 | Jul 2014 |
|---|
)
|
)
|
)
|
)
|
| Apr 2015 | Jan 2015 | Oct 2014 | Jul 2014 |
|---|
Gratings
Focus
We plot the width of the zero order streak of ACIS/HETG observations and the width of the zero order image for HRC/LETG observations of point sources. No significant defocusing trend is seen at this time. See Gratings Focus pages.
PCAD
ACA Trending
Gyro Bias Drift
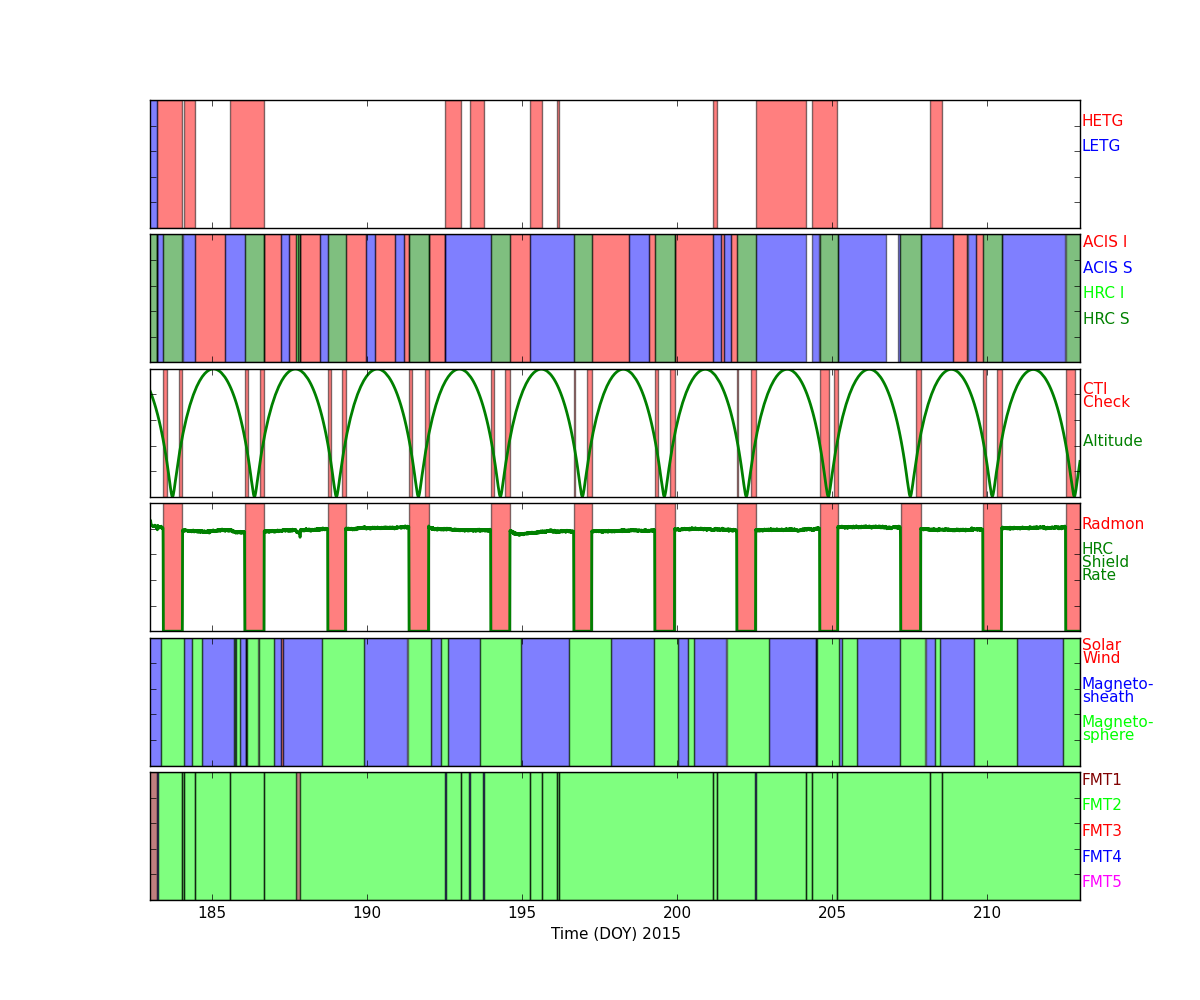
Radiation History
Radiation Zone Timing
Plotted below are radiation zone timing plots based on the following definitions of radiation zone:
- RADZONE - Ephin levels (in any of the E1300,P4GM,P41GM channels) are more than 1/3 of RADMON safing thresholds.
- RADMON - Radmon is disabled for radiation zone (as commanded based on OFLS model, for comparison with actual radiation levels).
- PERIGEE - Time of closest earth approach (for comparison)
Radiation Count Rates of Jul 2015
Sun Spot History
Trending
Quarterly Trends
- PCAD Temperature and Voltage
| Previous Quarter | ||||||
| MSID | MEAN | RMS | DELTA/YR | DELTA/YR/YR | UNITS | DESCRIPTION |
| AFSSPC2V | 3.52 | 1.091e-03 | 2.822e-04 | -5.429e-03 | V | FSS POWER CONV 2 VOLTAGE |
| AGWS2V | 2.70 | 3.381e-04 | 1.645e-03 | 1.840e-02 | V | GYRO WHEEL SUPPLY 2 INPUT VOLTAGE |
)
)
- PCAD Gyro Rate
| Previous Quarter | ||||||
| MSID | MEAN | RMS | DELTA/YR | DELTA/YR/YR | UNITS | DESCRIPTION |
| AI1AX1X | -3.88 | 5.721e-03 | -4.294e-03 | -3.294e-01 | RATE | IRU-1 AXIS 1X ANALOG |
| AI1AX1Y | -3.92 | 4.049e-03 | -3.435e-04 | -8.414e-02 | RATE | IRU-1 AXIS 1Y ANALOG |
| AI1AX2X | -3.89 | 3.974e-03 | -4.260e-03 | -1.979e-01 | RATE | IRU-1 AXIS 2X ANALOG |
| AI1AX2Y | -3.92 | 3.722e-03 | -8.567e-04 | 3.450e-02 | RATE | IRU-1 AXIS 2Y ANALOG |
)
)
)
)
- PCAD FTS Gradient
| Previous Quarter | ||||||
| MSID | MEAN | RMS | DELTA/YR | DELTA/YR/YR | UNITS | DESCRIPTION |
| OHRTHR27 | 297.15 | 5.036e-03 | 2.683e-03 | -7.003e-02 | K | RT 20 : PERISCOPE |
| OHRTHR42 | 294.57 | 7.084e-02 | 1.182e-01 | 2.625e+00 | K | RT 133: PERISCOPE |
)
)
- PCAD FTS Gradient
| Previous Quarter | ||||||
| MSID | MEAN | RMS | DELTA/YR | DELTA/YR/YR | UNITS | DESCRIPTION |
| PFTANKIP | 1.967e+03 | 17.41 | 5.507e+01 | 6.457e+02 | PSIA | FUEL TANK INLET PRESSURE |
| PFTANKOP | 1.941e+03 | 18.57 | 5.702e+01 | 9.516e+02 | PSIA | FUEL TANK OUTLET PRESSURE |
| PXTANKIP | 1.900e+03 | 4.63 | 2.716e-01 | -7.676e+01 | PSIA | OX TANK INLET PRESSURE |
| PXTANKOP | 1.914e+03 | 4.16 | -6.335e-01 | -1.533e+02 | PSIA | OX TANK OUTLET PRESSURE |
)
)
)
)
Envelope Trending
HRMA STRUTS
MUPS
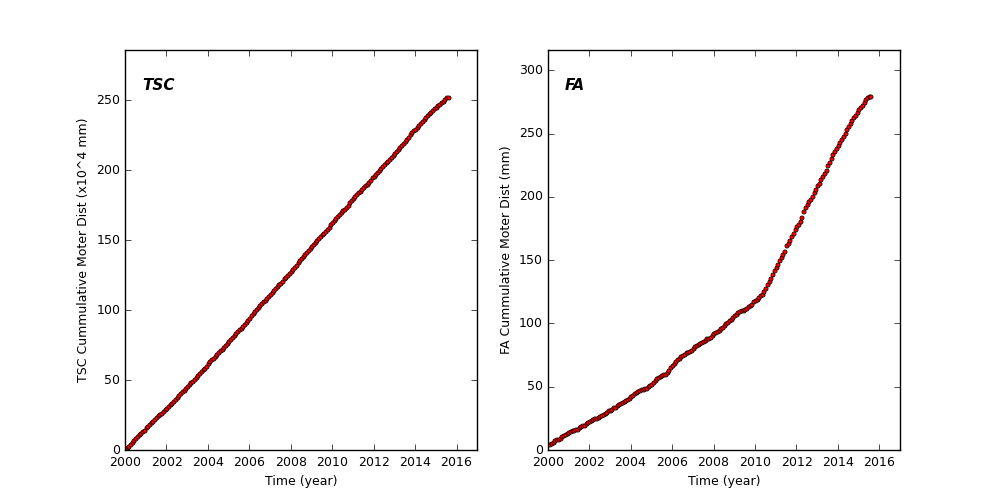
Spacecraft Motions
TSC and FA Cummulative Moter Distance
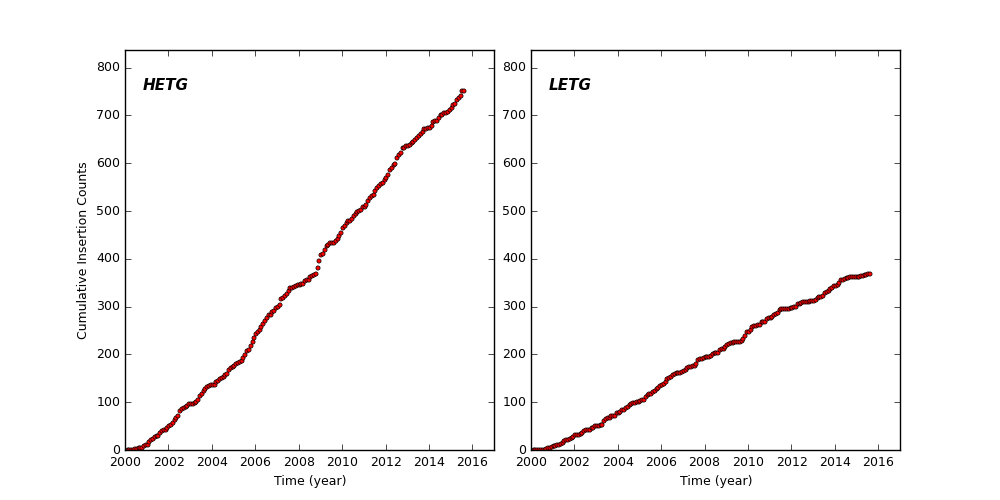
HETG and LETG Cummulative Insertion Counts
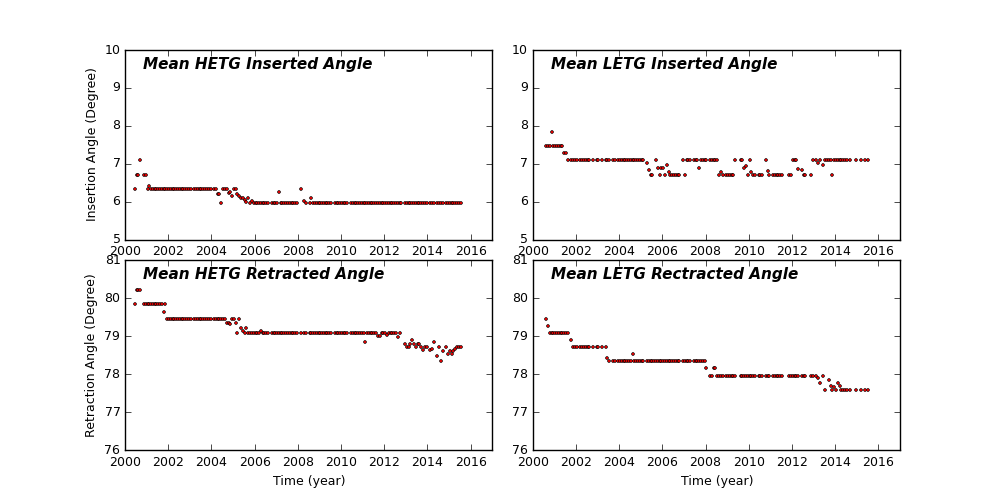
HETG/LETG Insertion/Retraction Angle
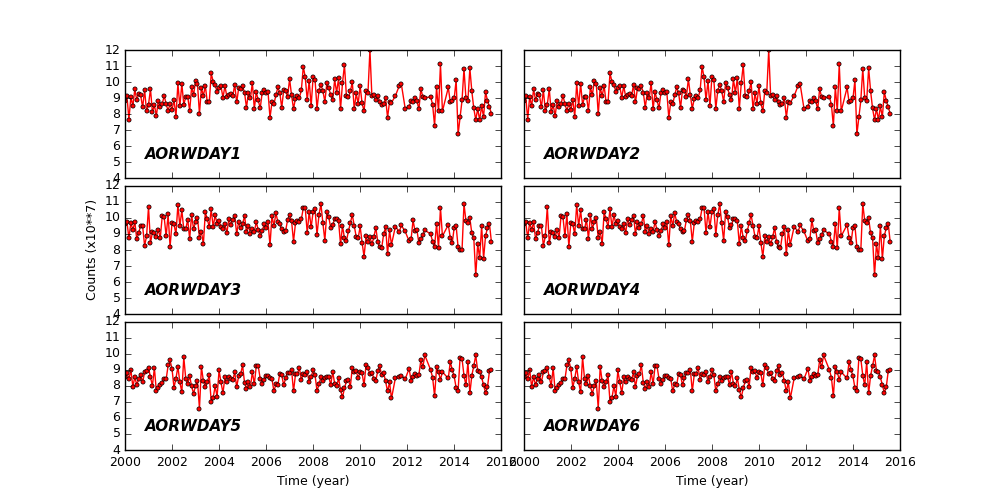
Reaction Wheel Rotations
Links to Past Monthly Reports
| Year | Month | |||||||||||
|---|---|---|---|---|---|---|---|---|---|---|---|---|
| 2015 | Jan | Feb | Mar | Apr | May | Jun | ||||||
| 2014 | Jan | Feb | Mar | Apr | May | Jun | Jul | Aug | Sep | Oct | Nov | Dec |
| 2013 | Jan | Feb | Mar | Apr | May | Jun | Jul | Aug | Sep | Oct | Nov | Dec |
| 2012 | Jan | Feb | Mar | Apr | May | Jun | Jul | Aug | Sep | Oct | Nov | Dec |
| 2011 | Jan | Feb | Mar | Apr | May | Jun | Jul | Aug | Sep | Oct | Nov | Dec |
| 2010 | Jan | Feb | Mar | Apr | May | Jun | Jul | Aug | Sep | Oct | Nov | Dec |
| 2009 | Jan | Feb | Mar | Apr | May | Jun | Jul | Aug | Sep | Oct | Nov | Dec |
| 2008 | Jan | Feb | Mar | Apr | May | Jun | Jul | Aug | Sep | Oct | Nov | Dec |
| 2007 | Jan | Feb | Mar | Apr | May | Jun | Jul | Aug | Sep | Oct | Nov | Dec |
| 2006 | Jan | Feb | Mar | Apr | May | Jun | Jul | Aug | Sep | Oct | Nov | Dec |
| 2005 | Jan | Feb | Mar | Apr | May | Jun | Jul | Aug | Sep | Oct | Nov | Dec |
| 2004 | Jan | Feb | Mar | Apr | May | Jun | Jul | Aug | Sep | Oct | Nov | Dec |
| 2003 | Jan | Feb | Mar | Apr | May | Jun | Jul | Aug | Sep | Oct | Nov | Dec |
| 2002 | Jan | Feb | Mar | Apr | May | Jun | Jul | Aug | Sep | Oct | Nov | Dec |
| 2001 | Jan | Feb | Mar | Apr | May | Jun | Jul | Aug | Sep | Oct | Nov | Dec |
| 2000 | Jan | Feb | Mar | Apr | May | Jun | Jul | Aug | Sep | Oct | Nov | Dec |
| 1999 | Jul | Aug | Sep | Oct | Nov | Dec | ||||||