ACIS
ACIS DOSE Registered-Photon-Map
The steps we took to compute the dose map are;
- Level 1 Event files for a specified month are obtained from archive.
- Image data including I2, I3, S2, S3 CCDs are extracted from all event files.
- All the extracted image data were merged to create a month long exposure map for the month.
- The exposure map is opened with ds9, and check a distribution of count rates against energy. From this, estimate the upper threshold value. Any events beyond this upper threshold are assumed erroneous events such as bad pixels.
- Using this upper threshold, the data is filtered, and create a cleaned exposure map for the month.
- The exposure map from each month from the Sep 1999 is added up to create a cumulative exposure map for each month.
- Using fimgstatistic, we compute count rate statistics for each CCDs.
- For observations with high data drop rates (e.g., Crab nebula, Cas A), we corrected the observations by adding events.
Please check more detail plots at Telemetered Photon Dose Trend page.
)
)
)
Statistics:
# IMAGE     NPIX     MEAN        RMS        MIN     MAX

ACIS_sep16 6004901   6.672       9.322      0.0    1598

I2 node 0  262654   6.342324    3.038907    0.0    42.0
I2 node 1  262654   6.747367    3.454909    0.0   512.0
I2 node 2  262654   6.742986    3.116008    0.0    54.0
I2 node 3  262654   6.853415    3.557645    0.0   434.0

I3 node 0  262654   8.793515    5.141274    0.0    54.0
I3 node 1  262654   8.339890    9.298695    0.0   226.0
I3 node 2  262654   7.530208    3.823541    0.0    76.0
I3 node 3  262654   7.352056    4.529765    0.0  1598.0

S2 node 0  262654   8.332479    3.494617    0.0    56.0
S2 node 1  262654   8.677961    4.068316    0.0    58.0
S2 node 2  262654   9.089017    5.034790    0.0  1550.0
S2 node 3  262654   8.809245    3.829087    0.0   480.0

S3 node 0  262654   10.761397   8.175942    0.0   227.0
S3 node 1  262654   11.997261   6.564314    0.0   289.0
S3 node 2  262654   11.984712   6.397141    0.0   214.0
S3 node 3  262654   10.925187   5.671650    0.0   167.0
)
)
)
Statistics:
 IMAGE     NPIX      MEAN        RMS           MIN      MAX

ACIS_total 6004901   2039.166    2657.752      0.0   116638

I2 node 0  262654   1743.219369  336.852882   356.0   9530.0
I2 node 1  262654   1836.041434  465.426108   371.0  53521.0
I2 node 2  262654      6.742986    3.116008     0.0     54.0
I2 node 3  262654   1867.135682  473.478919   357.0  28264.0

I3 node 0  262654   1972.766603  477.718017   357.0   7695.0
I3 node 1  262654   2061.728925 1569.497620   356.0  39077.0
I3 node 2  262654   1804.805789  328.160029   343.0   9790.0
I3 node 3  262654      7.352056    4.529765     0.0   1598.0

S2 node 0  262654   2378.919175  348.298425  1274.0  21470.0
S2 node 1  262654      8.677961    4.068316     0.0     58.0
S2 node 2  262654   2786.487577  530.286213  1684.0  27400.0
S2 node 3  262654   2721.881814  382.792544  1581.0  47988.0

S3 node 0  262654   4233.742096 1863.759514  1752.0  13909.0
S3 node 1  262654   5411.240340 2147.127182     0.0  14368.0
S3 node 2  262654   4182.446791 1051.681834  1748.0  10071.0
S3 node 3  262654   3240.595682  487.214935  1864.0  10905.0
)
|
)
|
)
|
)
|
| Jun 2016 | Mar 2016 | Dec 2015 | Sep 2015 |
|---|
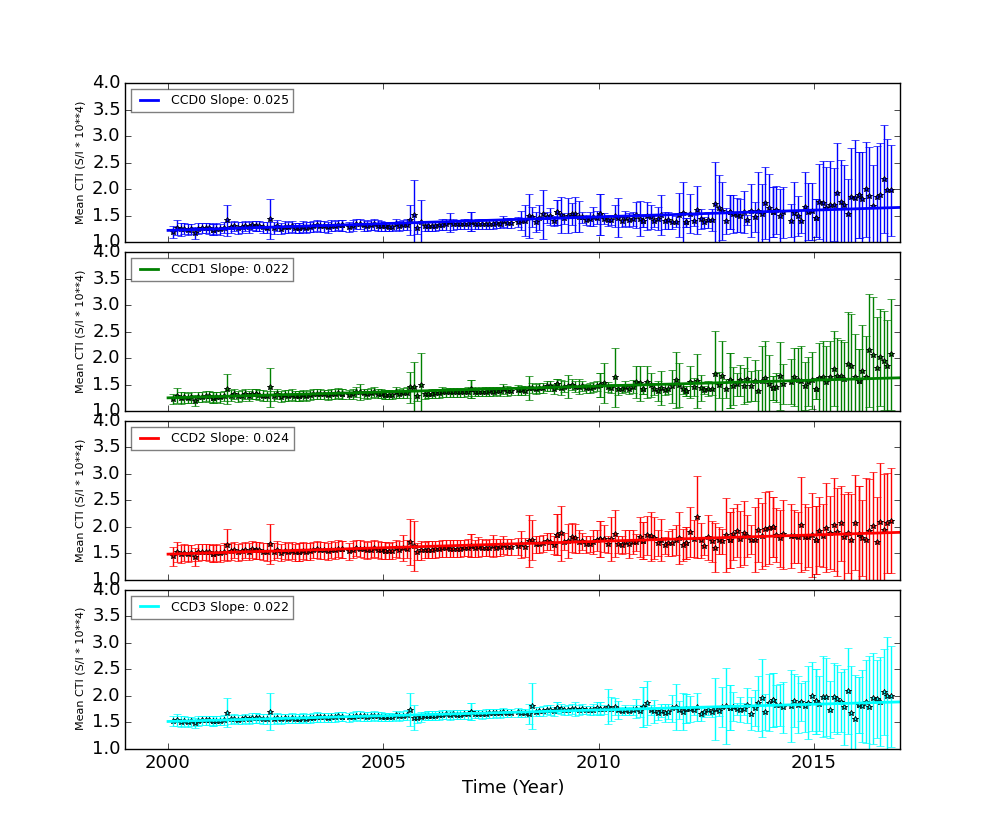
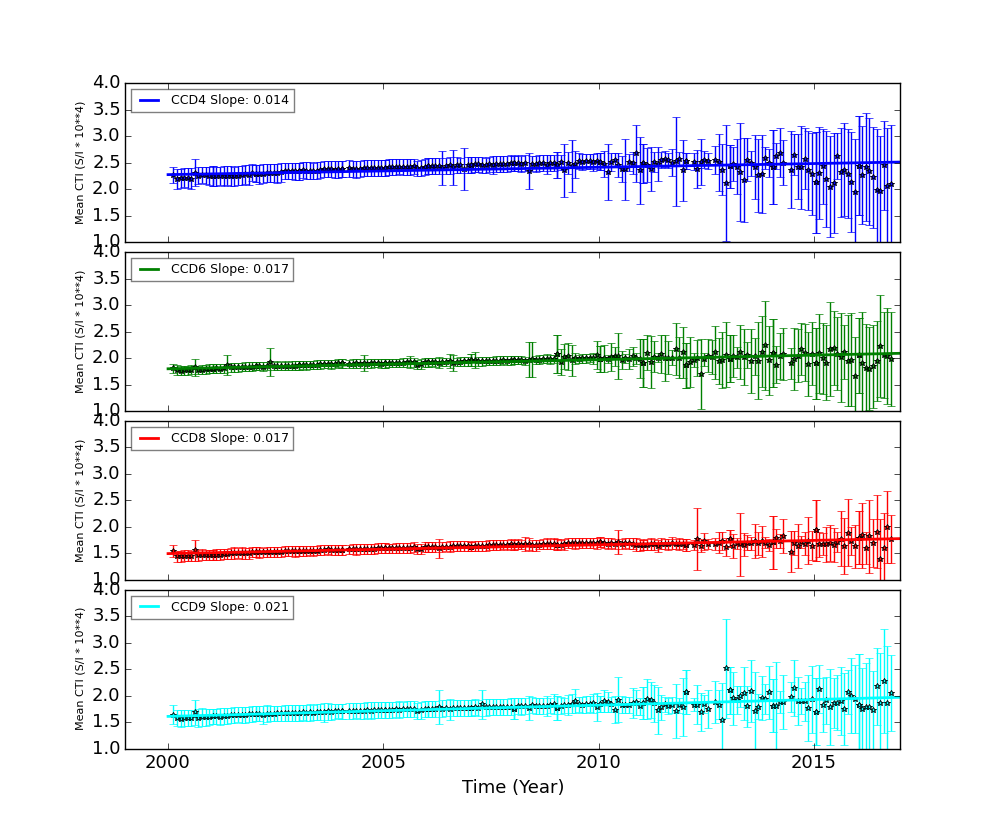
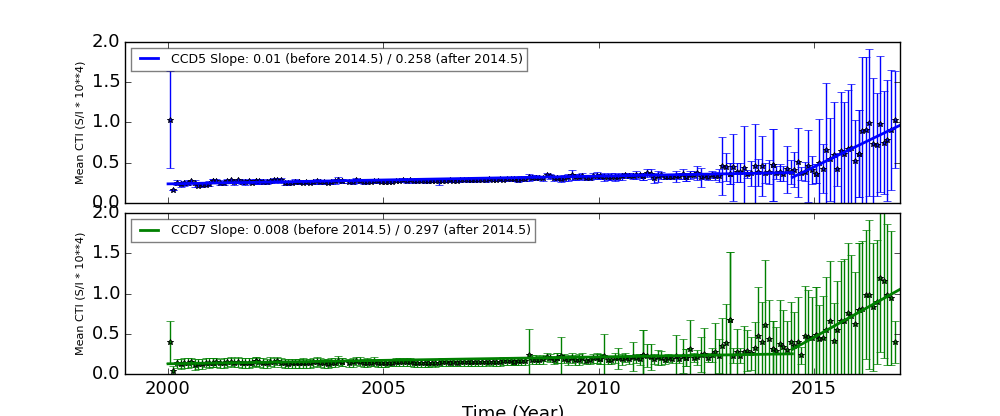
The Mean Detrended CTI
We report CTIs with a refined data definition. CTIs were computed for the temperature dependency corrected data. Please see CTI page for detailed explanation. CTI's are computed for Mn K alpha, and defined as slope/intercept x10^4 of row # vs ADU. Data file: here
Imaging CCDs
Spectral CCDs
Backside CCDs
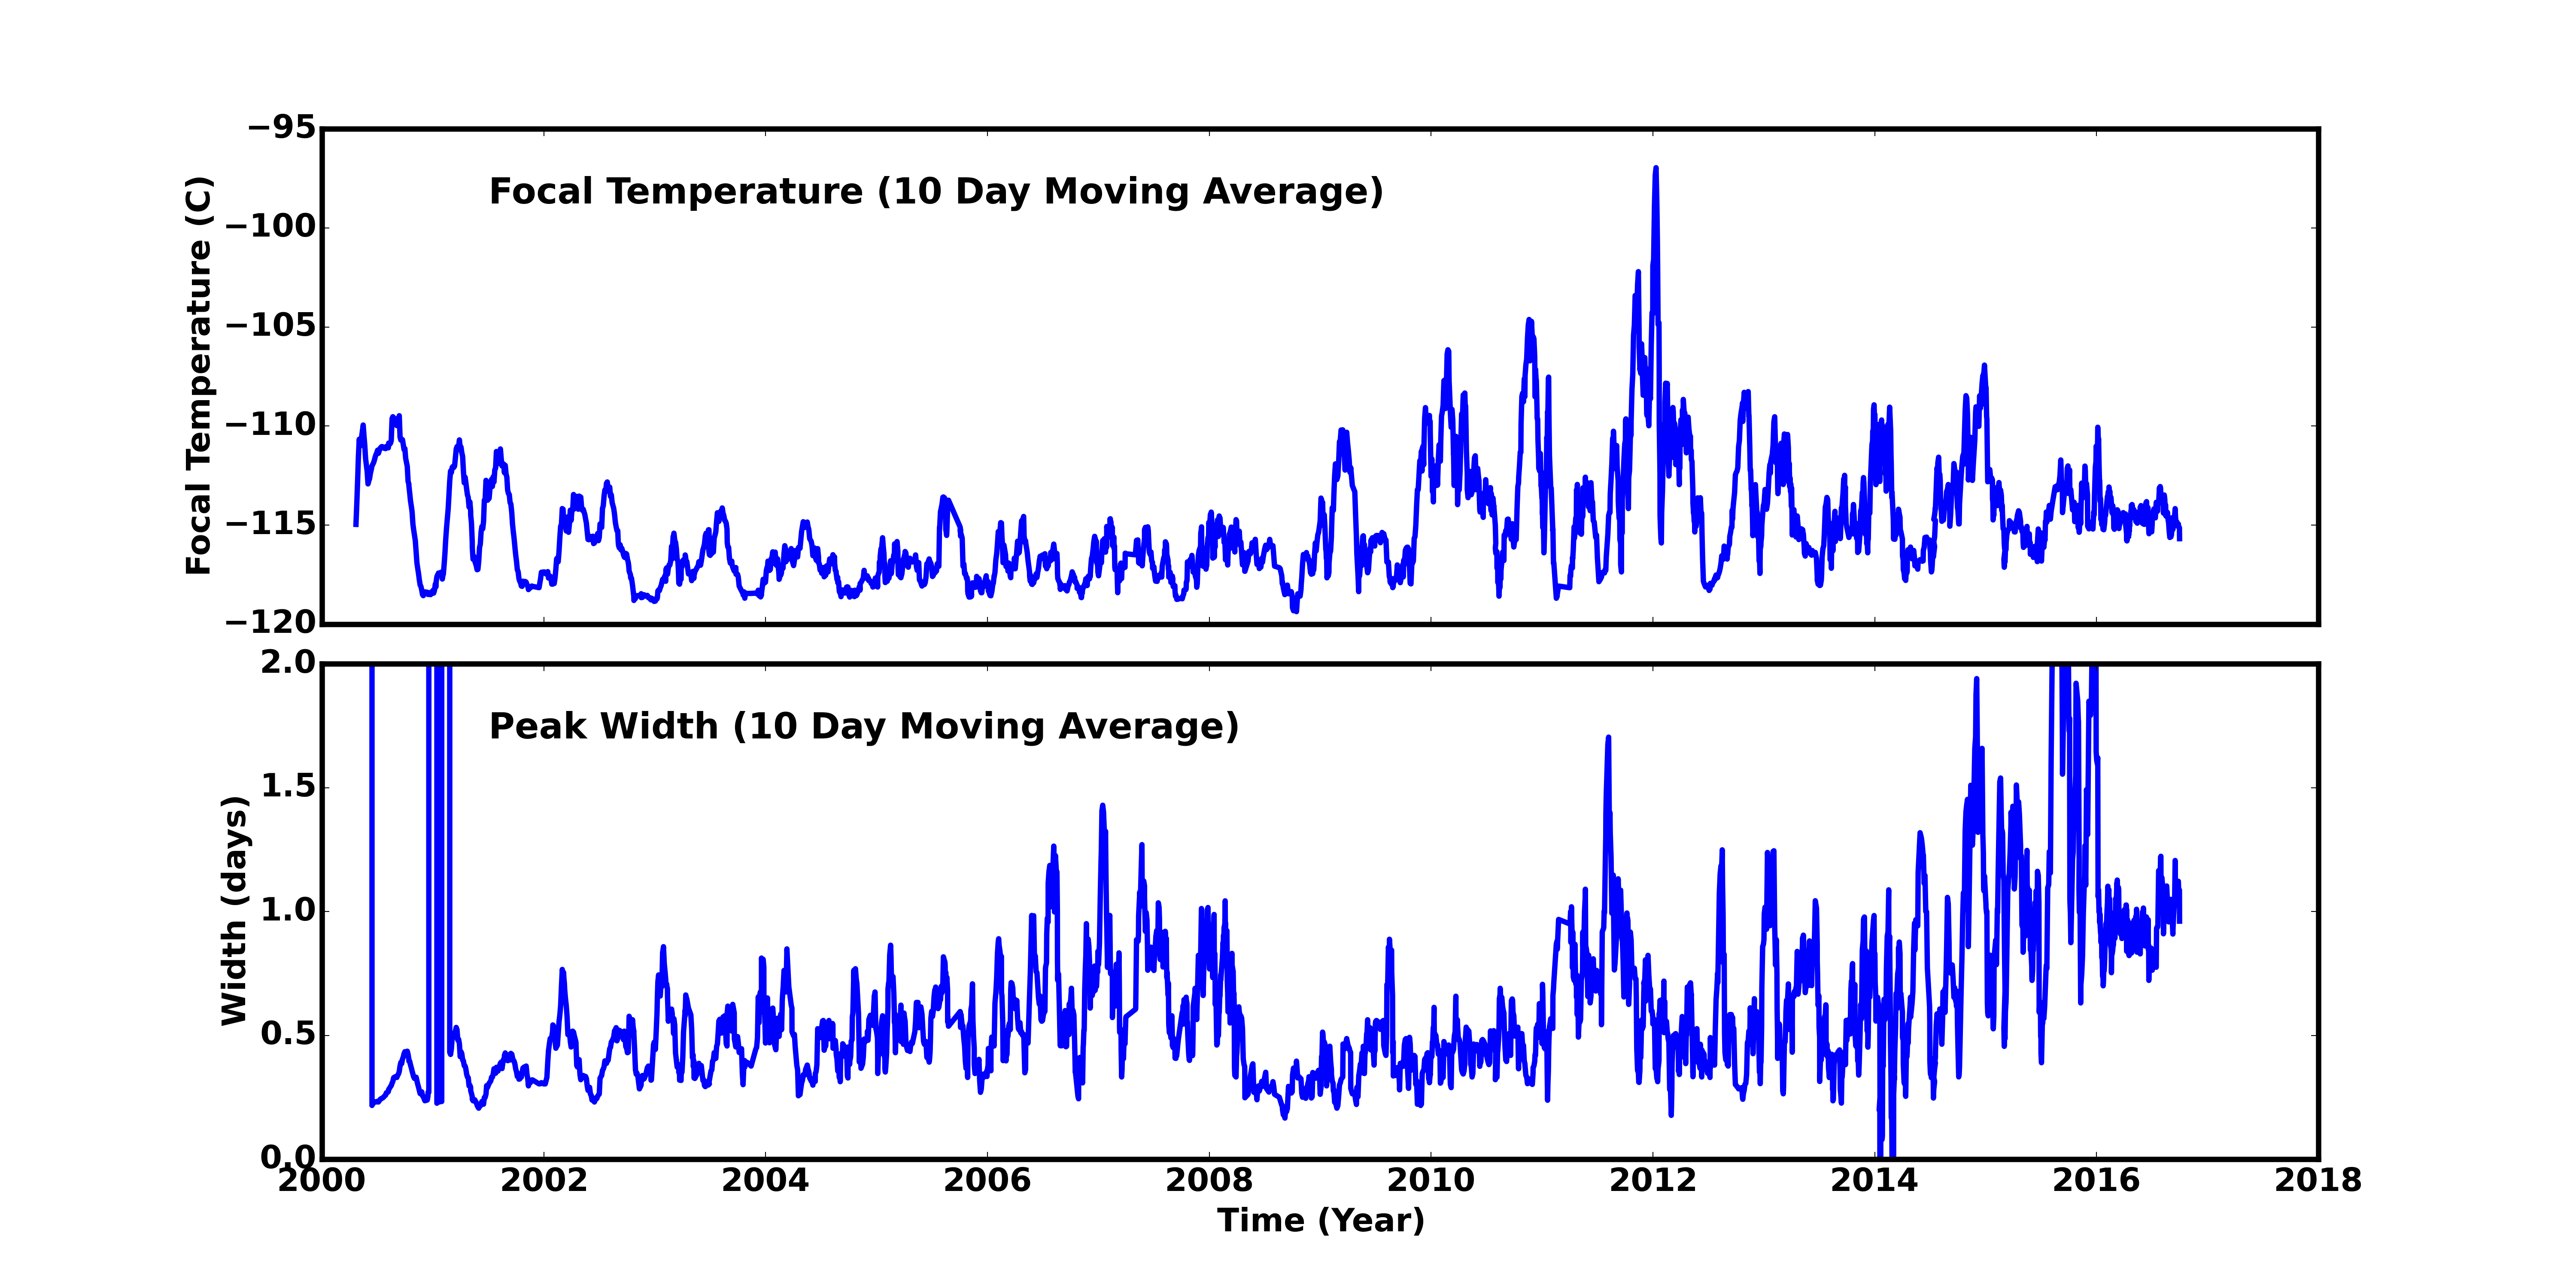
Focal Plane Temperature
Sep 2016 Focal Temperature
| The Mean (max) FPT: | |
|---|---|
| -115.09 | +/- 2.73 C |
| Mean Width: | |
| 0.95 | +/- 0.50 days |
Averaged Focal Plane Temperature
We are using 10 period moving averages to show trends of peak temperatures and peak widths. Note, the gaps in the width plot are due to missing/corrupted data.
Focal Plane Temperature, Sun Angle and Altitude
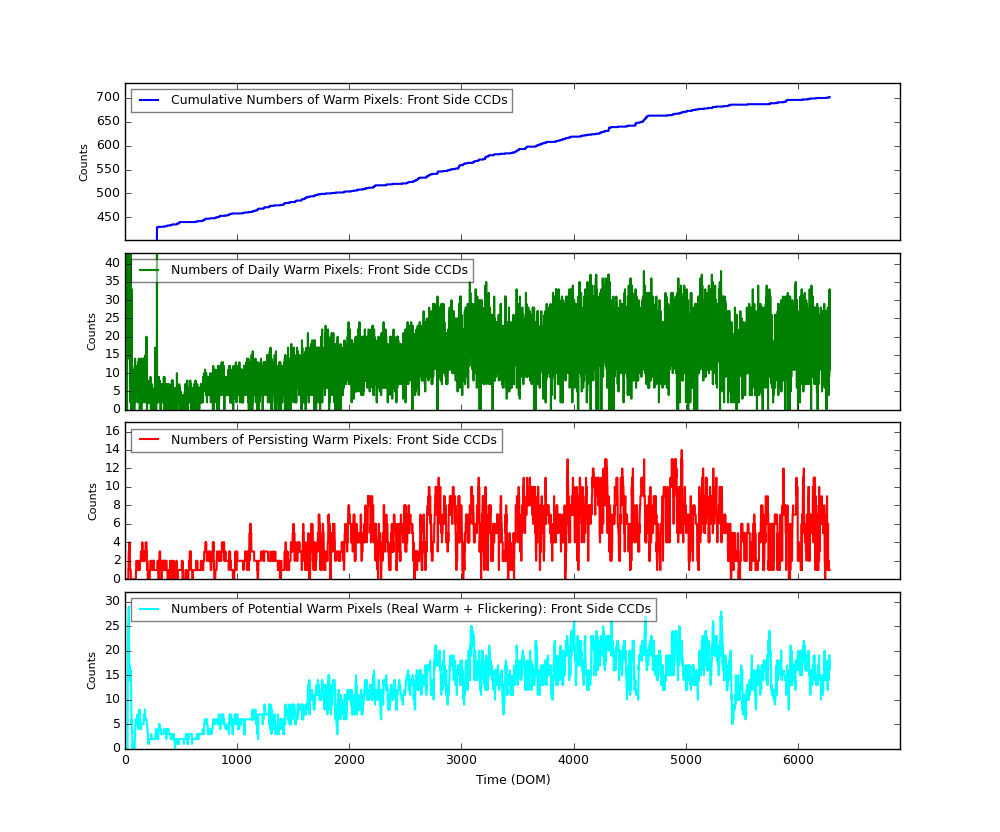
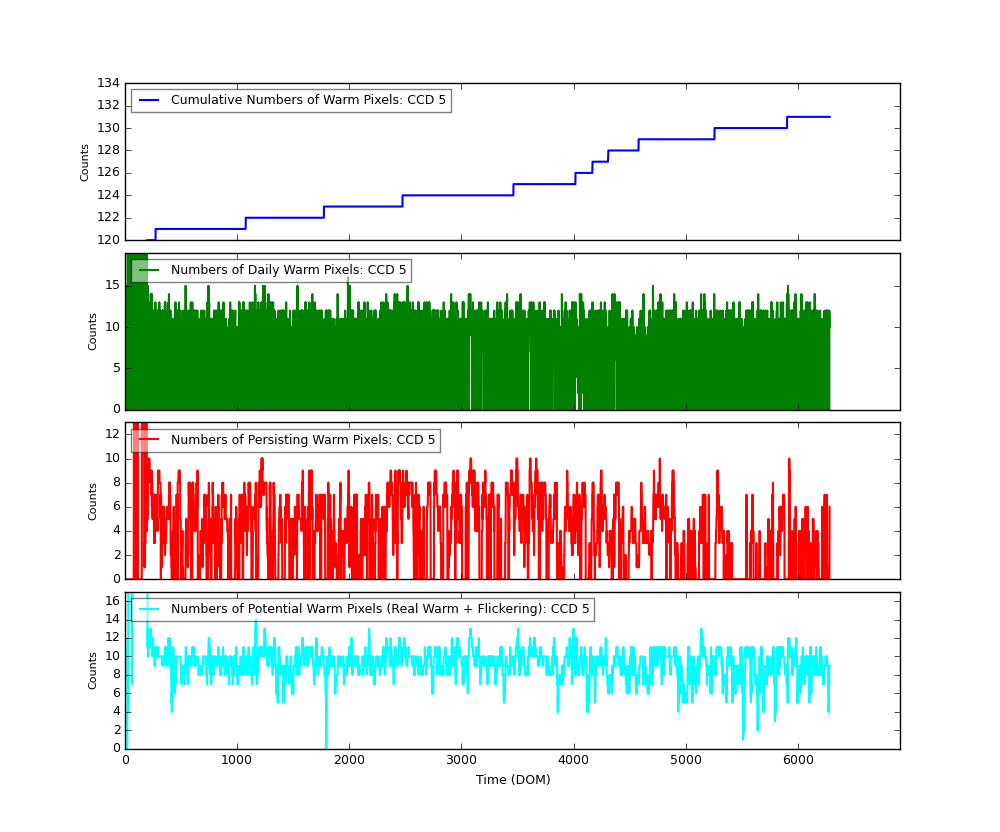
Bad Pixels
The plots below were generated with a new warm pixel finding script. Please see Acis Bad Pixel Page for details.
Front Side CCDs
Back Side CCD (CCD5)
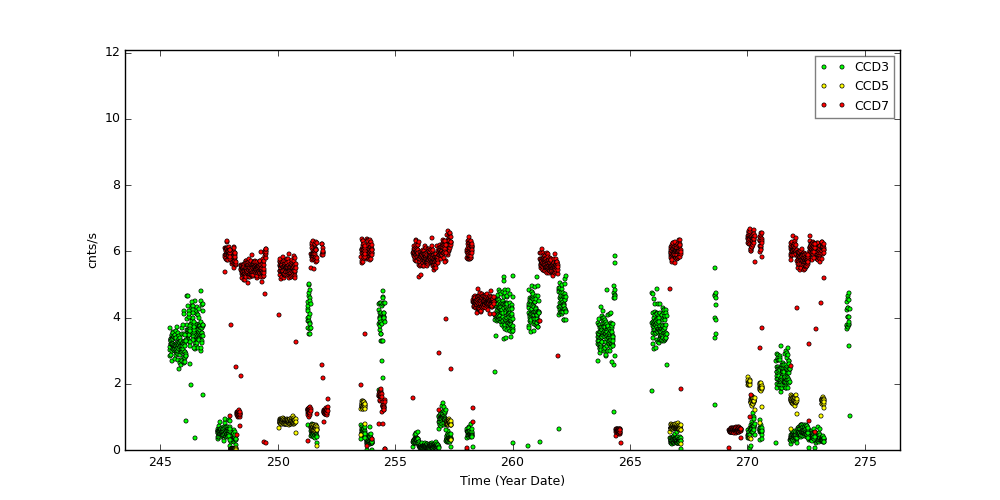
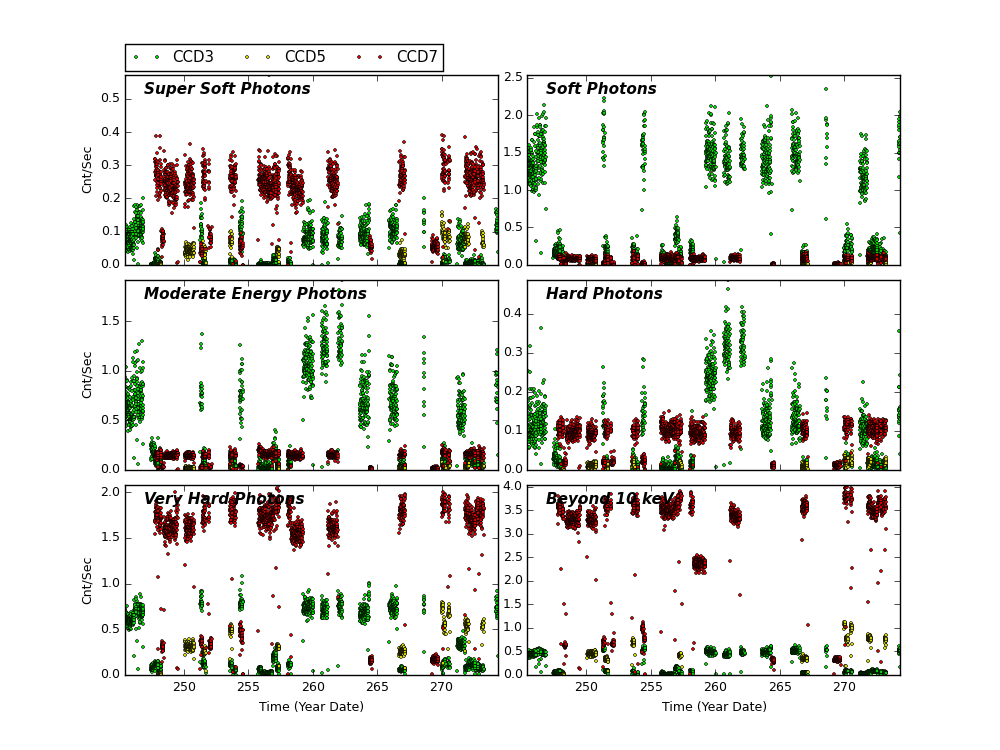
Science Instrument Background Rates
| Name | Low (keV) | High(KeV) | Description |
|---|---|---|---|
| SSoft | 0.00 | 0.50 | Super soft photons |
| Soft | 0.50 | 1.00 | Soft photons |
| Med | 1.00 | 3.00 | Moderate energy photons |
| Hard | 3.00 | 5.00 | Hard Photons |
| Harder | 5.00 | 10.00 | Very Hard photons |
| Hardest | 10.00 | Beyond 10 keV |
ACIS Rejected Events
The links below are plots of stat1 quantities, showing on-board rejected events. The average EVTSENT, DROP_AMP, DROP_POS, DROP_GRD, THR_PIX, and maximum BERR_SUM obtained from L1 acis*stat1.fits files are plotted for each observation. CTI observations are plotted separately from regular science observations.
Column definitions:
- EVTSENT - number of events sent in data record
- DROP_AMP - number of discarded events due to corrected amplitude
- DROP_POS - number of discarded events due to CCD position
- DROP_GRD - number of discarded events due to grade code
- THR_PIX - number of pixels above respective threshold level
- BERR_SUM - number of pixel bias errors so far in science run
Note the half-life decline of the CTI source is clearly evidenced in the steady janline of EVTSENT.
CCD3 CTI Observations
CCD3 Science Observations
CCD7 CTI Observations
CCD7 Science Observations
ACIS Gain Trends
We computed ACIS gain and offset from ACIS event1 files used in CTI computation, following the step described by C. Grant ACIS gain @ -120C page.
Instead computing gains and offsets from individual observations, we combined all data from each month and computed an monthly averaged gain and offset.
The following plots show CCD3 and CCD5 gains and offset trends.
| CCD 3 | |
)
|
)
|
| CCD 5 | |
)
|
)
|
[an error occurred while processing this directive]
HRC
DOSE of Central 4K Pore-Pairs
Please refer to Maximum Dose Trends for more details.
)
|
|---|
        IMAGE                NPIX      MEAN    STDDEV      MIN       MAX
HRCI_09_2016.fits          16777216   0.038    0.2146      0.0       22.0
)
        IMAGE                NPIX      MEAN    STDDEV      MIN       MAX
HRCI_08_1999_09_2016.fits  16777216   4.517    5.020       0.0       292.0
)
|
|---|
     IMAGE                NPIX      MEAN    STDDEV      MIN       MAX
HRCS_09_2016.fits          16777216 0.043   0.2245      0.0       17.0
)
        IMAGE                NPIX     MEAN      STDDEV      MIN      MAX
HRCS_08_1999_09_2016.fits  16777216  16.027     28.583      0.0      1701.0
|
|
Max dose trend plots corrected for events that "pile-up"
in the center of the taps due to bad position information.
|
)
|
)
|
)
|
)
|
| Jun 2016 | Mar 2016 | Dec 2015 | Sep 2015 |
|---|
)
|
)
|
)
|
)
|
| Jun 2016 | Mar 2016 | Dec 2015 | Sep 2015 |
|---|
Gratings
Focus
We plot the width of the zero order streak of ACIS/HETG observations and the width of the zero order image for HRC/LETG observations of point sources. No significant defocusing trend is seen at this time. See Gratings Focus pages.
-->
PCAD
ACA Trending
Gyro Bias Drift
Radiation History
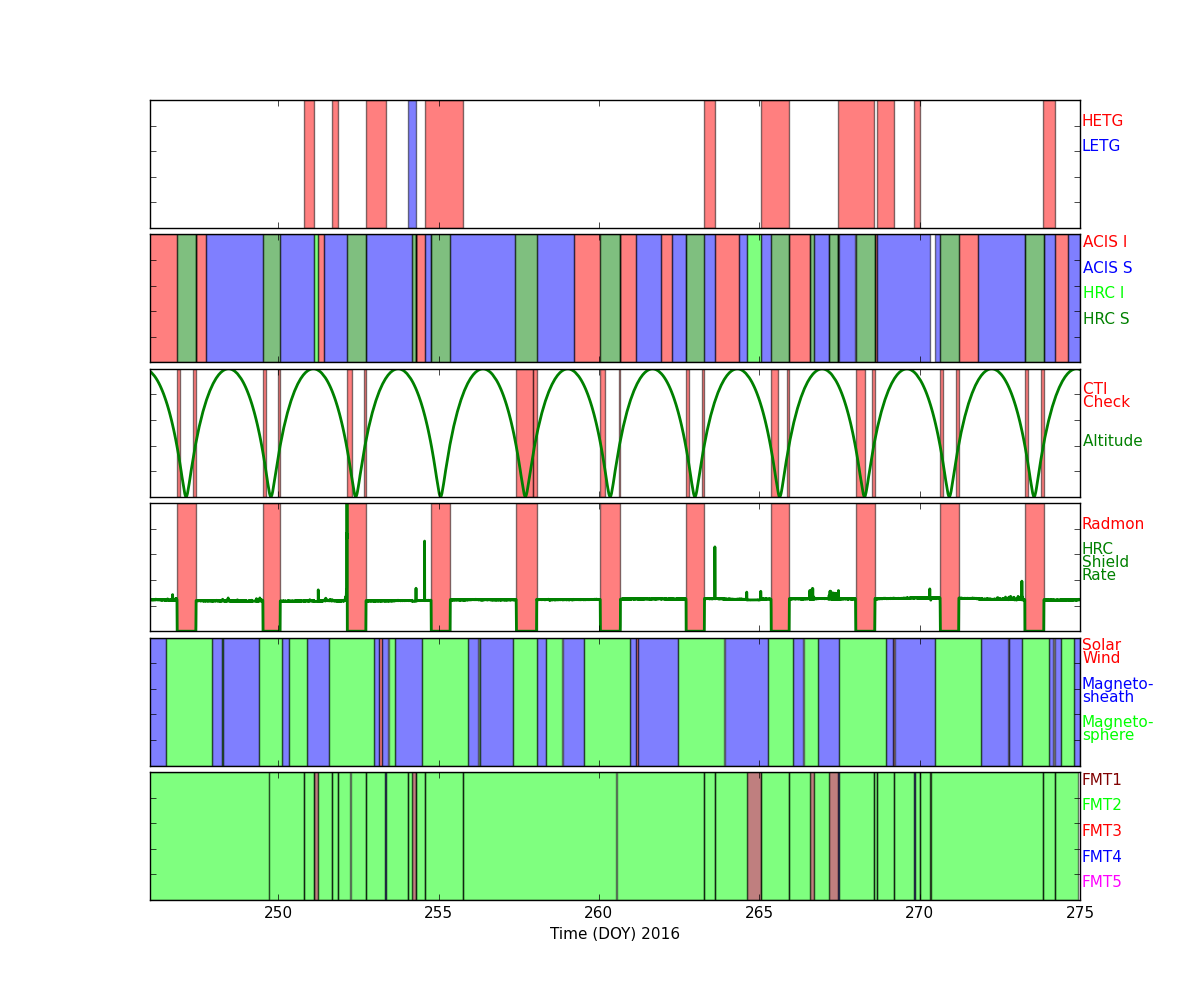
Radiation Zone Timing
Plotted below are radiation zone timing plots based on the following definitions of radiation zone:
- RADZONE - Ephin levels (in any of the E1300,P4GM,P41GM channels) are more than 1/3 of RADMON safing thresholds.
- RADMON - Radmon is disabled for radiation zone (as commanded based on OFLS model, for comparison with actual radiation levels).
- PERIGEE - Time of closest earth approach (for comparison)
Radiation Count Rates of Sep 2016
Sun Spot History
Trending
Critical Trends
| ACIS Temperatures - Daily Maximums | ||||||
|---|---|---|---|---|---|---|
| MSID | MEAN | RMS | DELTA/YR | DELTA/YR/YR | UNITS | DESCRIPTION |
| 1PDEAAT | 305.12 | 8.80 | -4.471e-02 | -6.880e-02 | K | PSMC DEA PS A TEMP |
| 1PIN1AT | 293.68 | 10.38 | 1.262e+00 | 3.853e+00 | K | PSMC TEMP 1A |
)
)
| HRMA Computed Averages - Daily Maximums | ||||||
|---|---|---|---|---|---|---|
| MSID | MEAN | RMS | DELTA/YR | DELTA/YR/YR | UNITS | DESCRIPTION |
| OBAAVG | 292.69 | 1.61 | 8.775e-01 | -1.251e+00 | TEMP | OBA/TFTE |
)
| EPHIN Temperatures - Daily Maximums | ||||||
|---|---|---|---|---|---|---|
| TEIO | 330.03 | 21.15 | 3.417e+00 | 1.953e+00 | K | EPHIN ELECTRONICS HOUSING TEMP |
| TEPHIN | 334.68 | 6.72 | 7.232e-01 | 3.773e+00 | K | EPHIN SENSOR HOUSING TEMP |
)
)
| S/C Main Temperatures - Daily Maximums | ||||||
|---|---|---|---|---|---|---|
| MSID | MEAN | RMS | DELTA/YR | DELTA/YR/YR | UNITS | DESCRIPTION |
| TCYLFMZM | 306.90 | 25.33 | 1.289e+00 | 1.554e+00 | K | CNT CYL TEMP:-Z SIDE UNDER LAE-1 |
| TCYLFMZP | 308.95 | 24.19 | 1.202e+00 | 2.002e+00 | K | CNT CYL TEMP:-Z SIDE UNDER LAE-2 |
)
)
| S/C Ancillary Temperatures - Daily Maximums | ||||||
|---|---|---|---|---|---|---|
| MSID | MEAN | RMS | DELTA/YR | DELTA/YR/YR | UNITS | DESCRIPTION |
| TFSSBKT1 | 342.26 | 18.96 | 2.920e-01 | 1.784e+01 | K | FSS BRACKET-1 TEMP (+Y) |
| TFSSBKT2 | 336.88 | 25.57 | 3.519e-01 | 1.276e+00 | K | FSS BRACKET-2 TEMP (+Y) |
| TSCTSF1 | 304.12 | 3.59 | 1.819e+00 | -8.139e-01 | K | SC-TS FITTING -1 TEMP |
| TSCTSF6 | 306.15 | 4.05 | 1.883e+00 | 3.317e-01 | K | SC-TS FITTING -6 TEMP |
)
)
)
)
| MUPS - Daily Maximums | ||||||
|---|---|---|---|---|---|---|
| MSID | MEAN | RMS | DELTA/YR | DELTA/YR/YR | UNITS | DESCRIPTION |
| PM1THV1T | 333.47 | 8.23 | -2.762e-01 | -1.892e+02 | K | MUPS 1 THRUSTER VALVE 01 TEMP |
| PLINE02T | 317.64 | 11.13 | 3.347e+00 | 5.826e+00 | K | PROP LINE TEMP 02 |
| PLINE03T | 316.64 | 13.64 | 3.278e+00 | 7.846e+00 | K | PROP LINE TEMP 03 |
| PLINE04T | 302.24 | 12.73 | 3.233e+00 | 7.055e+00 | K | PROP LINE TEMP 04 |
)
)
)
)
Quarterly Trends
- Spacecraft Electronics
| Previous Quarter | ||||||
| MSID | MEAN | RMS | DELTA/YR | DELTA/YR/YR | UNITS | DESCRIPTION |
| AWD2TQI | 0.09 | 4.756e-02 | -5.373e-03 | -1.407e+00 | AMP | WHEEL 2 TORQUE CURRENT |
| ELBI | 55.98 | 1.27 | -7.370e-01 | -1.796e+01 | AMP | LOAD BUS CURRENT |
| ELBV | 28.82 | 0.13 | -1.318e+00 | -5.024e+00 | V | LOAD BUS VOLTAGE |
| OHRMAPWR | 48.28 | 2.37 | -1.313e+01 | -3.421e+00 | W | HRMA COMPUTED TOTAL POWER |
| OOBAPWR | 44.47 | 2.40 | -8.514e+00 | -4.856e+01 | W | OBA COMPUTED TOTAL POWER |
)
)
)
)
)
- Spacecraft Electronics Side A
| Previous Quarter | ||||||
| MSID | MEAN | RMS | DELTA/YR | DELTA/YR/YR | UNITS | DESCRIPTION |
| AFLCA2AI | 0.41 | 0.55 | -3.866e-01 | 1.142e+01 | MAMP | FLCA DIODE 2 CURRENT-A |
| AFLCA5AI | 0.55 | 0.51 | -3.044e-01 | 1.239e+01 | MAMP | FLCA DIODE 5 CURRENT-A |
| CPA1PWR | 2.31 | 7.48 | -3.328e+00 | -6.259e+01 | DBM | POWER AMP-1 OUTPUT POWER |
| CPA1V | 0.23 | 0.73 | -3.198e-01 | -6.029e+00 | V | POWER AMP-1 SECONDARY VOLTAGE |
| CPA2PWR | 3.03 | 8.53 | 5.028e+00 | 2.537e+01 | DBM | POWER AMP-2 OUTPUT POWER |
| CPA2V | 0.29 | 0.82 | 4.796e-01 | 1.387e+00 | V | POWER AMP-2 SECONDARY VOLTAGE |
)
)
)
)
)
)
- Spacecraft Electronics Side B
| Previous Quarter | ||||||
| MSID | MEAN | RMS | DELTA/YR | DELTA/YR/YR | UNITS | DESCRIPTION |
| AIOBP5CV | 0.64 | 9.636e-03 | -4.728e-02 | -5.665e-01 | V | IOE B +5V CONVERTER VOLTAGE |
| ASPEB5CV | 0.64 | 7.953e-03 | -2.467e-02 | 4.850e-01 | V | SPE-B +5V CONVERTER VOLTAGE |
| CXO5VOBB | 5.04 | 4.124e-06 | -1.609e-06 | -6.247e-06 | V | XO 5V OBC-B |
| EIACVBV | 5.29 | 3.988e-03 | 7.553e-03 | 1.789e-01 | V | EIA CONV B ANALOG TLM |
)
)
)
)
Envelope Trending
DEAHK Temperature
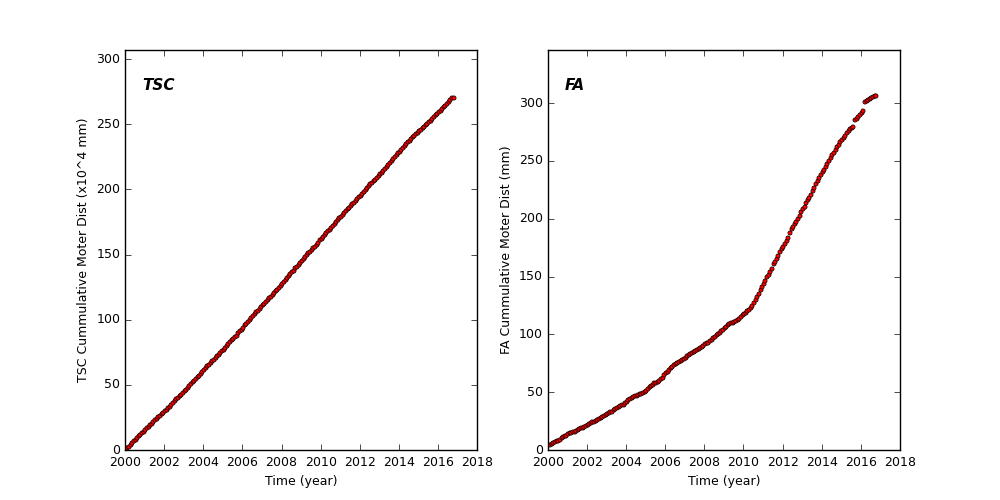
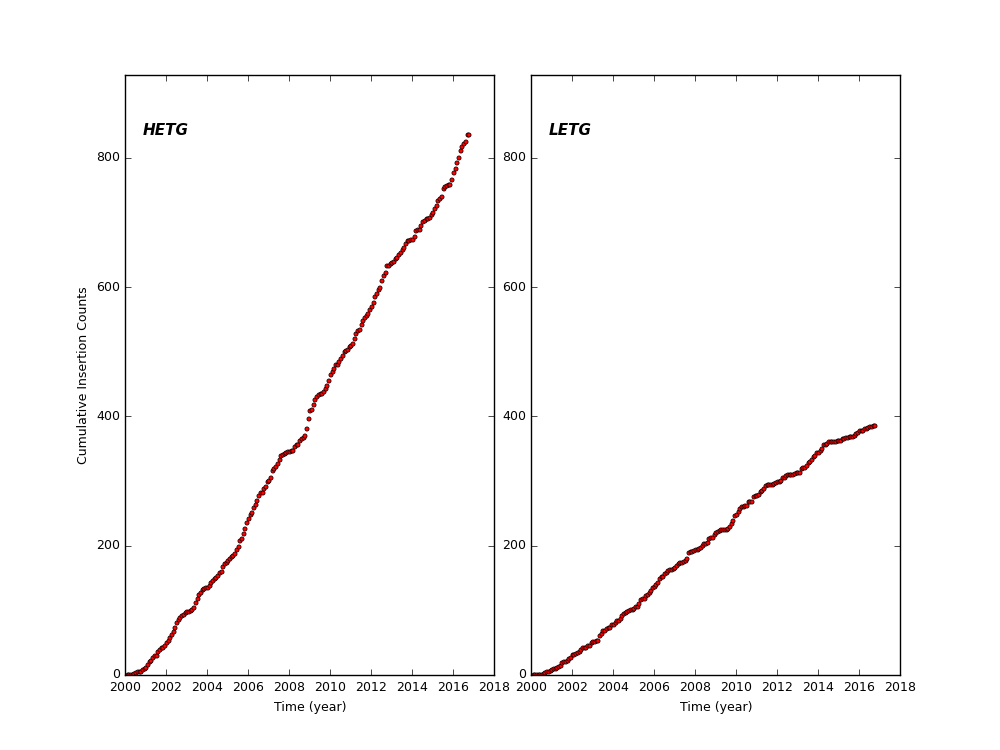
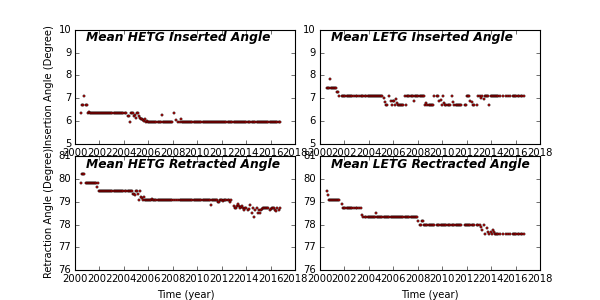
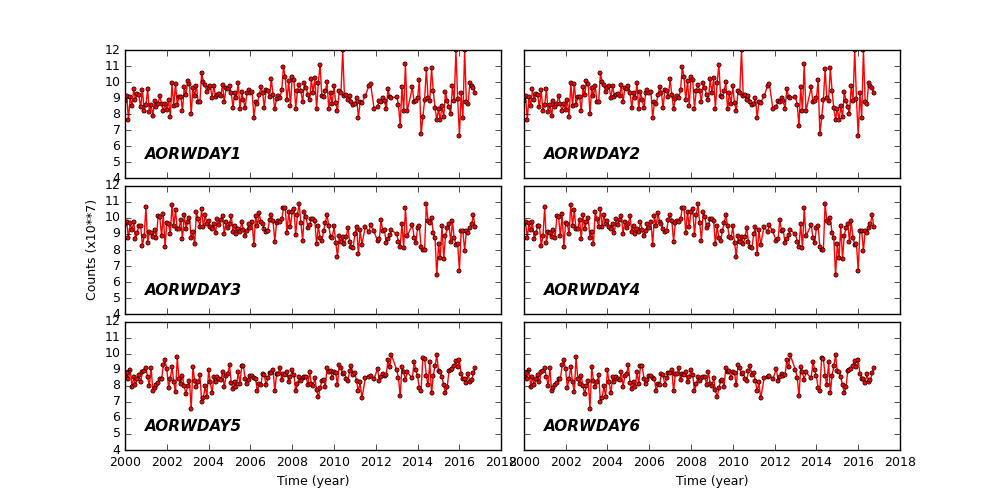
Spacecraft Motions
TSC and FA Cummulative Moter Distance
HETG and LETG Cummulative Insertion Counts
HETG/LETG Insertion/Retraction Angle
Reaction Wheel Rotations
Links to Past Monthly Reports
| Year | Month | |||||||||||
|---|---|---|---|---|---|---|---|---|---|---|---|---|
| 2016 | Jan | Feb | Mar | Apr | May | Jun | Jul | Aug | ||||
| 2015 | Jan | Feb | Mar | Apr | May | Jun | Jul | Aug | Sep | Oct | Nov | Dec |
| 2014 | Jan | Feb | Mar | Apr | May | Jun | Jul | Aug | Sep | Oct | Nov | Dec |
| 2013 | Jan | Feb | Mar | Apr | May | Jun | Jul | Aug | Sep | Oct | Nov | Dec |
| 2012 | Jan | Feb | Mar | Apr | May | Jun | Jul | Aug | Sep | Oct | Nov | Dec |
| 2011 | Jan | Feb | Mar | Apr | May | Jun | Jul | Aug | Sep | Oct | Nov | Dec |
| 2010 | Jan | Feb | Mar | Apr | May | Jun | Jul | Aug | Sep | Oct | Nov | Dec |
| 2009 | Jan | Feb | Mar | Apr | May | Jun | Jul | Aug | Sep | Oct | Nov | Dec |
| 2008 | Jan | Feb | Mar | Apr | May | Jun | Jul | Aug | Sep | Oct | Nov | Dec |
| 2007 | Jan | Feb | Mar | Apr | May | Jun | Jul | Aug | Sep | Oct | Nov | Dec |
| 2006 | Jan | Feb | Mar | Apr | May | Jun | Jul | Aug | Sep | Oct | Nov | Dec |
| 2005 | Jan | Feb | Mar | Apr | May | Jun | Jul | Aug | Sep | Oct | Nov | Dec |
| 2004 | Jan | Feb | Mar | Apr | May | Jun | Jul | Aug | Sep | Oct | Nov | Dec |
| 2003 | Jan | Feb | Mar | Apr | May | Jun | Jul | Aug | Sep | Oct | Nov | Dec |
| 2002 | Jan | Feb | Mar | Apr | May | Jun | Jul | Aug | Sep | Oct | Nov | Dec |
| 2001 | Jan | Feb | Mar | Apr | May | Jun | Jul | Aug | Sep | Oct | Nov | Dec |
| 2000 | Jan | Feb | Mar | Apr | May | Jun | Jul | Aug | Sep | Oct | Nov | Dec |
| 1999 | Jul | Aug | Sep | Oct | Nov | Dec | ||||||