ACIS
ACIS DOSE Registered-Photon-Map
The steps we took to compute the dose map are;
- Level 1 Event files for a specified month are obtained from archive.
- Image data including I2, I3, S2, S3 CCDs are extracted from all event files.
- All the extracted image data were merged to create a month long exposure map for the month.
- The exposure map is opened with ds9, and check a distribution of count rates against energy. From this, estimate the upper threshold value. Any events beyond this upper threshold are assumed erroneous events such as bad pixels.
- Using this upper threshold, the data is filtered, and create a cleaned exposure map for the month.
- The exposure map from each month from the Sep 1999 is added up to create a cumulative exposure map for each month.
- Using fimgstatistic, we compute count rate statistics for each CCDs.
- For observations with high data drop rates (e.g., Crab nebula, Cas A), we corrected the observations by adding events.
Please check more detail plots at Telemetered Photon Dose Trend page.
)
)
)
Statistics:
# IMAGE     NPIX     MEAN        RMS        MIN     MAX
ACIS_aug17 6004901       8.364         29.287           0.0     5552


I2 node 0  262654	9.882037	4.051841	0.0	 96.0
I2 node 1  262654	10.367421	7.478422	0.0	2614.0
I2 node 2  262654	10.161945	4.011220	0.0	106.0
I2 node 3  262654	10.184233	7.006918	0.0	2346.0

I3 node 0  262654	10.557823	9.911892	0.0	4547.0
I3 node 1  262654	11.090547	8.783191	0.0	2092.0
I3 node 2  262654	9.987559	3.902702	0.0	 92.0
I3 node 3  262654	10.074555	4.720405	0.0	1283.0

S2 node 0  262654	6.648227	5.435089	0.0	380.0
S2 node 1  262654	7.049560	7.241540	0.0	526.0
S2 node 2  262654	8.557755	14.195049	0.0	601.0
S2 node 3  262654	10.498879	29.237717	0.0	4190.0

S3 node 0  262654	20.365816	118.709293	0.0	5552.0
S3 node 1  262654	14.850082	23.428352	0.0	490.0
S3 node 2  262654	14.986952	25.369265	0.0	376.0
S3 node 3  262654	12.280252	16.044098	0.0	299.0
)
)
)
Statistics:
 IMAGE     NPIX      MEAN        RMS           MIN      MAX
ACIS_total   6004901       2131.040         2767.497           0.0   120723


I2 node 0  262654	1832.620941	357.866088	376.0	10200.0
I2 node 1  262654	1929.674149	497.318373	397.0	67697.0
I2 node 2  262654	10.161945	4.011220	0.0	106.0
I2 node 3  262654	1967.332658	506.126726	384.0	28399.0

I3 node 0  262654	2080.560782	513.989783	381.0	8146.0
I3 node 1  262654	2163.619301	1629.170372	390.0	50737.0
I3 node 2  262654	1897.914721	348.072977	369.0	10516.0
I3 node 3  262654	10.074555	4.720405	0.0	1283.0

S2 node 0  262654	2474.975900	363.359733	1321.0	21605.0
S2 node 1  262654	7.049560	7.241540	0.0	526.0
S2 node 2  262654	2908.281464	544.651118	1727.0	27544.0
S2 node 3  262654	2854.921447	401.591421	1624.0	50622.0

S3 node 0  262654	4418.271293	1996.980726	1798.0	22810.0
S3 node 1  262654	5611.390044	2177.201346	0.0	14488.0
S3 node 2  262654	4380.047357	1093.605190	1824.0	10453.0
S3 node 3  262654	3370.269966	501.153104	1942.0	11133.0
)
|
)
|
)
|
)
|
| May 2017 | Feb 2017 | Nov 2016 | Aug 2016 |
|---|
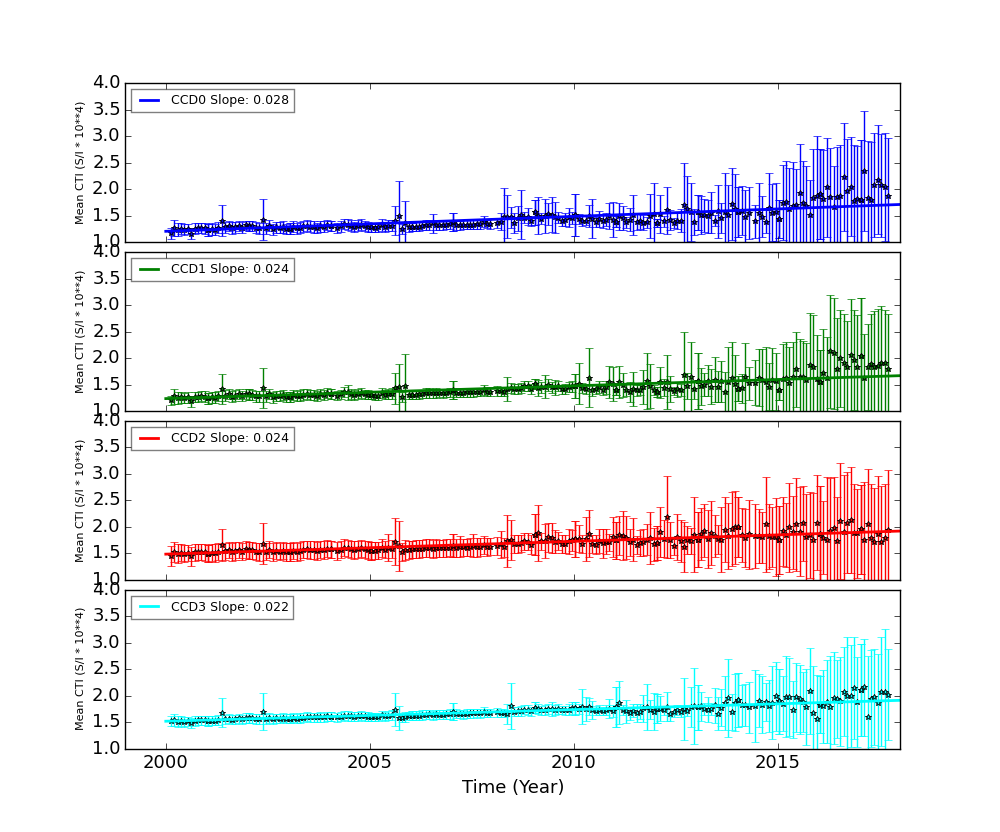
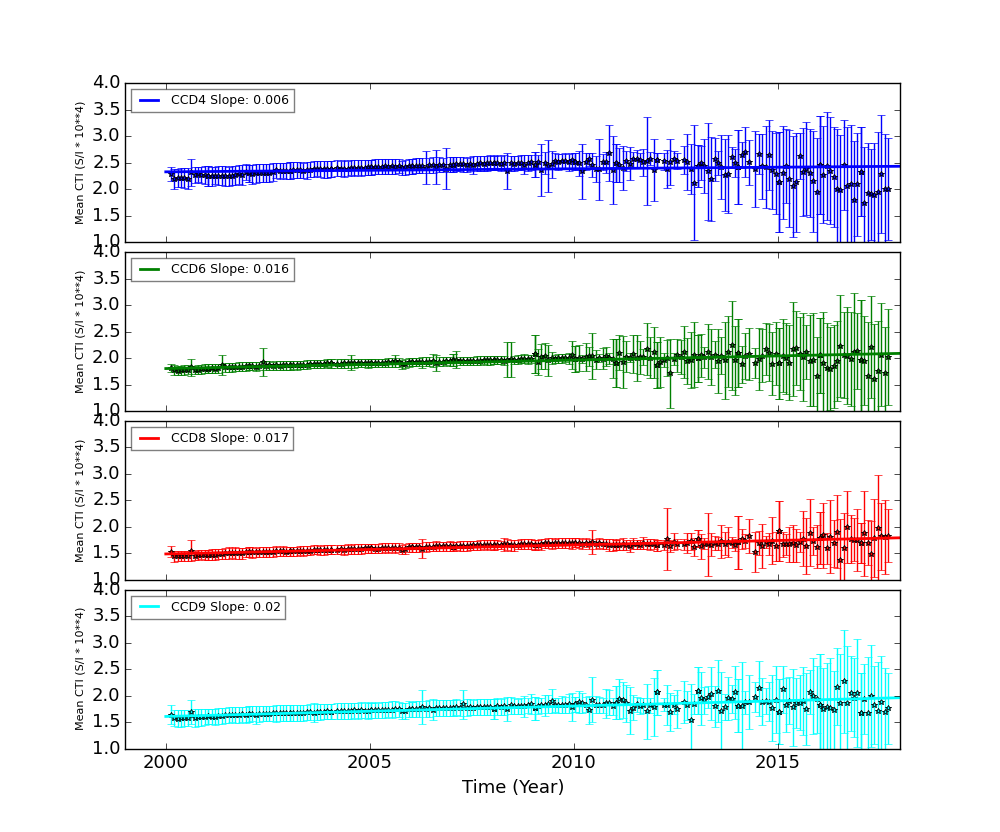
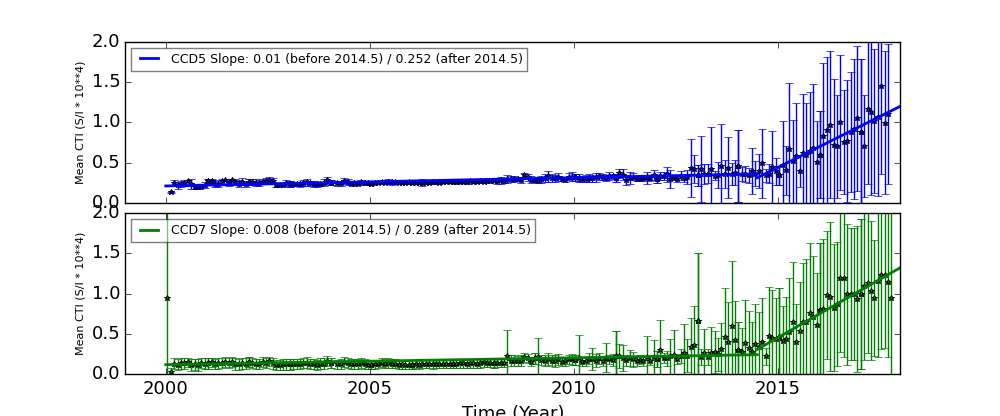
The Mean Detrended CTI
We report CTIs with a refined data definition. CTIs were computed for the temperature dependency corrected data. Please see CTI page for detailed explanation. CTI's are computed for Mn K alpha, and defined as slope/intercept x10^4 of row # vs ADU. Data file: here
Imaging CCDs
Spectral CCDs
Backside CCDs
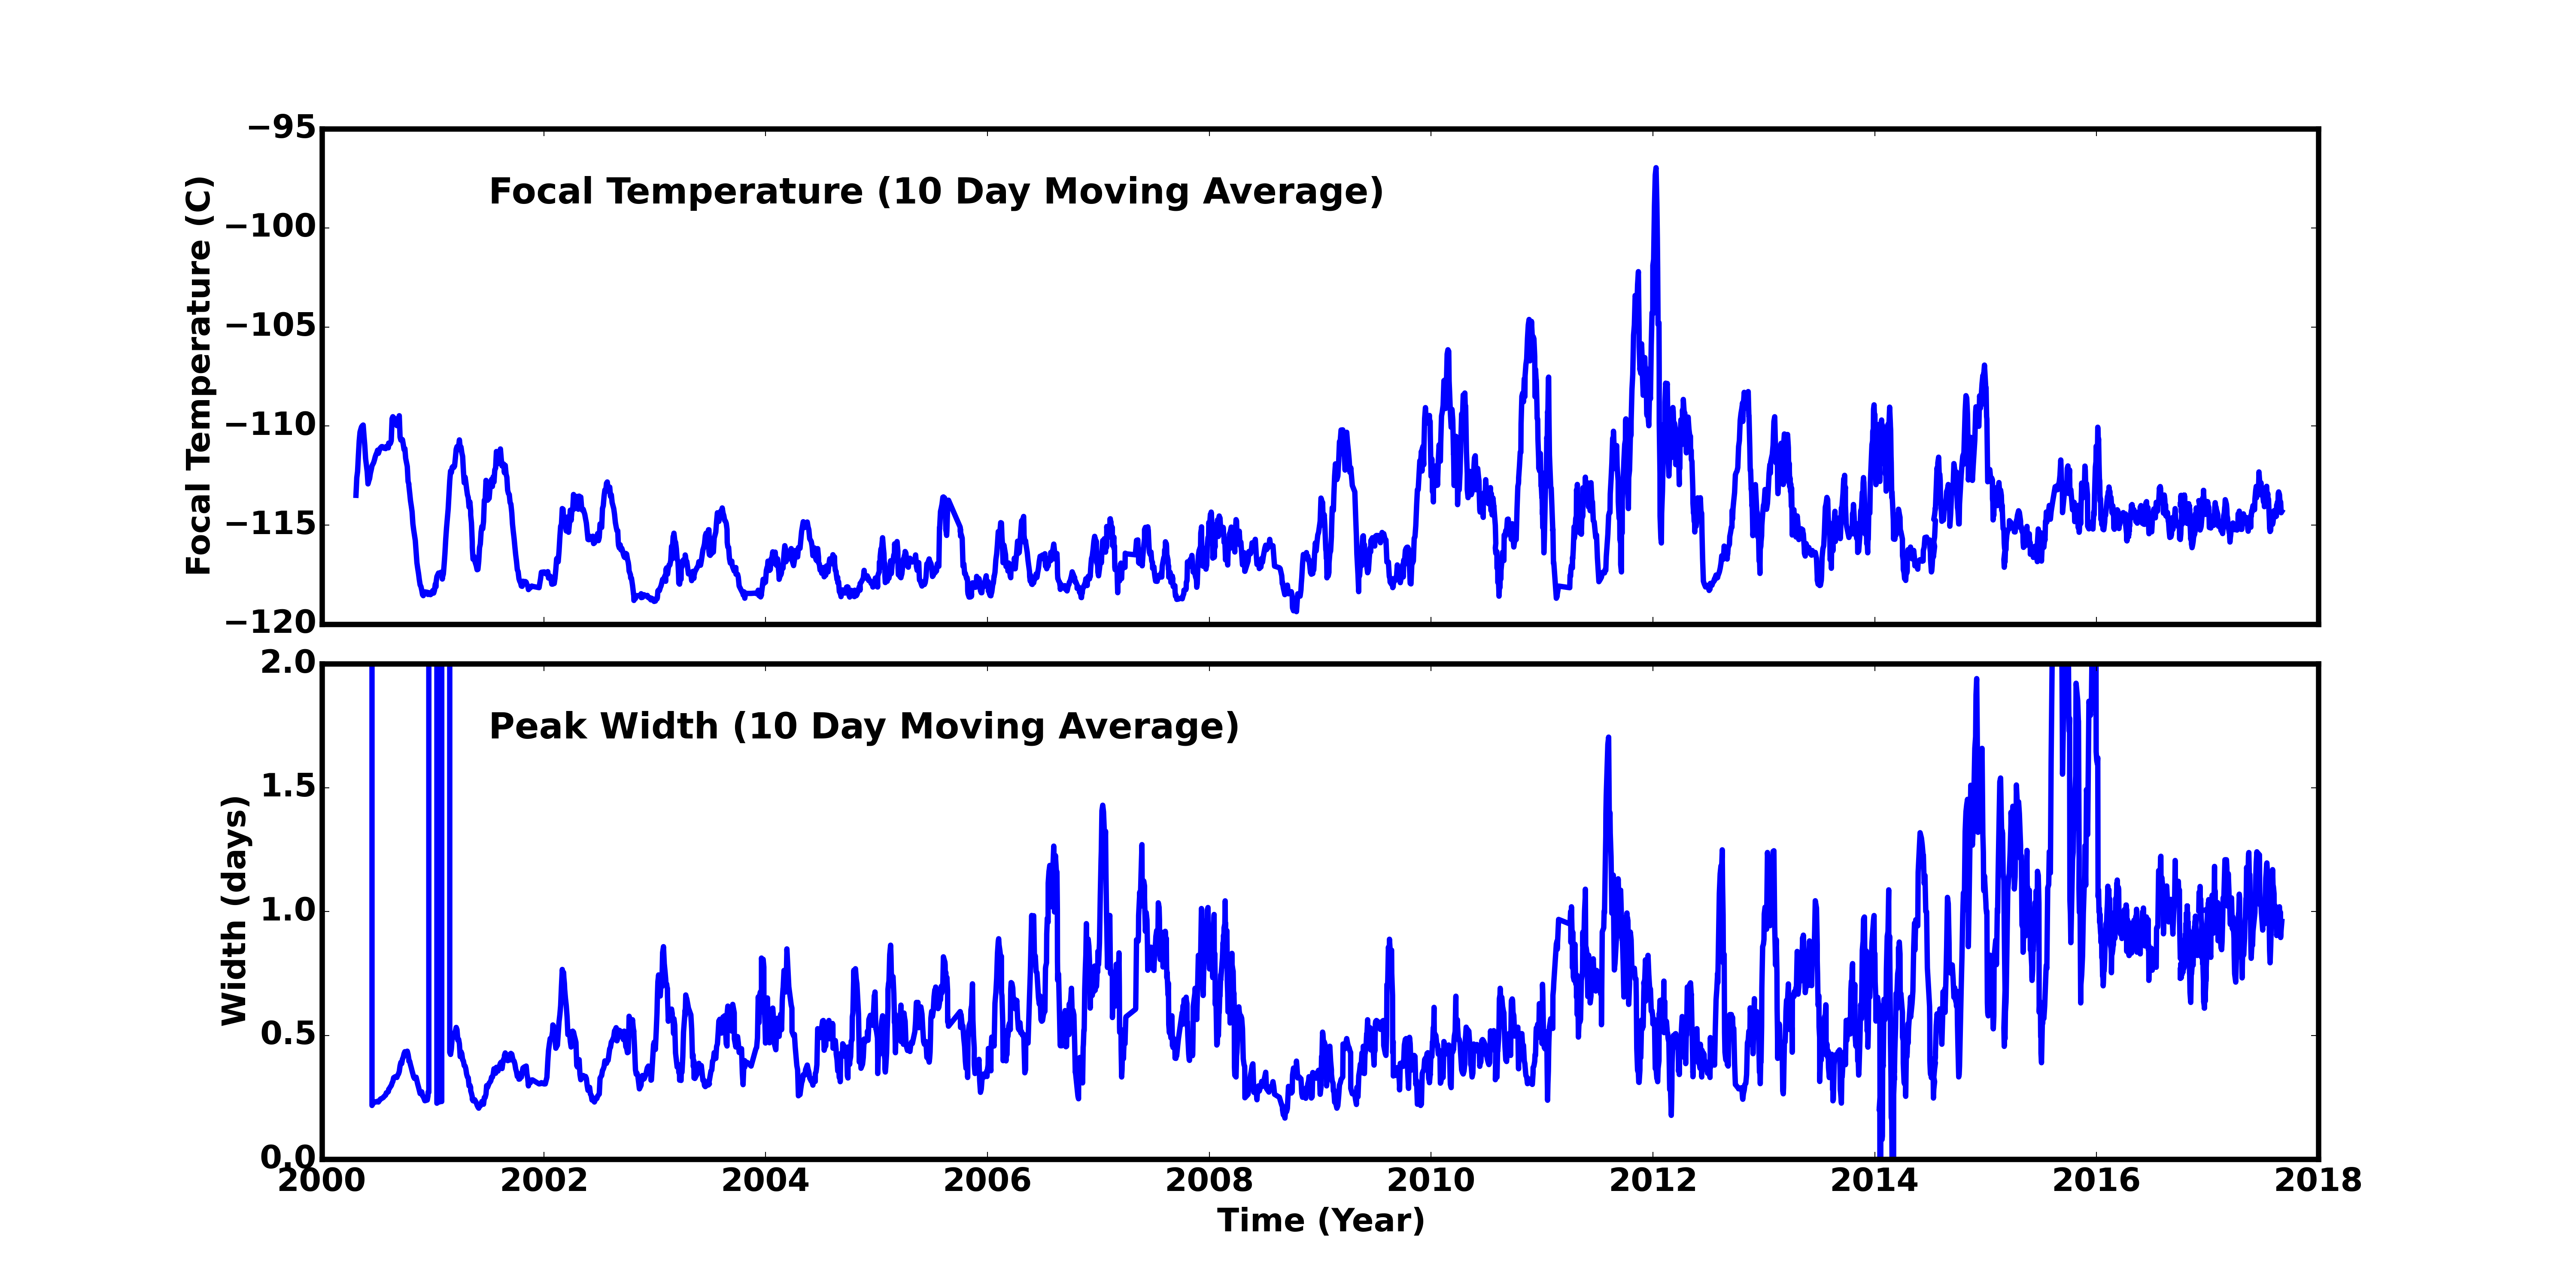
Focal Plane Temperature
Aug 2017 Focal Temperature
| The Mean (max) FPT: | |
|---|---|
| -114.17 | +/- 2.09 C |
| Mean Width: | |
| 0.95 | +/- 0.37 days |
Averaged Focal Plane Temperature
We are using 10 period moving averages to show trends of peak temperatures and peak widths. Note, the gaps in the width plot are due to missing/corrupted data.
Focal Plane Temperature, Sun Angle and Altitude
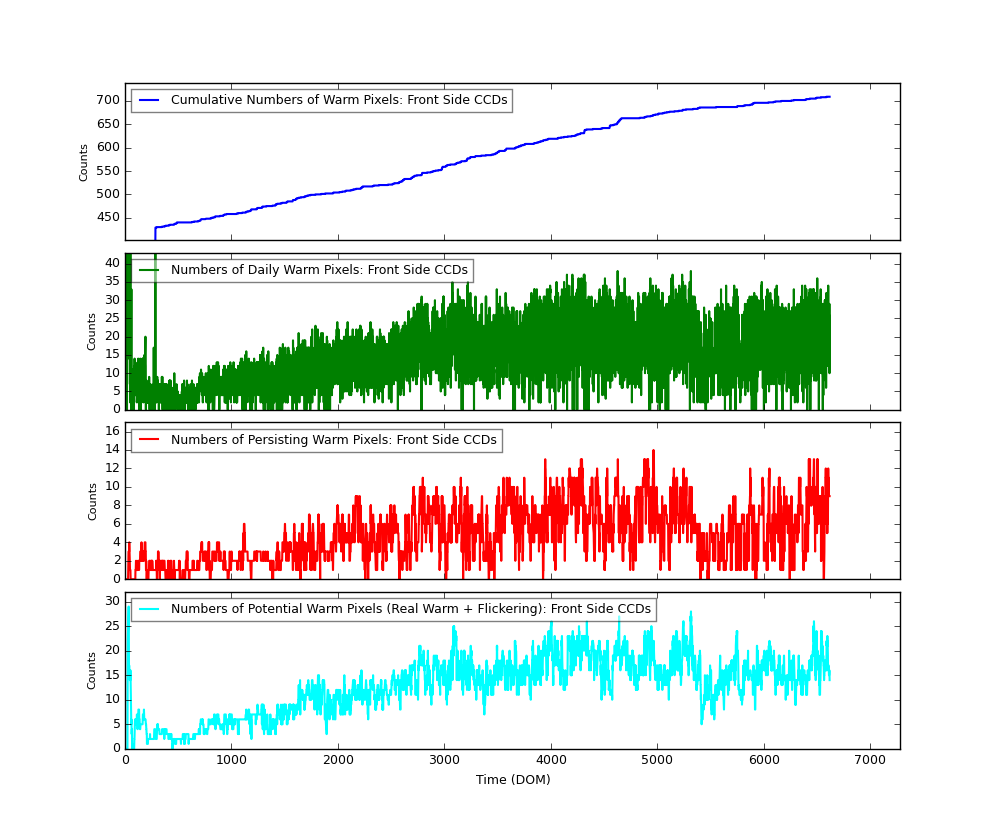
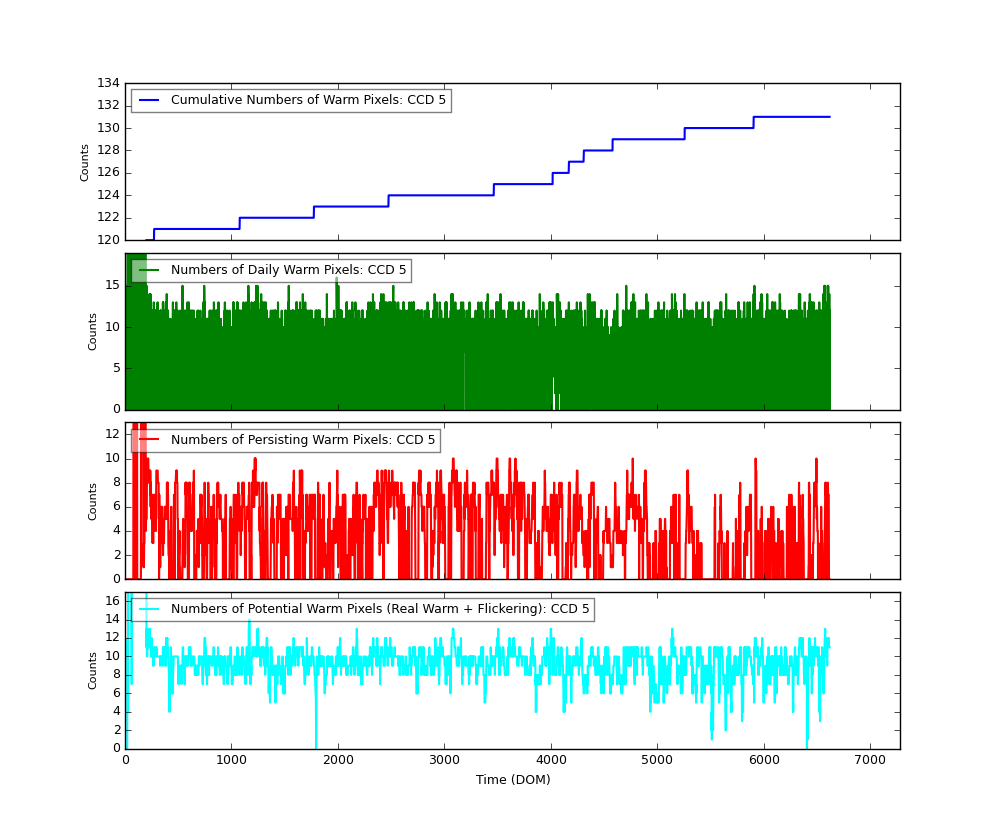
Bad Pixels
The plots below were generated with a new warm pixel finding script. Please see Acis Bad Pixel Page for details.
Front Side CCDs
Back Side CCD (CCD5)
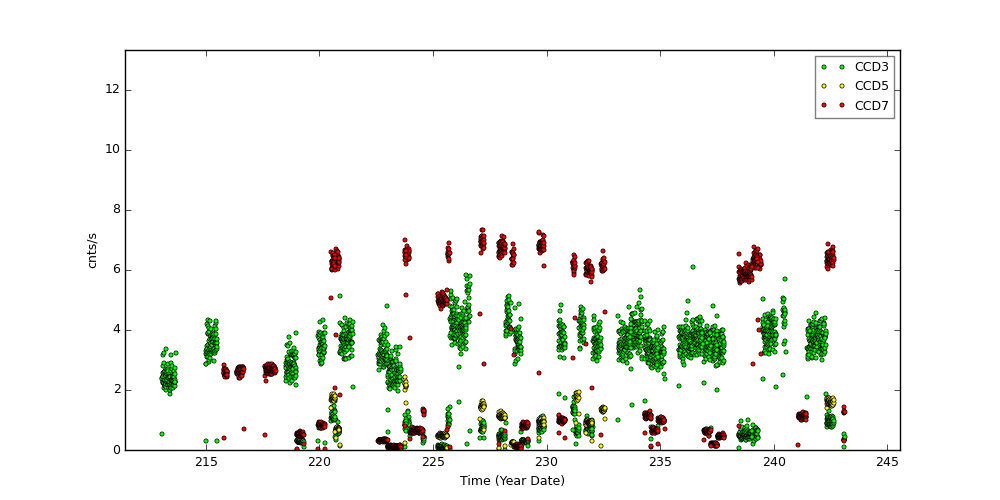
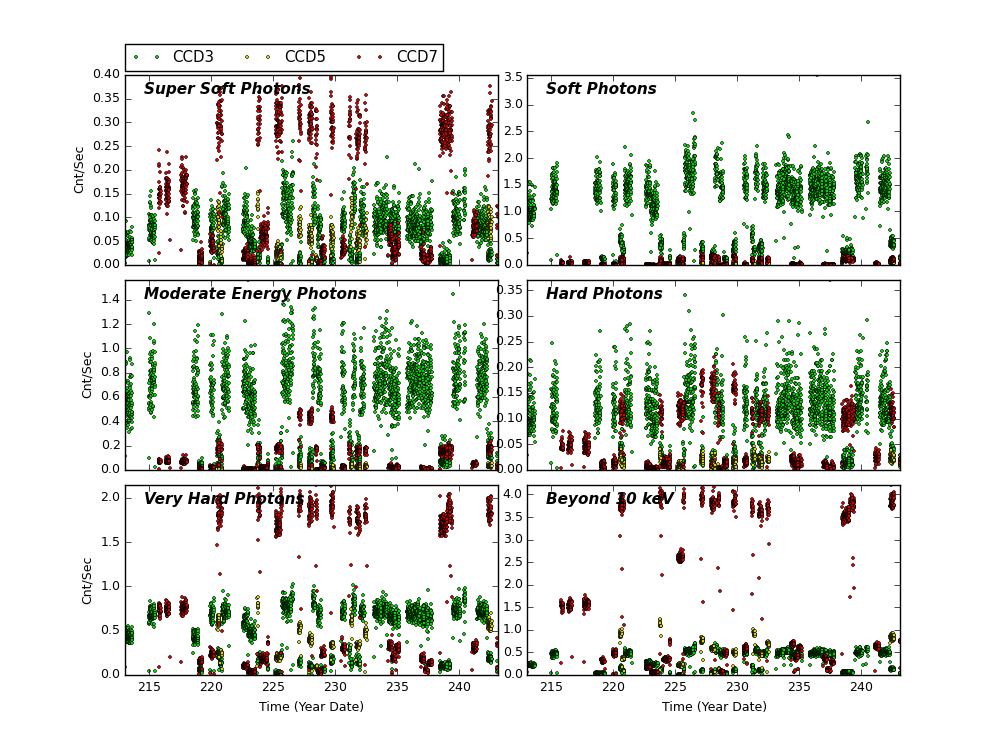
Science Instrument Background Rates
| Name | Low (keV) | High(KeV) | Description |
|---|---|---|---|
| SSoft | 0.00 | 0.50 | Super soft photons |
| Soft | 0.50 | 1.00 | Soft photons |
| Med | 1.00 | 3.00 | Moderate energy photons |
| Hard | 3.00 | 5.00 | Hard Photons |
| Harder | 5.00 | 10.00 | Very Hard photons |
| Hardest | 10.00 | Beyond 10 keV |
HRC
DOSE of Central 4K Pore-Pairs
Please refer to Maximum Dose Trends for more details.
)
|
|---|
IMAGE                NPIX      MEAN    STDDEV      MIN       MAX
HRCI_08_2017.fits  16777216	0.024 	0.156 	0.000 	3.000
)
IMAGE                       NPIX      MEAN    STDDEV      MIN       MAX
HRCI_08_1999_08_2017.fits  16777216	4.995 	5.231 	0.000 	292.000
)
|
|---|
IMAGE                NPIX      MEAN    STDDEV      MIN       MAX
HRCS_08_2017.fits  16777216	0.036 	0.263 	0.000 	37.000
)
IMAGE                       NPIX      MEAN    STDDEV      MIN       MAX
HRCS_08_1999_08_2017.fits  16777216	16.613 	29.752 	0.000 	1714.000
|
|
Max dose trend plots corrected for events that "pile-up"
in the center of the taps due to bad position information.
|
)
|
)
|
)
|
)
|
| May 2017 | Feb 2017 | Nov 2016 | Aug 2016 |
|---|
)
|
)
|
)
|
)
|
| May 2017 | Feb 2017 | Nov 2016 | Aug 2016 |
|---|
HRMA Focus
Plots below show various characteristics of detected imaging sources. Standard level 2 data products (*src2.fits) are used. Only observations with focus (sim_x) within 0.01 mm of nominal value for given SI configuration are used. Sources are also filtered for strength (SNR > 15).
For individual detectors, please go to MTA SRC2 Monitoring page.
Source Sky Position
PSF vs Time
Source Ellipse Roundness
80% Encircled Energy Radius
Signal-to-Noise Ratio
Rotation
)
)
)
|
)
|
)
|
)
|
)
|
)
|
)
|
)
|
Gratings
Focus
We plot the width of the zero order streak of ACIS/HETG observations and the width of the zero order image for HRC/LETG observations of point sources. No significant defocusing trend is seen at this time. See Gratings Focus pages.
PCAD
ACA Trending
Gyro Bias Drift
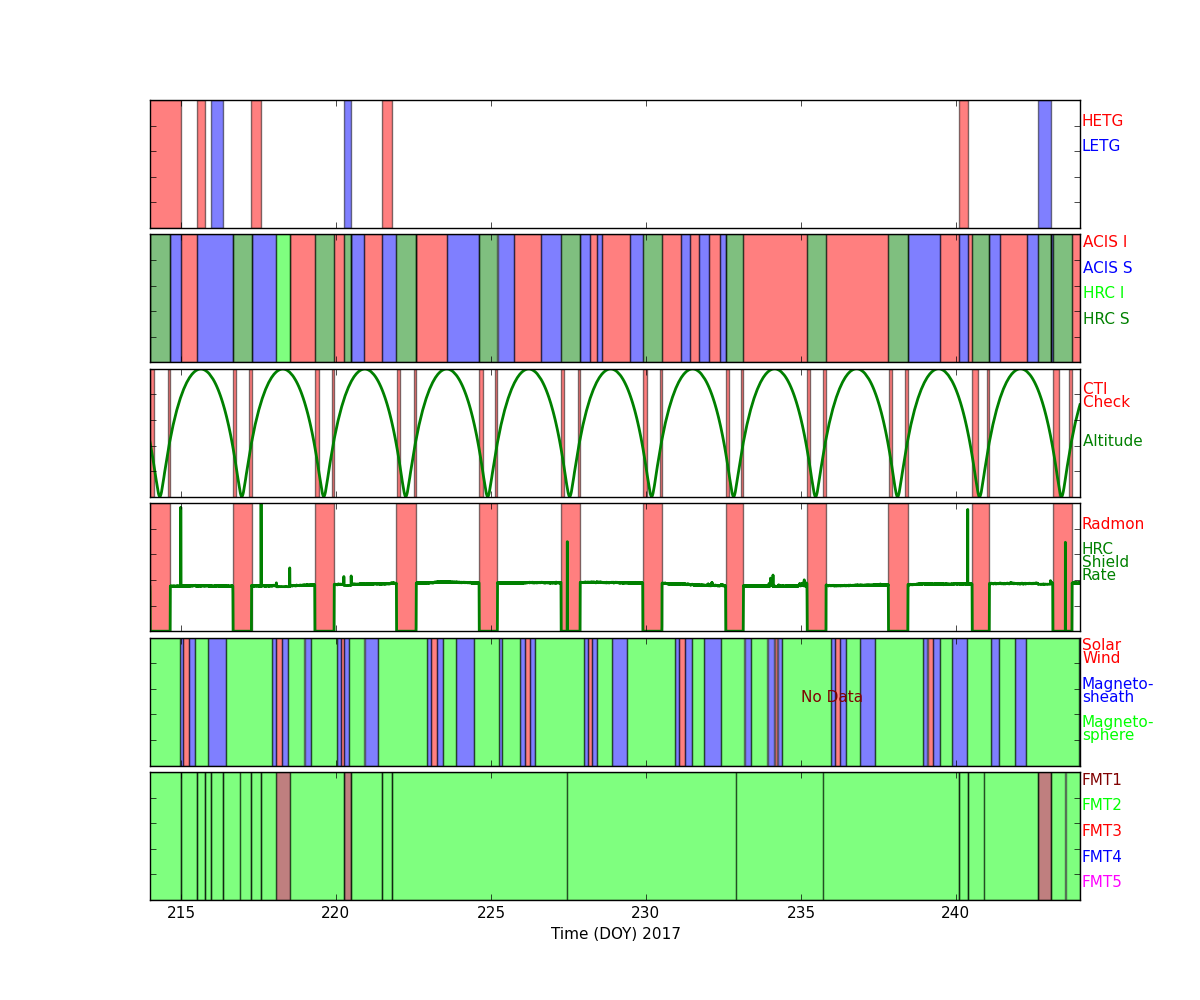
Radiation History
Radiation Zone Timing
Plotted below are radiation zone timing plots based on the following definitions of radiation zone:
- RADZONE - Ephin levels (in any of the E1300,P4GM,P41GM channels) are more than 1/3 of RADMON safing thresholds.
- RADMON - Radmon is disabled for radiation zone (as commanded based on OFLS model, for comparison with actual radiation levels).
- PERIGEE - Time of closest earth approach (for comparison)
Radiation Count Rates of Aug 2017
Sun Spot History
Trending
Quarterly Trends
- HRC Temperature
| Previous Quarter | ||||||
| MSID | MEAN | RMS | DELTA/YR | DELTA/YR/YR | UNITS | DESCRIPTION |
| 2CEAHVPT | 299.25 | 1.86 | 7.865e+00 | 2.206e+00 | K | CEA RADIATOR TEMPERATURE AT CENTER |
| 2CHTRPZT | 295.68 | 1.86 | 8.126e+00 | -6.839e+00 | K | CENTRAL ELECTRONICS BOX TEMP |
| 2CONDMXT | 292.46 | 2.12 | 7.459e+00 | 5.089e+01 | K | CONDUIT -X FACE TEMPERATURE |
| 2DCENTRT | 291.50 | 1.80 | 9.336e+00 | 7.161e+00 | K | DETECTOR HOUSING TEMP 2 |
| 2DTSTATT | 292.38 | 1.87 | 8.428e+00 | 5.313e+01 | K | DETECTOR HOUSING TEMP 1 |
| 2FHTRMZT | 294.67 | 2.17 | 7.742e+00 | 6.665e+01 | K | FRONT END ELECTRONICS BOX TEMPERATURE |
| 2FRADPYT | 290.49 | 2.30 | 6.913e+00 | 6.714e+01 | K | FRONT END ASSEMBLY +Y AT RADIATOR CENTER TEMP |
| 2PMT1T | 293.50 | 2.43 | 1.199e+01 | 6.538e+01 | K | PMT 1 TEMPERATURE |
| 2PMT2T | 295.97 | 2.60 | 1.213e+01 | 3.623e+01 | K | PMT 2 TEMPERATURE |
| 2UVLSPXT | 287.35 | 2.29 | 1.128e+01 | -1.124e+01 | K | UV LIGHT SHIELD NEXT TO SNOUT TEMP |
)
)
)
)
)
)
)
)
)
)
- HRC HK
| Previous Quarter | ||||||
| MSID | MEAN | RMS | DELTA/YR | DELTA/YR/YR | UNITS | DESCRIPTION |
| FE00ATM | 21.41 | 1.68 | 5.723e+00 | 5.280e+01 | C | Front end temperature (2FE00ATM) |
| FEPRATM | 23.99 | 1.95 | 6.472e+00 | 5.651e+01 | C | FE temp card temperature (2FEPRATM) |
| IMHVATM | 30.75 | 1.25 | 3.842e+00 | -8.394e+01 | (2IMHVATM)C | |
)
)
)
- PCAD Temperature
| Previous Quarter | ||||||
| MSID | MEAN | RMS | DELTA/YR | DELTA/YR/YR | UNITS | DESCRIPTION |
| AACCCDPT | 259.43 | 1.02 | 3.063e+00 | 2.127e+01 | K | AC CCD TEMP (PRI) |
| AACCCDRT | 303.21 | 1.11 | 3.400e+00 | 2.267e+01 | K | AC CCD TEMP (RDNT) |
| AACH1T | 300.42 | 1.15 | 3.484e+00 | 2.585e+01 | K | AC HOUSING TEMP (ACH1) |
| AACH2T | 300.47 | 1.16 | 3.553e+00 | 2.375e+01 | K | AC HOUSING TEMP (ACH2) |
)
)
)
)
Envelope Trending
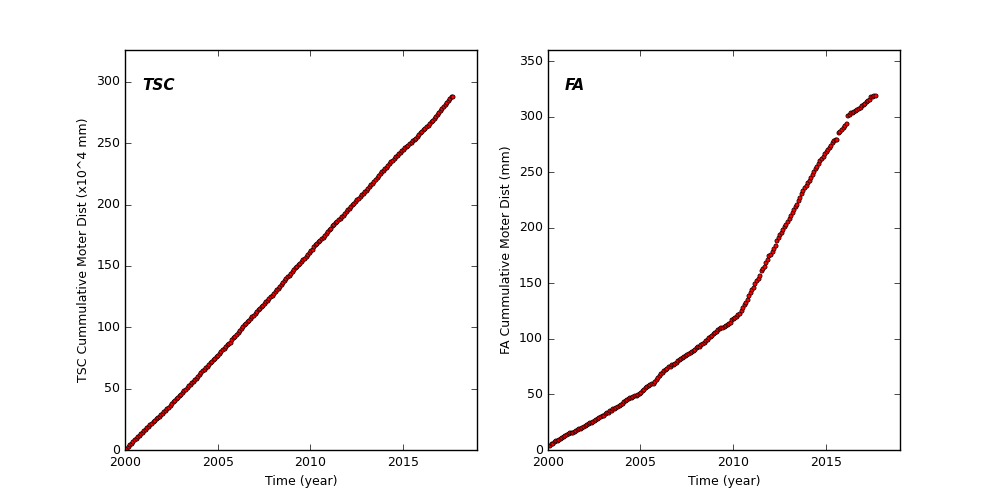
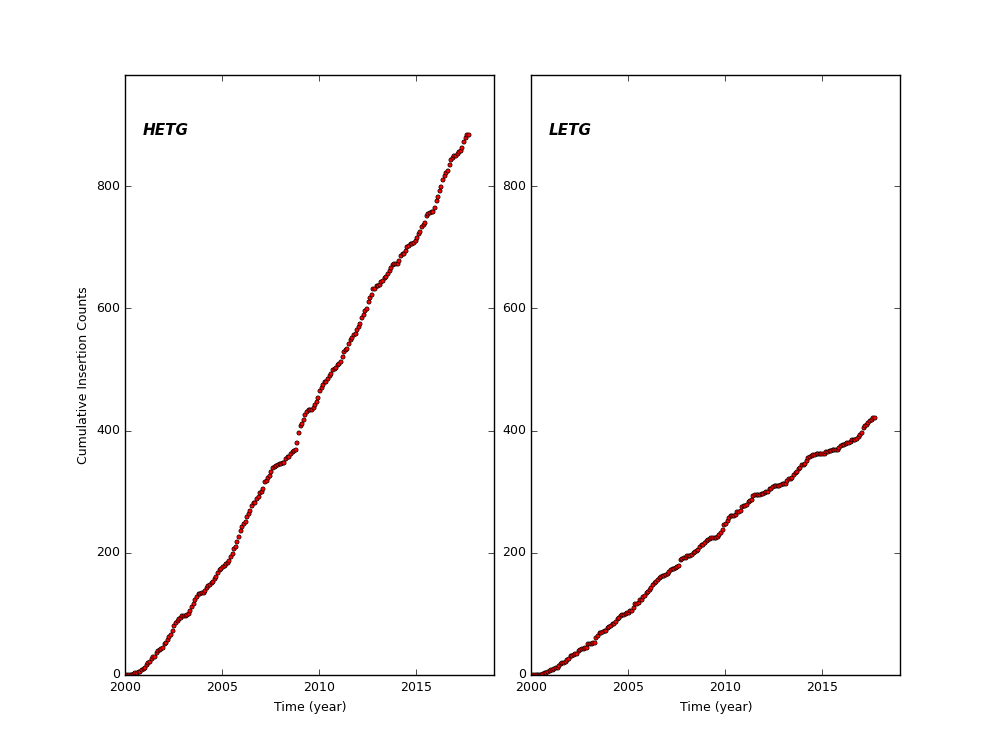
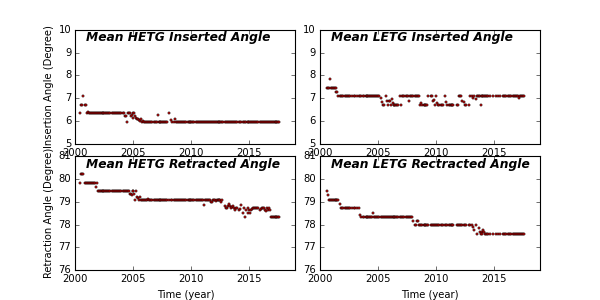
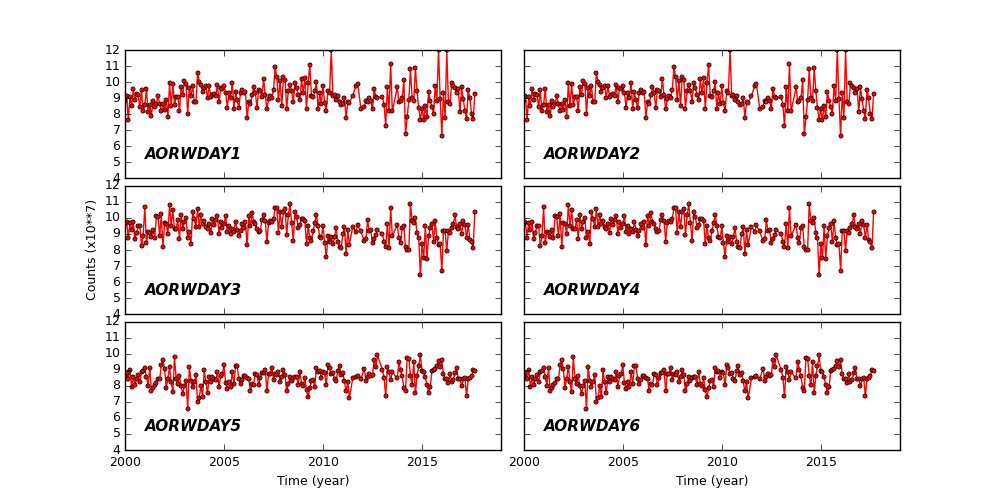
Spacecraft Motions
TSC and FA Cummulative Moter Distance
HETG and LETG Cummulative Insertion Counts
HETG/LETG Insertion/Retraction Angle
Reaction Wheel Rotations
Links to Past Monthly Reports
| Year | Month | |||||||||||
|---|---|---|---|---|---|---|---|---|---|---|---|---|
| 2017 | Jan | Feb | Mar | Apr | May | Jun | Jul | |||||
| 2016 | Jan | Feb | Mar | Apr | May | Jun | Jul | Aug | Sep | Oct | Nov | Dec |
| 2015 | Jan | Feb | Mar | Apr | May | Jun | Jul | Aug | Sep | Oct | Nov | Dec |
| 2014 | Jan | Feb | Mar | Apr | May | Jun | Jul | Aug | Sep | Oct | Nov | Dec |
| 2013 | Jan | Feb | Mar | Apr | May | Jun | Jul | Aug | Sep | Oct | Nov | Dec |
| 2012 | Jan | Feb | Mar | Apr | May | Jun | Jul | Aug | Sep | Oct | Nov | Dec |
| 2011 | Jan | Feb | Mar | Apr | May | Jun | Jul | Aug | Sep | Oct | Nov | Dec |
| 2010 | Jan | Feb | Mar | Apr | May | Jun | Jul | Aug | Sep | Oct | Nov | Dec |
| 2009 | Jan | Feb | Mar | Apr | May | Jun | Jul | Aug | Sep | Oct | Nov | Dec |
| 2008 | Jan | Feb | Mar | Apr | May | Jun | Jul | Aug | Sep | Oct | Nov | Dec |
| 2007 | Jan | Feb | Mar | Apr | May | Jun | Jul | Aug | Sep | Oct | Nov | Dec |
| 2006 | Jan | Feb | Mar | Apr | May | Jun | Jul | Aug | Sep | Oct | Nov | Dec |
| 2005 | Jan | Feb | Mar | Apr | May | Jun | Jul | Aug | Sep | Oct | Nov | Dec |
| 2004 | Jan | Feb | Mar | Apr | May | Jun | Jul | Aug | Sep | Oct | Nov | Dec |
| 2003 | Jan | Feb | Mar | Apr | May | Jun | Jul | Aug | Sep | Oct | Nov | Dec |
| 2002 | Jan | Feb | Mar | Apr | May | Jun | Jul | Aug | Sep | Oct | Nov | Dec |
| 2001 | Jan | Feb | Mar | Apr | May | Jun | Jul | Aug | Sep | Oct | Nov | Dec |
| 2000 | Jan | Feb | Mar | Apr | May | Jun | Jul | Aug | Sep | Oct | Nov | Dec |
| 1999 | Jul | Aug | Sep | Oct | Nov | Dec | ||||||