ACIS
ACIS DOSE Registered-Photon-Map
The steps we took to compute the dose map are;
- Level 1 Event files for a specified month are obtained from archive.
- Image data including I2, I3, S2, S3 CCDs are extracted from all event files.
- All the extracted image data were merged to create a month long exposure map for the month.
- The exposure map is opened with ds9, and check a distribution of count rates against energy. From this, estimate the upper threshold value. Any events beyond this upper threshold are assumed erroneous events such as bad pixels.
- Using this upper threshold, the data is filtered, and create a cleaned exposure map for the month.
- The exposure map from each month from the Sep 1999 is added up to create a cumulative exposure map for each month.
- Using fimgstatistic, we compute count rate statistics for each CCDs.
- For observations with high data drop rates (e.g., Crab nebula, Cas A), we corrected the observations by adding events.
Please check more detail plots at Telemetered Photon Dose Trend page.
)
)
)
Statistics:
# IMAGE     NPIX     MEAN        RMS        MIN     MAX
ACIS_nov18 6004901       6.215         8.698           0.0     2509


I2 node 0  262654	6.803422	3.196357	0.0	 49.0
I2 node 1  262654	7.120570	3.750678	0.0	856.0
I2 node 2  262654	7.061858	3.203865	0.0	 73.0
I2 node 3  262654	6.992960	6.709651	0.0	2509.0

I3 node 0  262654	7.985975	3.680181	0.0	 57.0
I3 node 1  262654	7.712784	4.004612	0.0	116.0
I3 node 2  262654	7.260464	3.206708	0.0	 71.0
I3 node 3  262654	7.436881	5.970492	0.0	2503.0

S2 node 0  262654	7.649000	5.940862	0.0	2503.0
S2 node 1  262654	7.651031	3.548661	0.0	 64.0
S2 node 2  262654	7.777282	6.280798	0.0	1491.0
S2 node 3  262654	7.716178	4.683472	0.0	1016.0

S3 node 0  262654	9.608552	5.536498	0.0	151.0
S3 node 1  262654	10.926793	4.607152	0.0	118.0
S3 node 2  262654	10.358330	3.702681	0.0	119.0
S3 node 3  262654	9.356411	3.461909	0.0	 29.0
)
)
)
Statistics:
 IMAGE     NPIX      MEAN        RMS           MIN      MAX
ACIS_total   6004901       2250.583         2912.618           0.0   126353


I2 node 0  262654	1945.634945	385.510944	415.0	11061.0
I2 node 1  262654	2047.397194	537.603690	429.0	84911.0
I2 node 2  262654	2078.135335	440.387230	429.0	10974.0
I2 node 3  262654	2083.501782	538.460566	417.0	28515.0

I3 node 0  262654	2206.560700	545.928411	411.0	8758.0
I3 node 1  262654	2288.034174	1677.353354	433.0	55076.0
I3 node 2  262654	2015.188422	373.641482	410.0	11406.0
I3 node 3  262654	2006.042969	401.815078	363.0	31573.0

S2 node 0  262654	2616.900214	409.687593	1480.0	21809.0
S2 node 1  262654	2775.050051	619.152867	1625.0	15279.0
S2 node 2  262654	3069.392919	628.761312	2072.0	27718.0
S2 node 3  262654	3019.305168	480.304808	1828.0	55976.0

S3 node 0  262654	4642.051666	2093.205279	2043.0	27085.0
S3 node 1  262654	5866.331400	2236.589527	0.0	28943.0
S3 node 2  262654	4629.391498	1231.514304	1977.0	25047.0
S3 node 3  262654	3573.614274	650.066043	2191.0	24612.0
)
|
)
|
)
|
)
|
| Aug 2018 | May 2018 | Feb 2018 | Nov 2017 |
|---|
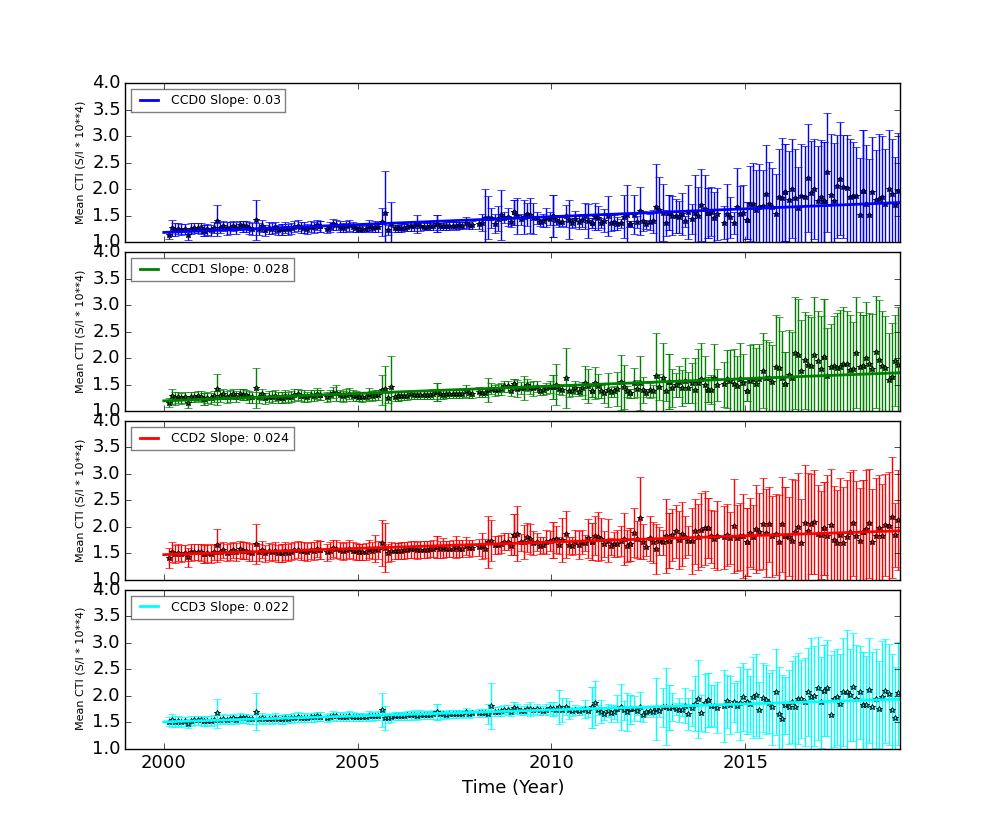
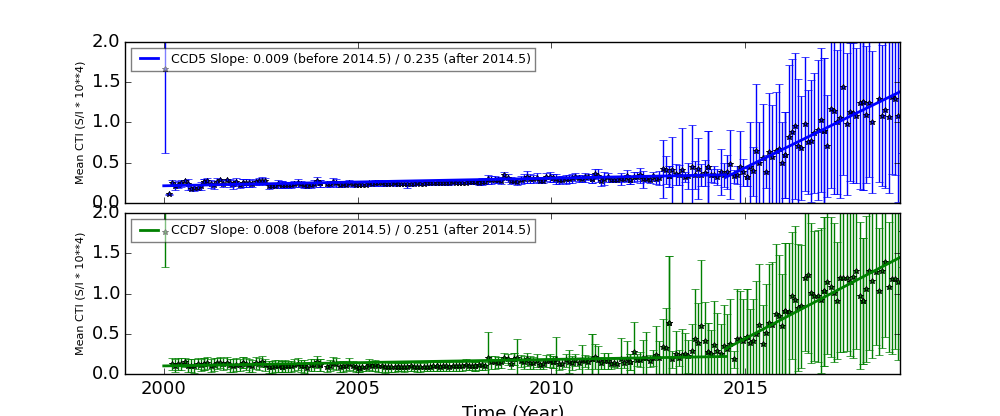
The Mean Detrended CTI
We report CTIs with a refined data definition. CTIs were computed for the temperature dependency corrected data. Please see CTI page for detailed explanation. CTI's are computed for Mn K alpha, and defined as slope/intercept x10^4 of row # vs ADU. Data file: here
Imaging CCDs
Spectral CCDs
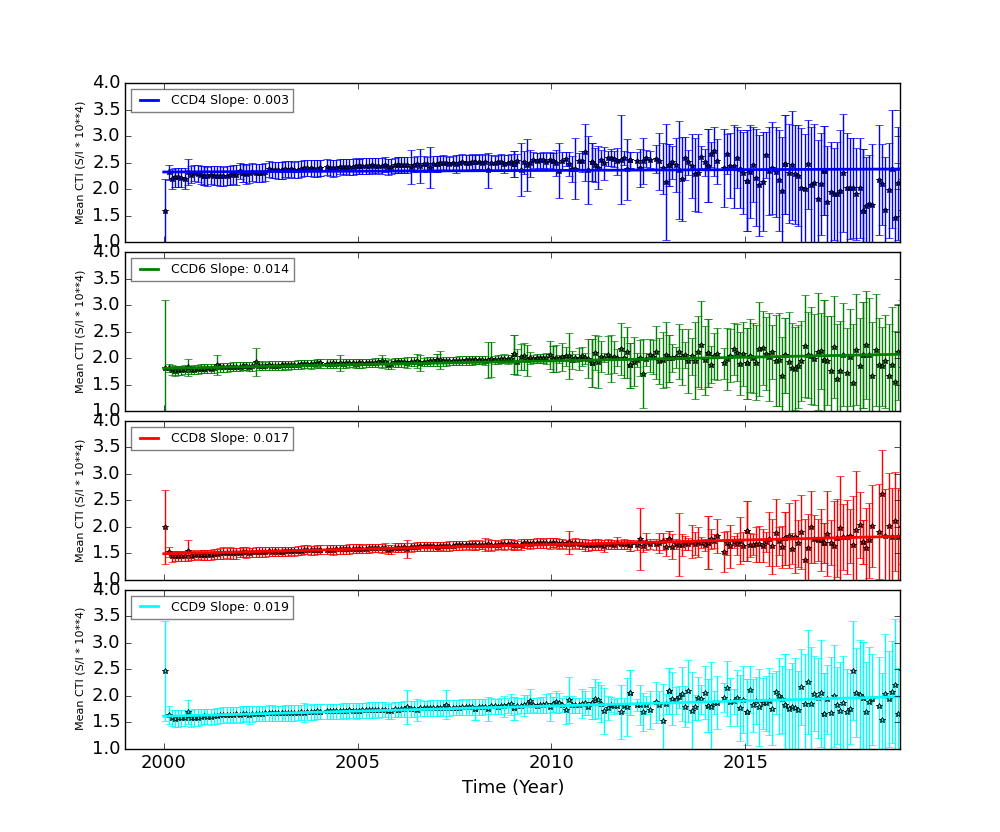
Backside CCDs
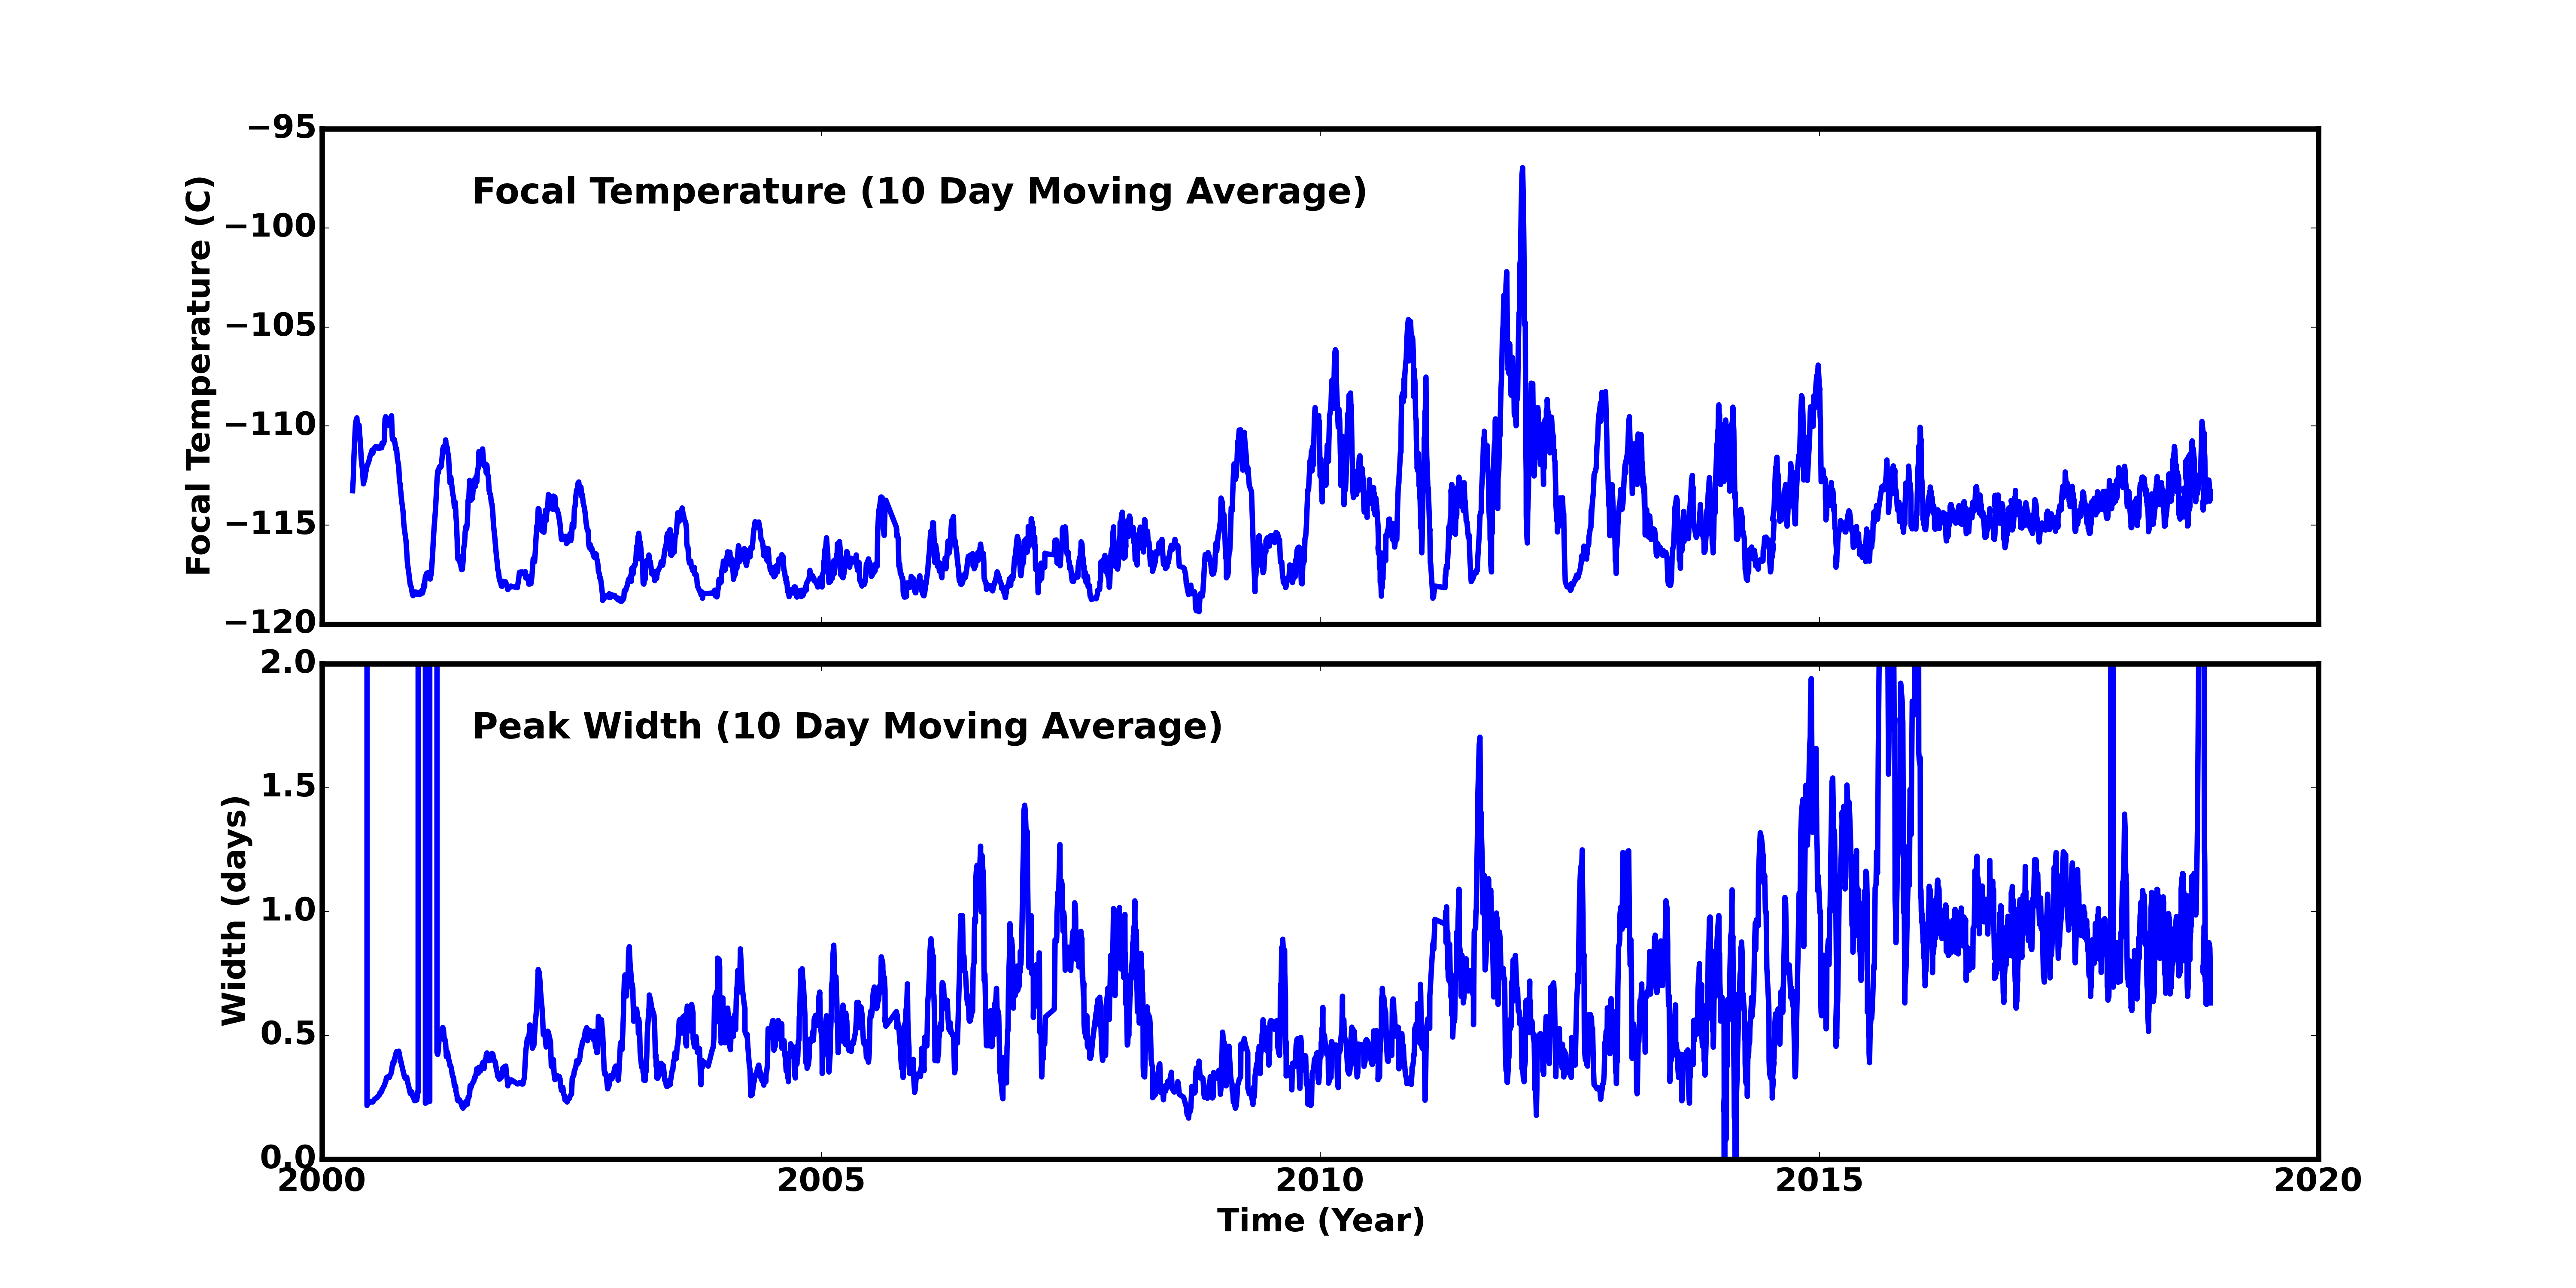
Focal Plane Temperature
Nov 2018 Focal Temperature
| The Mean (max) FPT: | |
|---|---|
| -113.23 | +/- 2.81 C |
| Mean Width: | |
| 0.78 | +/- 0.43 days |
Averaged Focal Plane Temperature
We are using 10 period moving averages to show trends of peak temperatures and peak widths. Note, the gaps in the width plot are due to missing/corrupted data.
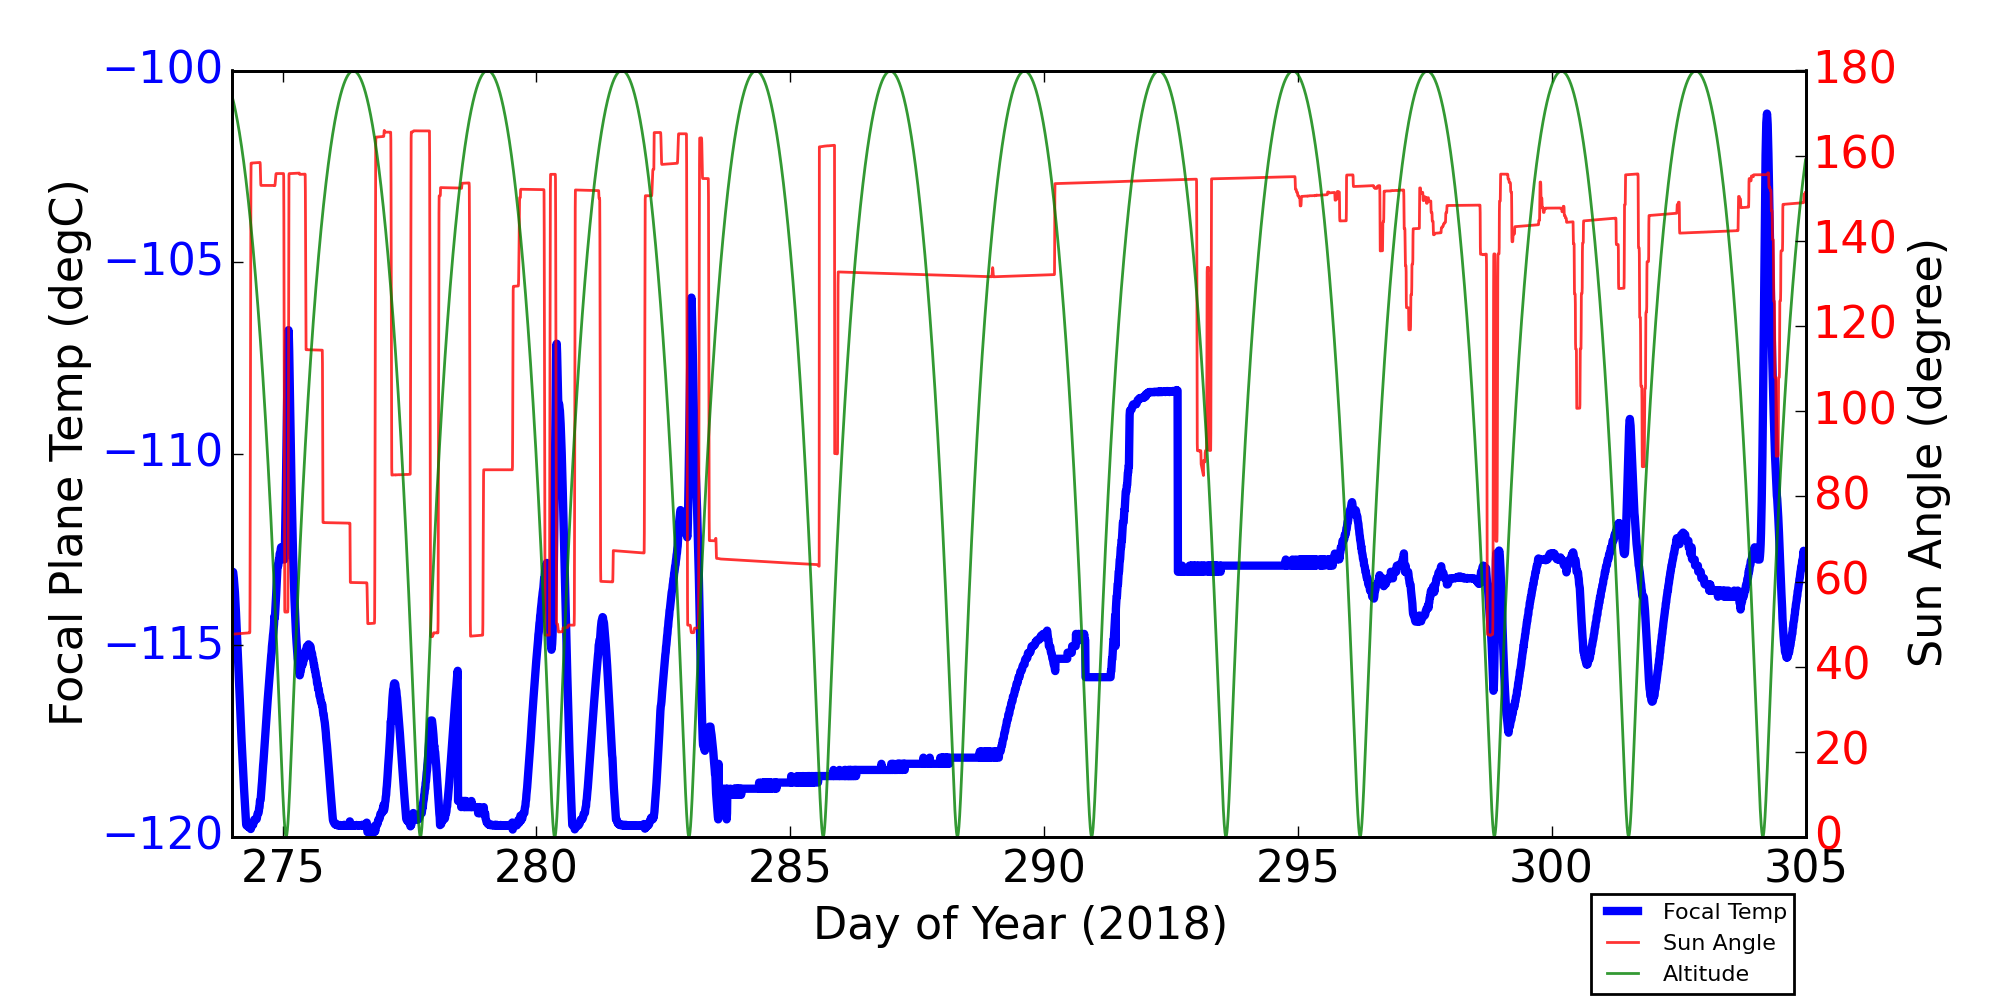
Focal Plane Temperature, Sun Angle and Altitude
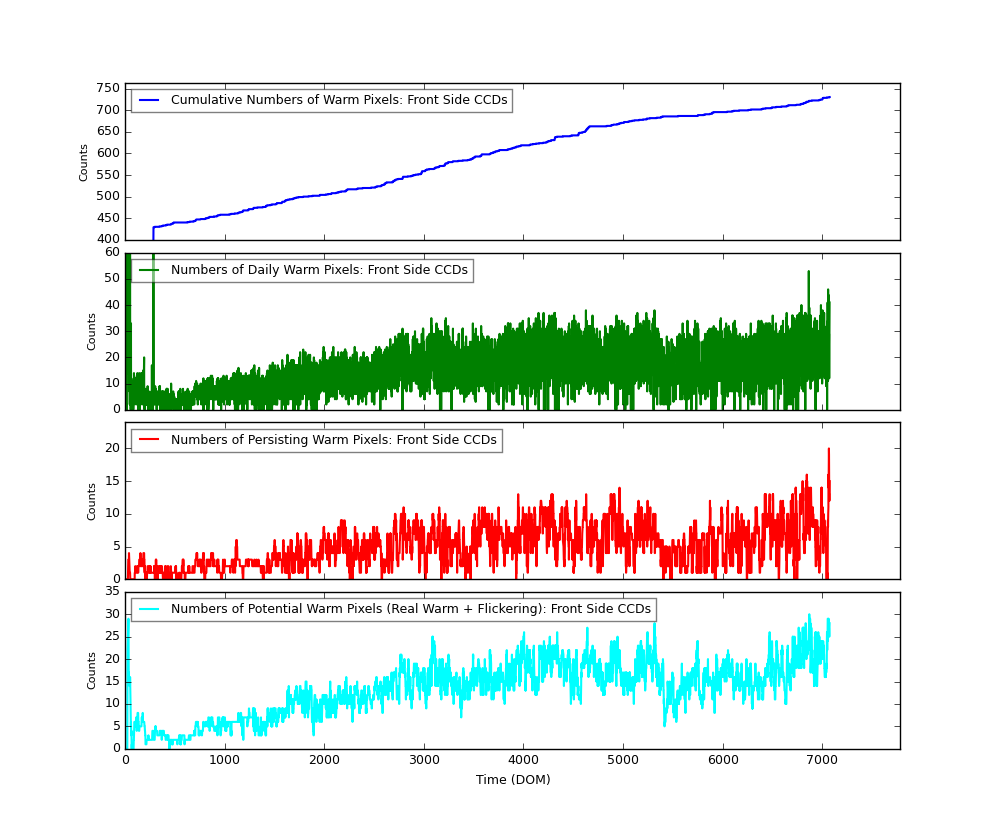
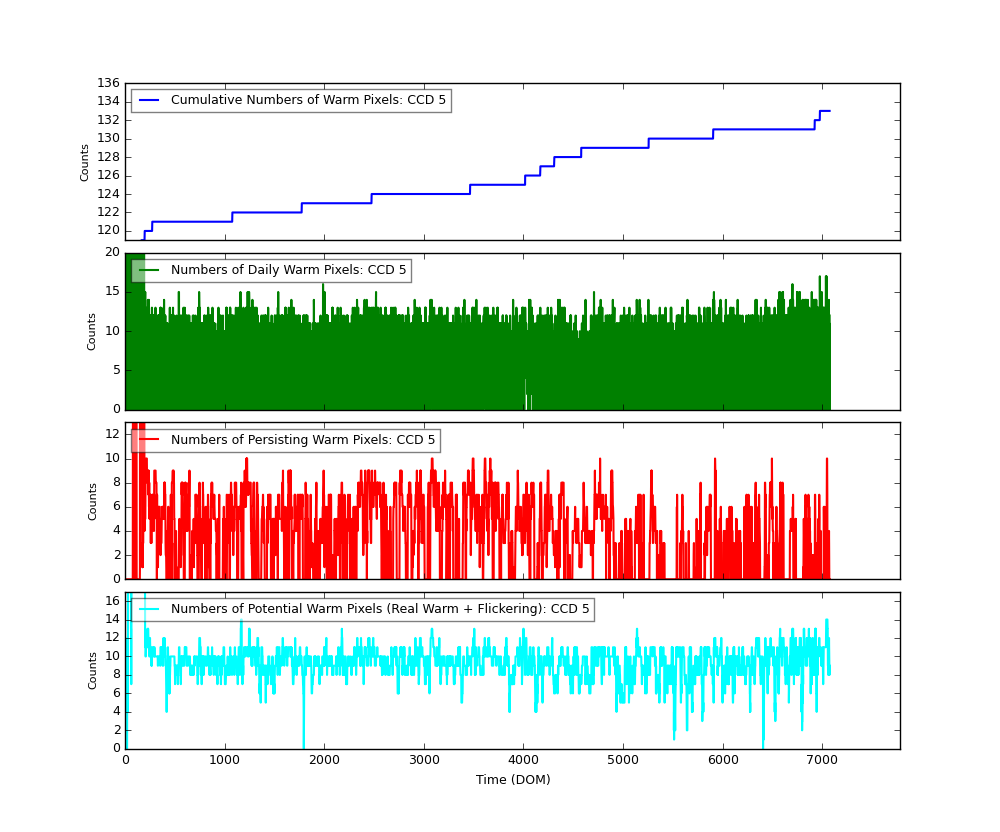
Bad Pixels
The plots below were generated with a new warm pixel finding script. Please see Acis Bad Pixel Page for details.
Front Side CCDs
Back Side CCD (CCD5)
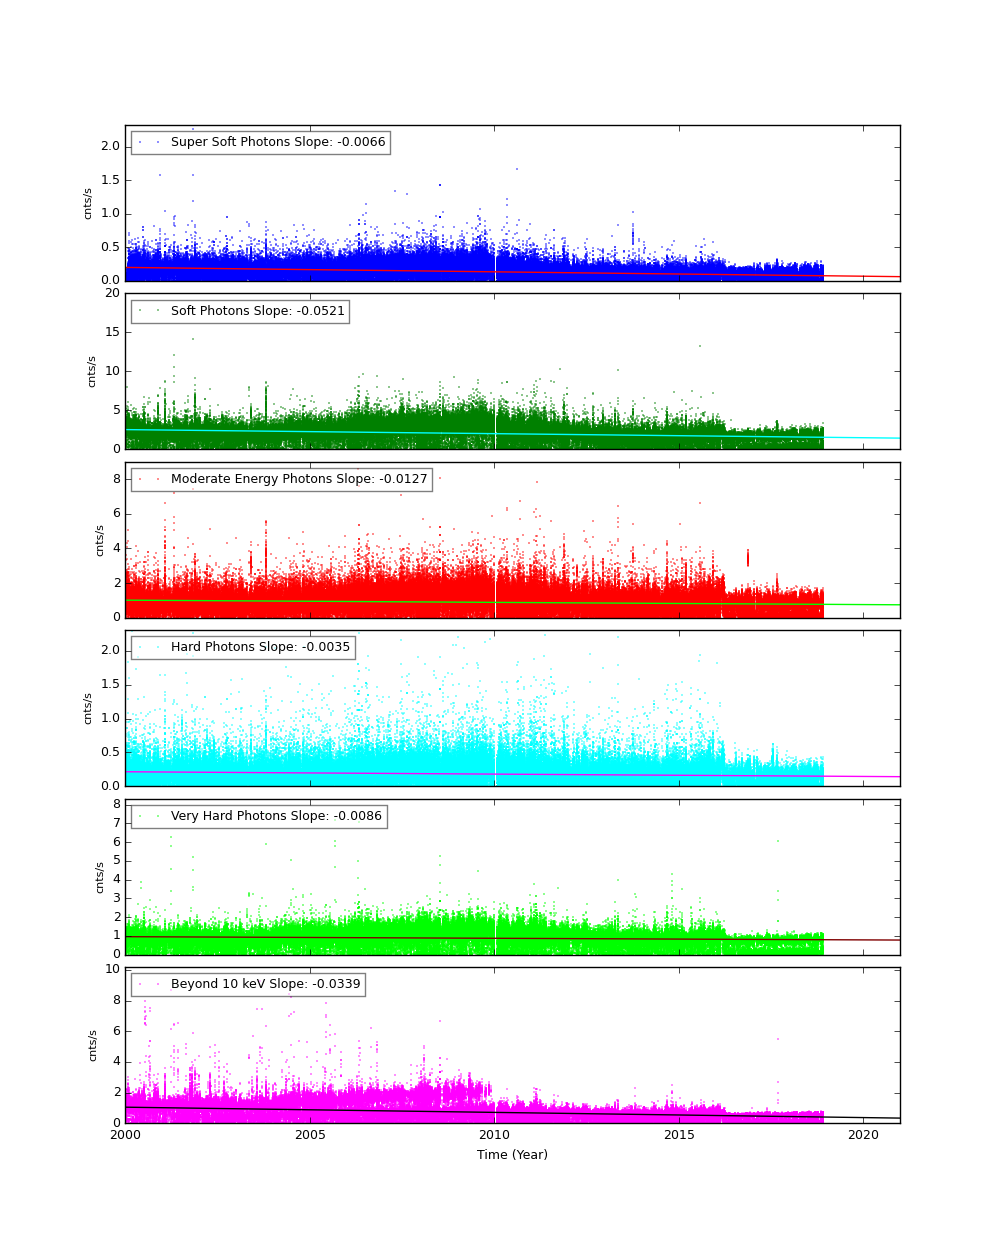
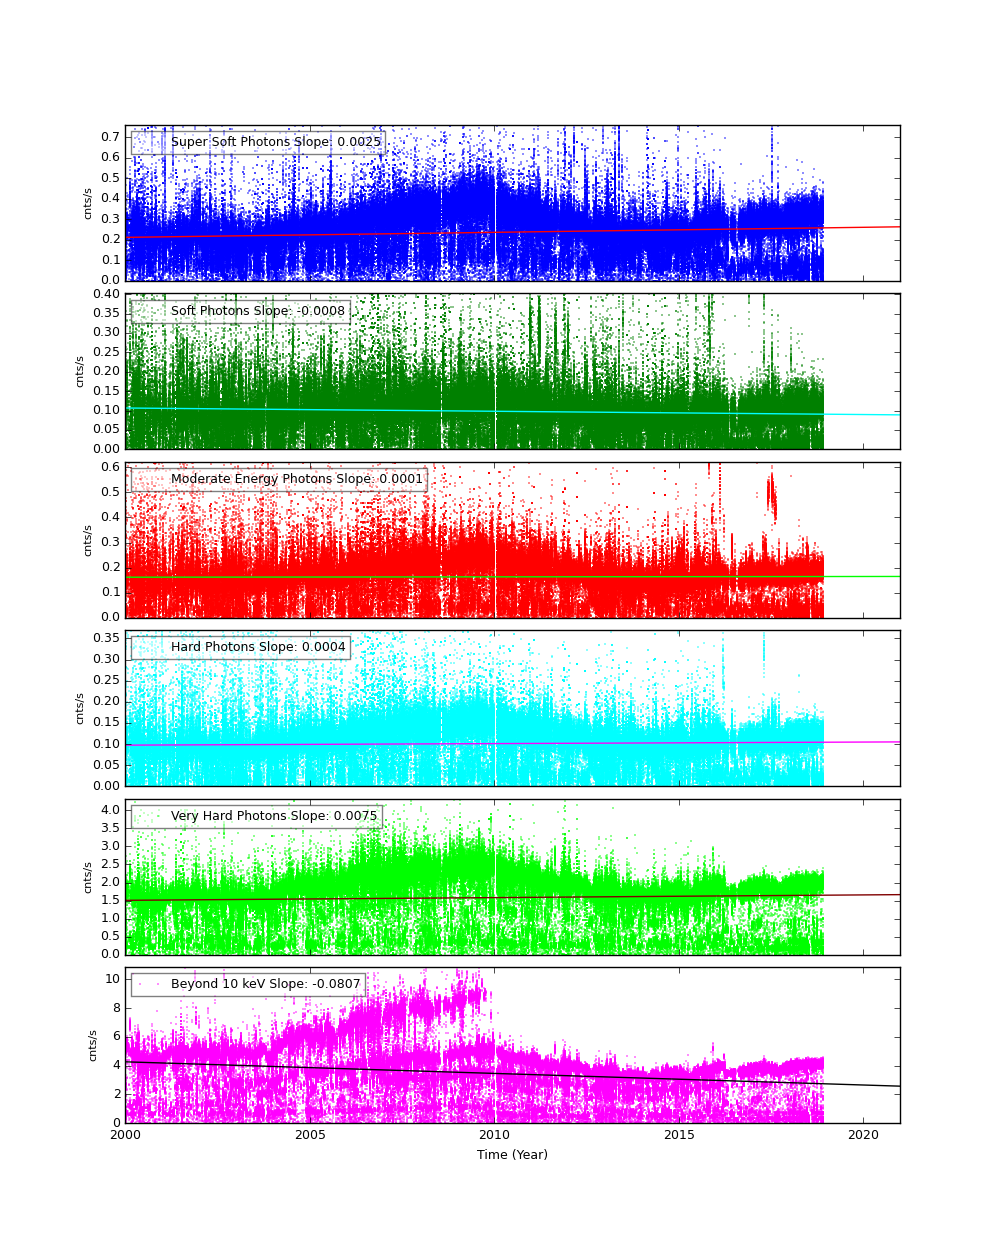
Science Instrument Background Rates
| Name | Low (keV) | High(KeV) | Description |
|---|---|---|---|
| SSoft | 0.00 | 0.50 | Super soft photons |
| Soft | 0.50 | 1.00 | Soft photons |
| Med | 1.00 | 3.00 | Moderate energy photons |
| Hard | 3.00 | 5.00 | Hard Photons |
| Harder | 5.00 | 10.00 | Very Hard photons |
| Hardest | 10.00 | Beyond 10 keV |
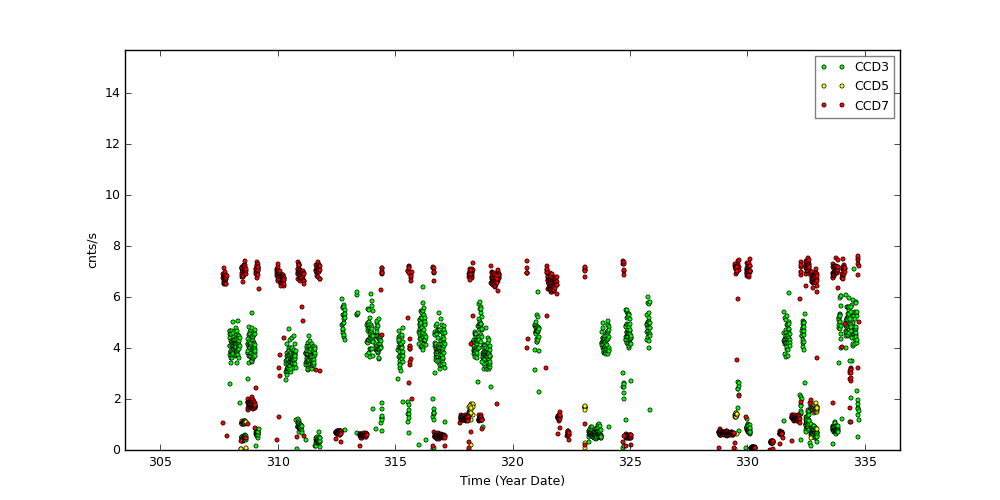
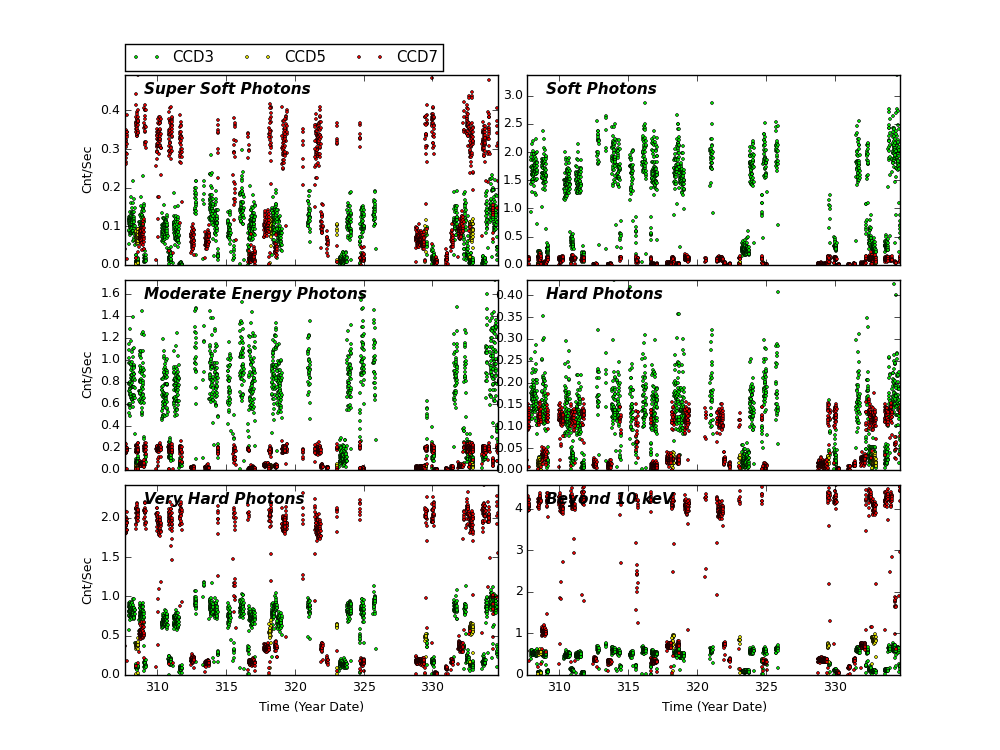
The following three plots show trends of SIB from year 2000. CCDs shown here are CCD3, CCD5, and CCD7. Fitted lines are linear fit after eliminating extreme outliers. For >10 keV plots, 2 lines are fit. One is with a 13 keV filter, and another without.
CCD 3
CCD 5
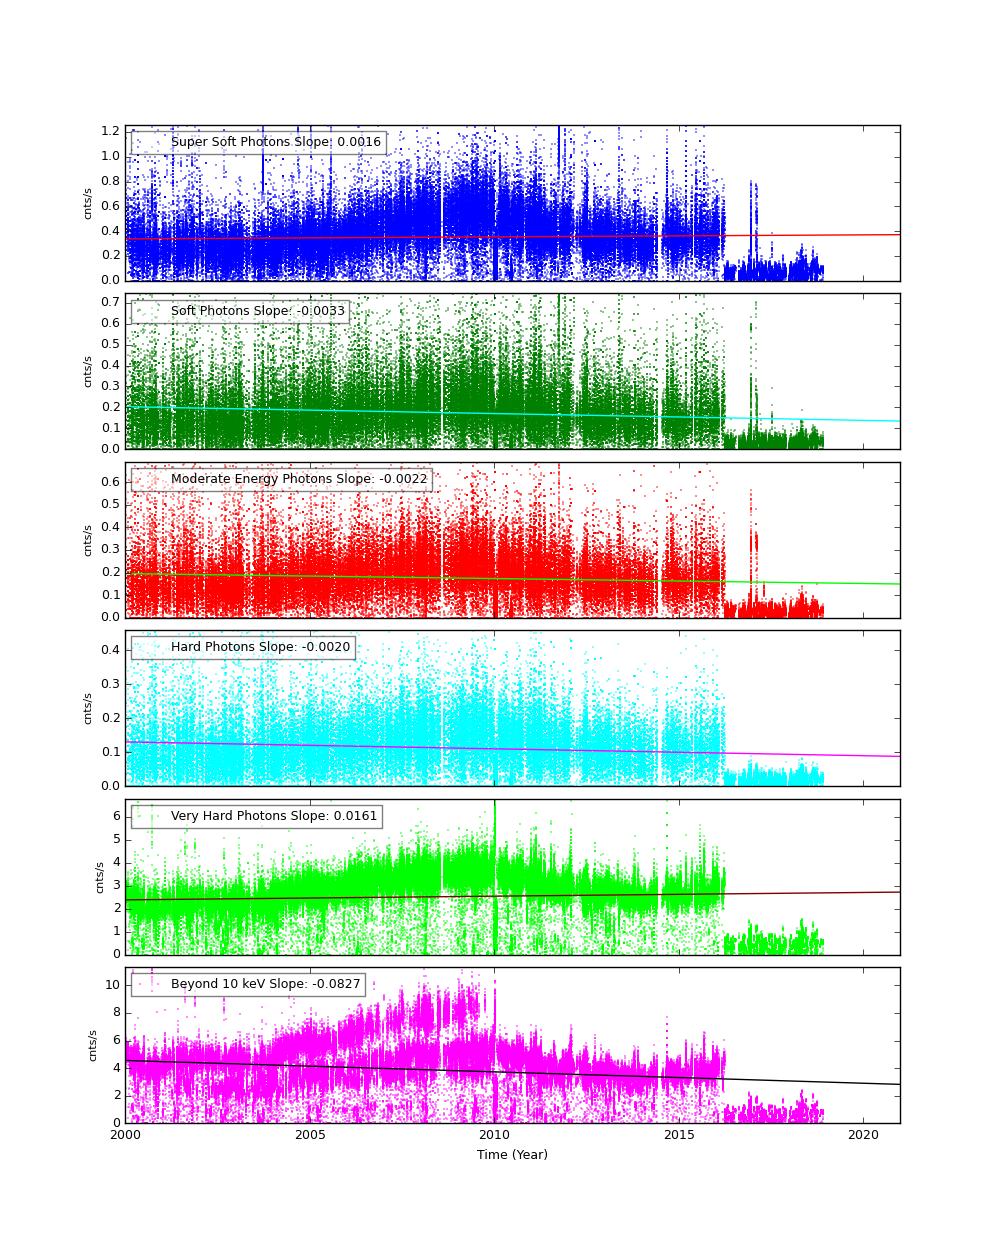
CCD 7
ACIS Histogram Mode Trends
We collected data from acis histogram mode data, and created trend plots of peak portions and peak widths against time (DOM). The peaks were estimated by fitting a simple Gaussian on three peaks (Al, Ti, and Mn), and the widths were estimated by a width at the half max from the peak.
All histogram data are taken under TIMED and GRADED_HIST mode, SIM position is at an external calibration source position, the focal temperature is around -119.7 C, and parameter settings in aciselec, acistemp are set to about same for all.
CCD 3, Peak Position
CCD 3, Peak Widths
CCD 3, Count Rates
HRC
DOSE of Central 4K Pore-Pairs
Please refer to Maximum Dose Trends for more details.
)
|
|---|
IMAGE                NPIX      MEAN    STDDEV      MIN       MAX
HRCI_11_2018.fits  16777216	0.023 	0.152 	0.000 	3.000
)
IMAGE                       NPIX      MEAN    STDDEV      MIN       MAX
HRCI_08_1999_11_2018.fits  16777216	5.586 	5.702 	0.000 	302.000
)
|
|---|
IMAGE                NPIX      MEAN    STDDEV      MIN       MAX
HRCS_11_2018.fits  16777216	0.169 	0.507 	0.000 	24.000
)
IMAGE                       NPIX      MEAN    STDDEV      MIN       MAX
HRCS_08_1999_11_2018.fits  16777216	17.945 	32.735 	0.000 	1730.000
|
|
Max dose trend plots corrected for events that "pile-up"
in the center of the taps due to bad position information.
|
)
|
)
|
)
|
)
|
| Aug 2018 | May 2018 | Feb 2018 | Nov 2017 |
|---|
)
|
)
|
)
|
)
|
| Aug 2018 | May 2018 | Feb 2018 | Nov 2017 |
|---|
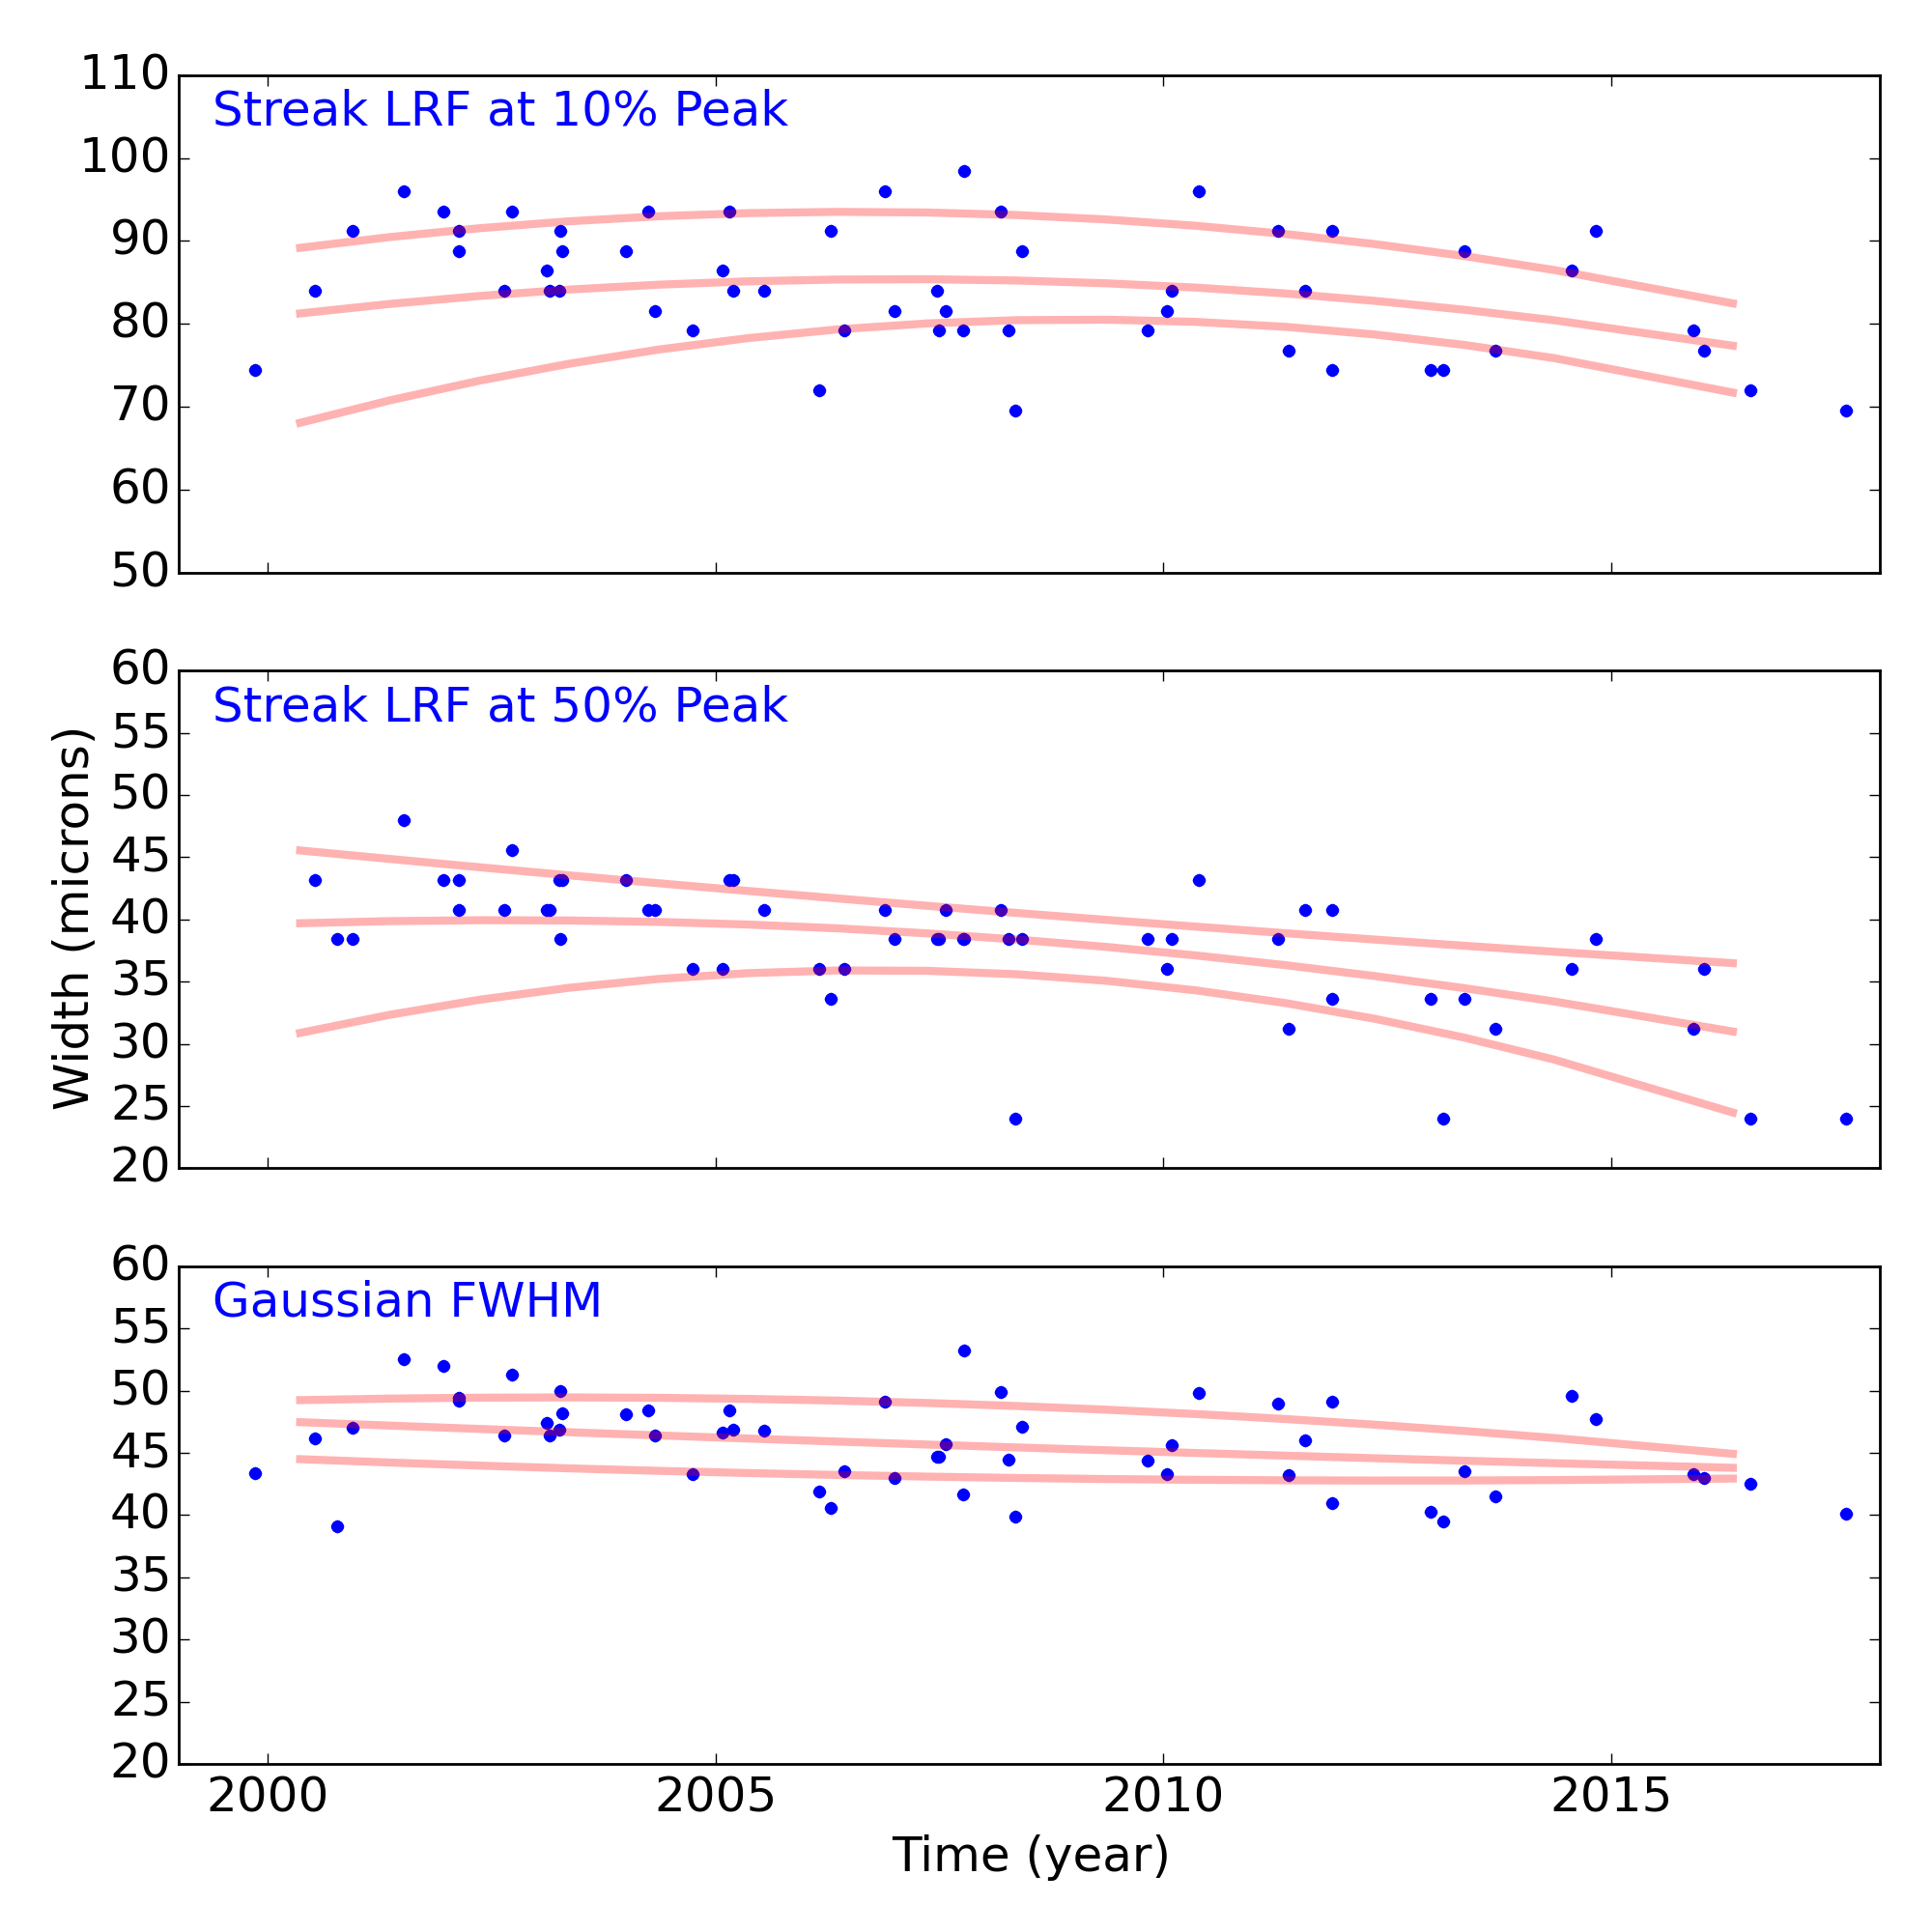
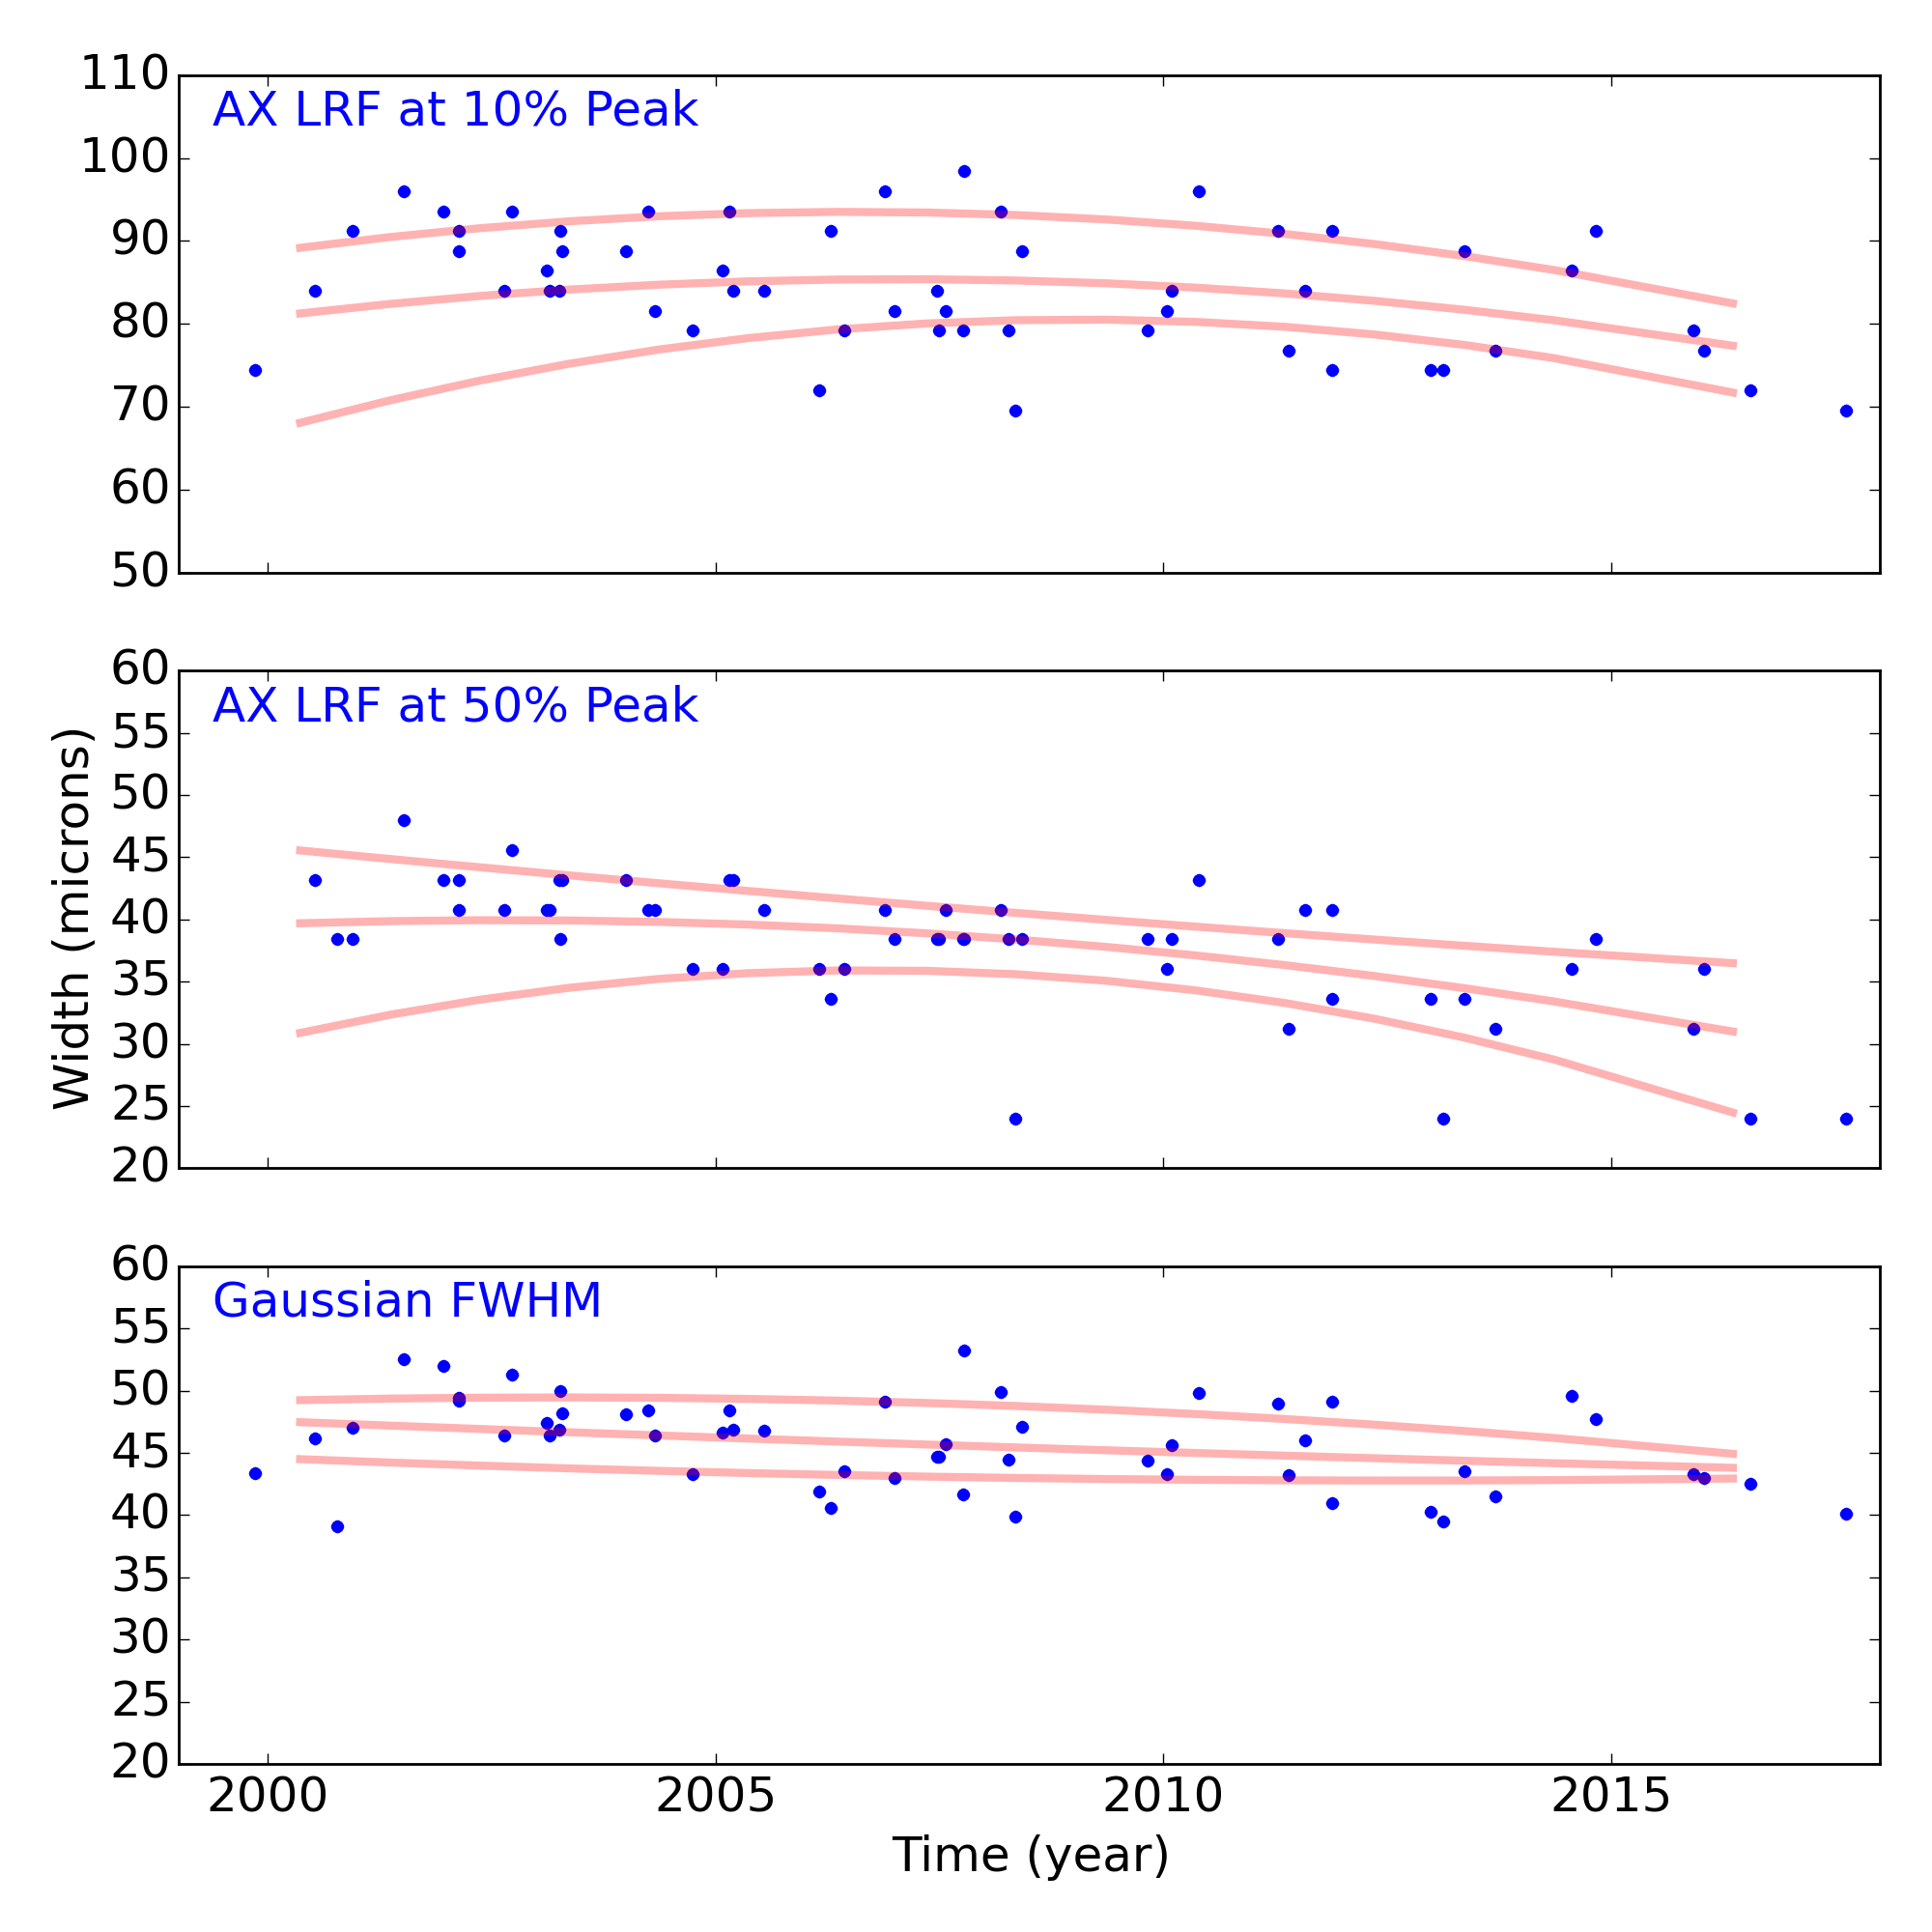
Gratings
Grating Trends/Focus
We plot the width of the zero order streak of ACIS/HETG observations and the width of the zero order image for HRC/LETG observations of point sources. No significant defocusing trend is seen at this time. See Gratings Trends pages.
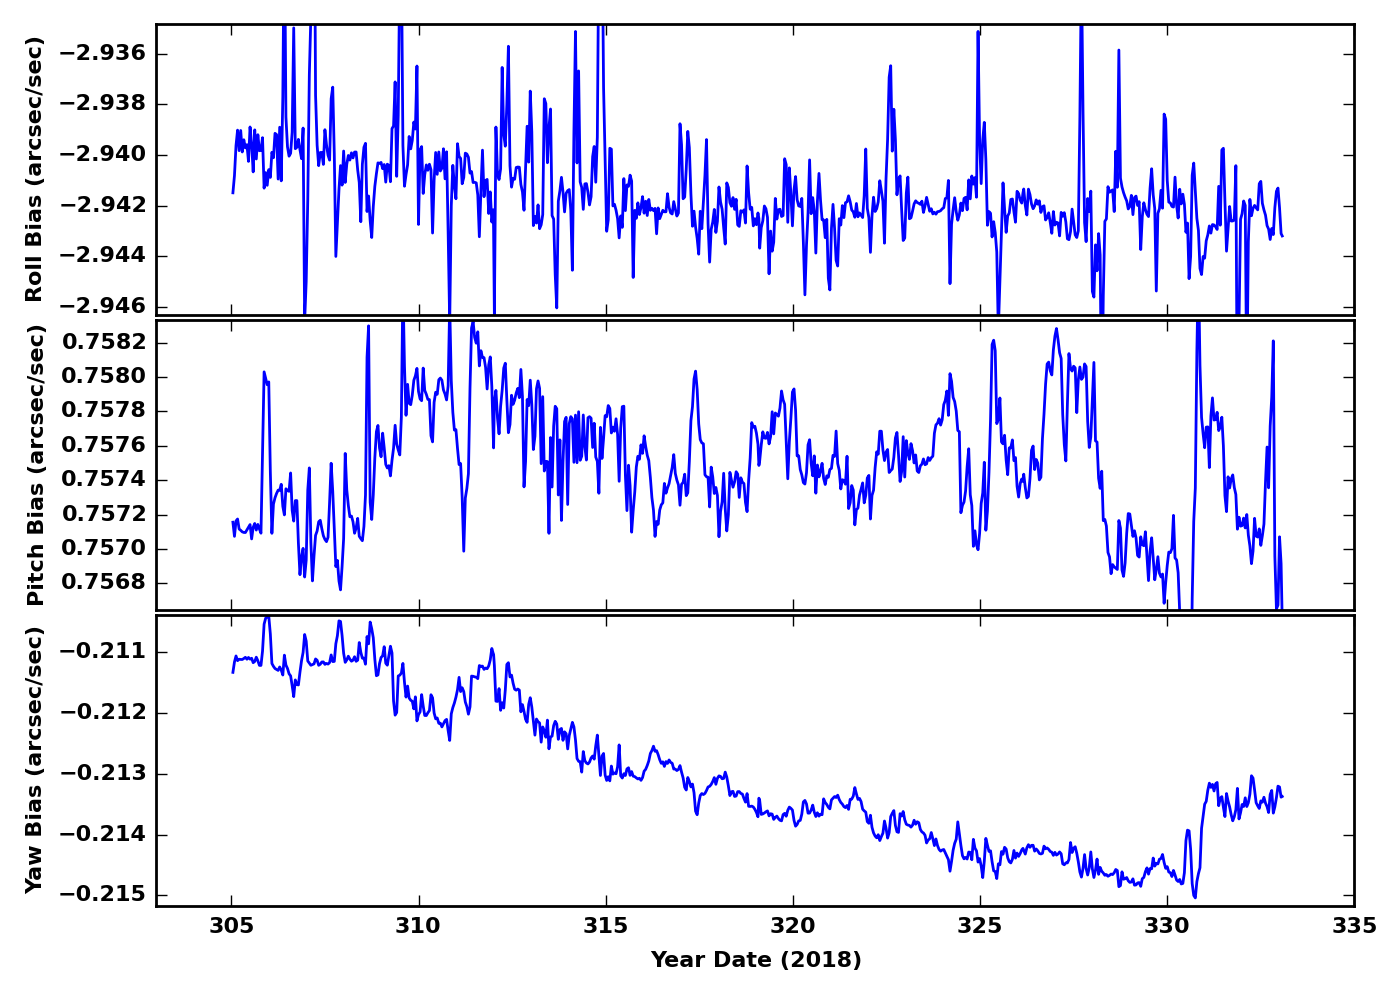
PCAD
ACA Trending
Gyro Bias Drift
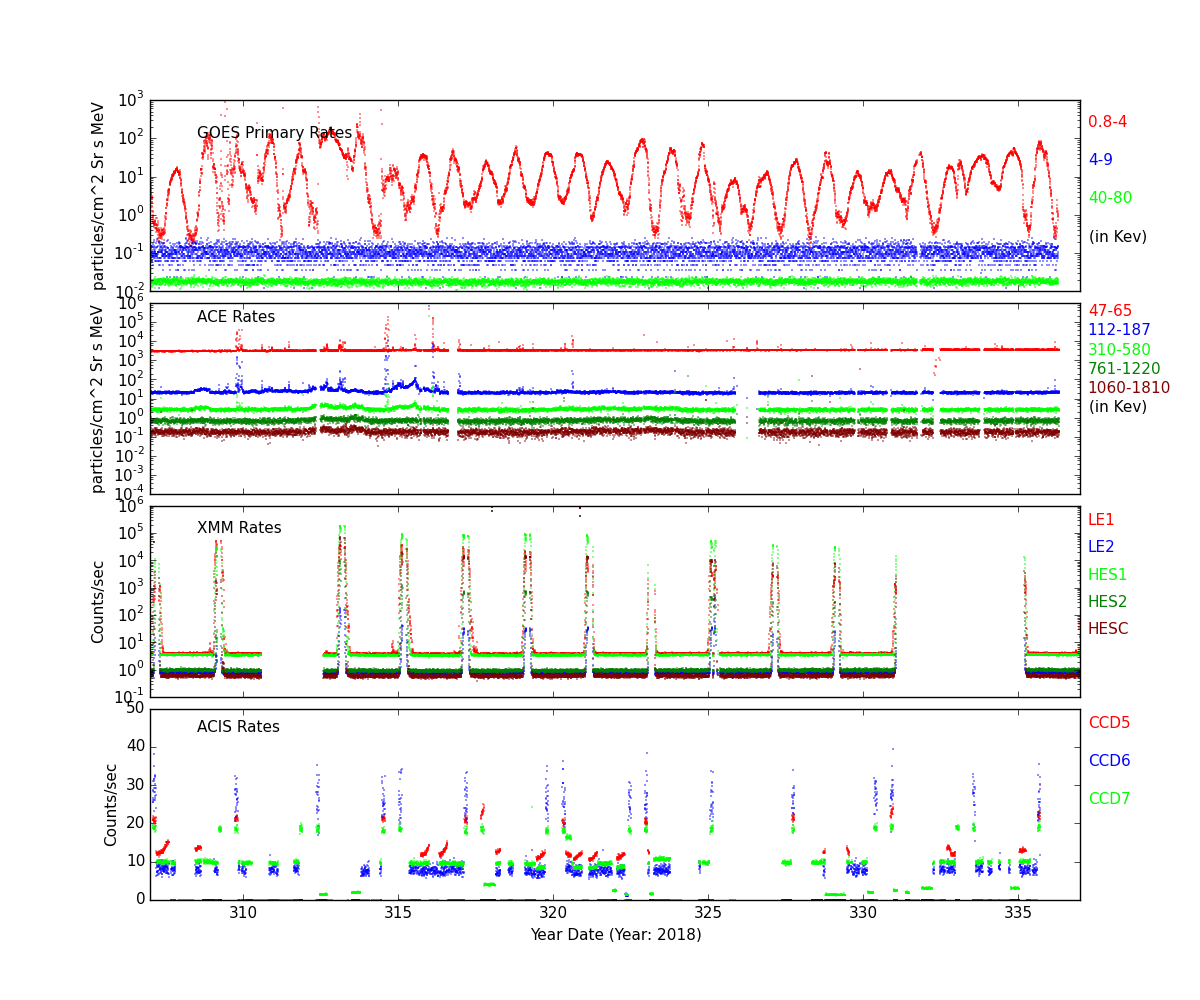
Radiation History
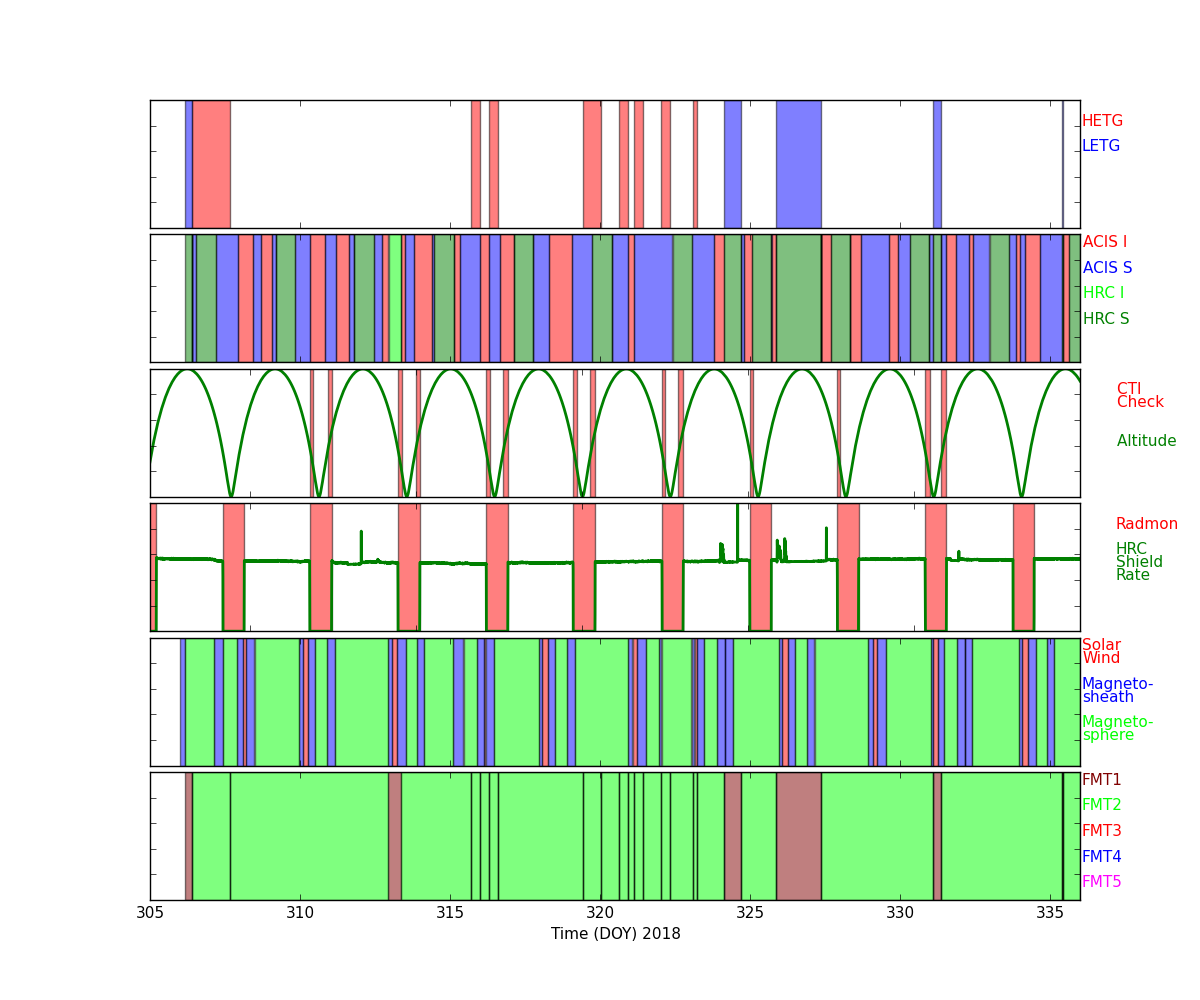
Radiation Count Rates of Nov 2018
Sun Spot History
Trending
Quarterly Trends
- HRMA Heater
| Previous Quarter | ||||||
| MSID | MEAN | RMS | DELTA/YR | DELTA/YR/YR | UNITS | DESCRIPTION |
| ohrthr03 | 295.244 | 0.064 | (4.94+/-0.36)e-5 | -0.019+/-0.003 | K | RT 5: HRMA FORWARD APERTURE PLATE |
|---|---|---|---|---|---|---|
| ohrthr09 | 294.969 | 0.398 | 0.002+/-0.000 | -0.111+/-0.019 | K | RT 105: HRMA CAP |
| ohrthr17 | 294.853 | 0.443 | 0.002+/-0.000 | -0.117+/-0.020 | K | RT 125: HSA OUTER CYNLINDER |
| ohrthr24 | 295.319 | 0.697 | 0.004+/-0.000 | -0.205+/-0.032 | K | RT 12: HRMA AFT HEATER PLATE |
| ohrthr38 | 297.179 | 1.699 | 0.006+/-0.000 | -0.383+/-0.065 | K | RT 120: HRMA AFT COLLIMATOR OUTER CYLINDER |
| ohrthr52 | 294.839 | 0.414 | 0.002+/-0.000 | -0.115+/-0.019 | K | RT 100: HRMA CAP |
- HRMA Thermal
| Previous Quarter | ||||||
| MSID | MEAN | RMS | DELTA/YR | DELTA/YR/YR | UNITS | DESCRIPTION |
| 4rt568t | 296.152 | 1.679 | 0.006+/-0.000 | -0.229+/-0.068 | K | RT 568 - HRMA AHS INNER CYLINDER |
|---|---|---|---|---|---|---|
| 4rt569t | 295.213 | 0.618 | 0.003+/-0.000 | -0.212+/-0.033 | K | RT 569 - PERISCOPE (FIRST FOLD END) |
| 4rt570t | 294.903 | 0.388 | 0.002+/-0.000 | -0.160+/-0.022 | K | RT 570 - HRMA RRCA |
| 4rt575t | 300.209 | 2.024 | 0.006+/-0.000 | -0.255+/-0.076 | K | RT 575 - OB FWD CONE TEMP |
| 4rt576t | 292.093 | 1.676 | 0.006+/-0.000 | -0.228+/-0.069 | K | RT 576 - OB FWD CONE TEMP |
| 4rt578t | 298.497 | 2.738 | 0.004+/-0.000 | -0.120+/-0.090 | K | RT 578 - OB MID CONE TEMP |
- MUPS
| Previous Quarter | ||||||
| MSID | MEAN | RMS | DELTA/YR | DELTA/YR/YR | UNITS | DESCRIPTION |
| pm1thv1t | 346.696 | 8.575 | -0.002+/-0.001 | 0.665+/-0.149 | K | MUPS 1 THRUSTER VALVE 01 TEMP |
|---|---|---|---|---|---|---|
| pline02t | 327.733 | 9.484 | -0.009+/-0.001 | 1.418+/-0.210 | K | PROP LINE TEMP 02 |
| pline03t | 323.246 | 12.283 | -0.010+/-0.001 | 1.911+/-0.249 | K | PROP LINE TEMP 03 |
| pline04t | 308.494 | 10.792 | -0.012+/-0.001 | 1.493+/-0.267 | K | PROP LINE TEMP 04 |
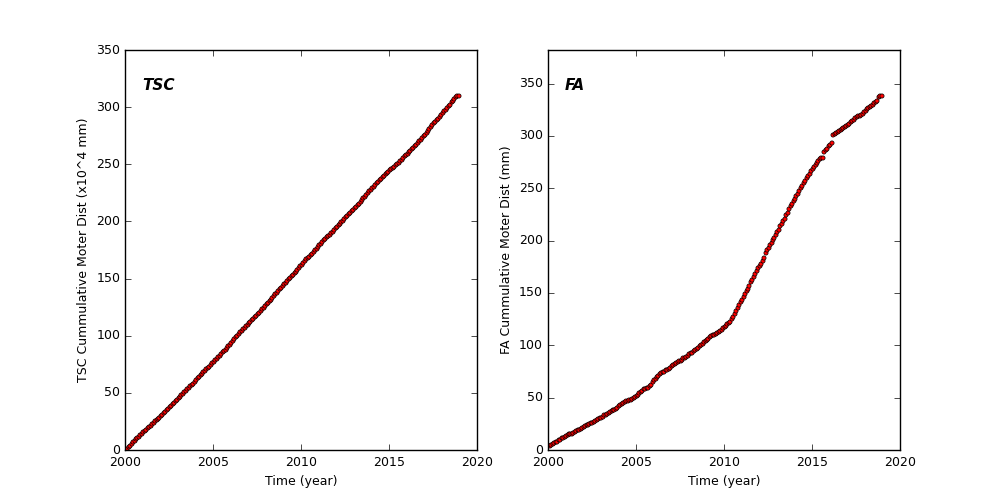
Spacecraft Motions
TSC and FA Cummulative Moter Distance
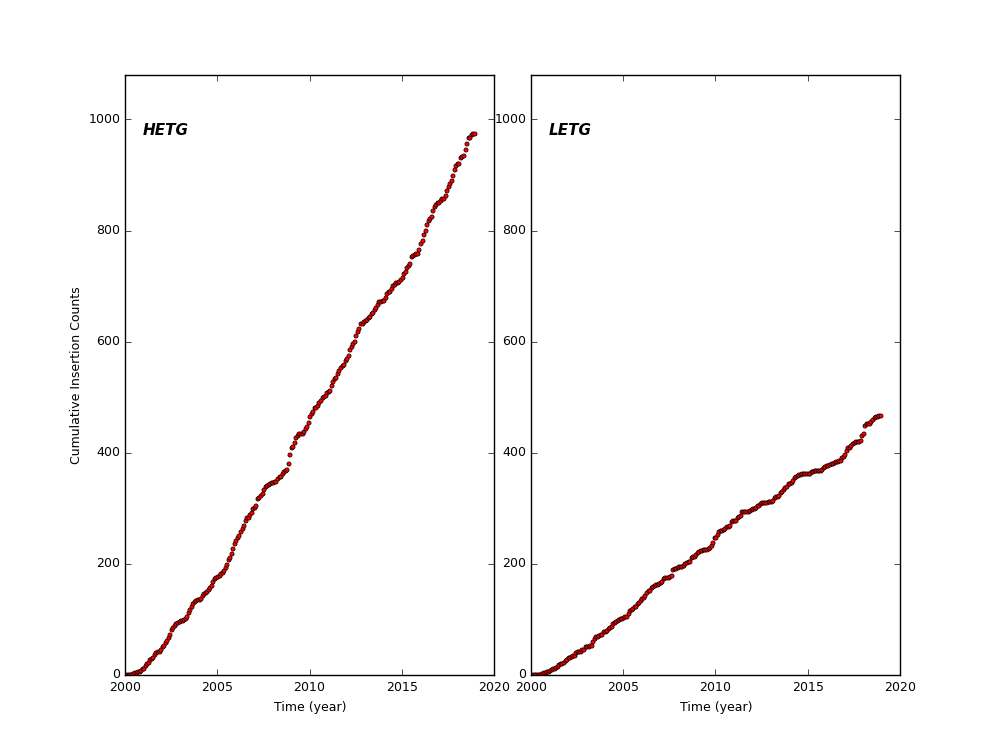
HETG and LETG Cummulative Insertion Counts
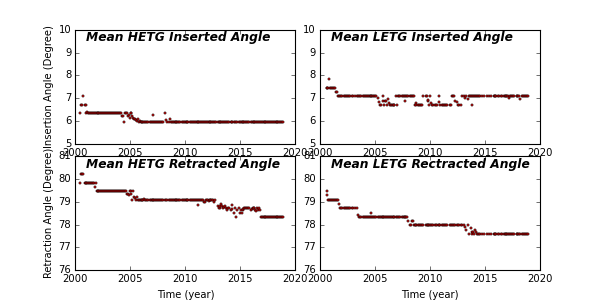
HETG/LETG Insertion/Retraction Angle
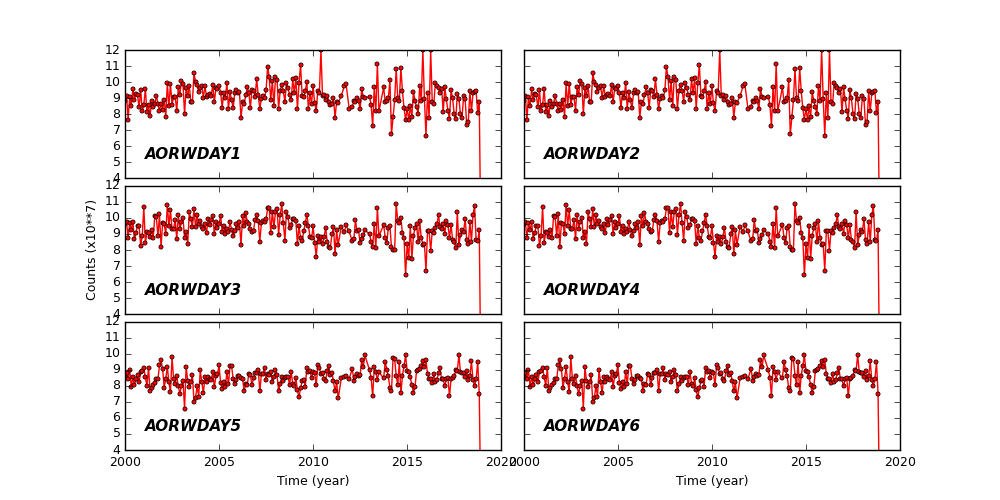
Reaction Wheel Rotations