ACIS
ACIS DOSE Registered-Photon-Map
The steps we took to compute the dose map are;
- Level 1 Event files for a specified month are obtained from archive.
- Image data including I2, I3, S2, S3 CCDs are extracted from all event files.
- All the extracted image data were merged to create a month long exposure map for the month.
- The exposure map is opened with ds9, and check a distribution of count rates against energy. From this, estimate the upper threshold value. Any events beyond this upper threshold are assumed erroneous events such as bad pixels.
- Using this upper threshold, the data is filtered, and create a cleaned exposure map for the month.
- The exposure map from each month from the Sep 1999 is added up to create a cumulative exposure map for each month.
- Using fimgstatistic, we compute count rate statistics for each CCDs.
- For observations with high data drop rates (e.g., Crab nebula, Cas A), we corrected the observations by adding events.
Please check more detail plots at Telemetered Photon Dose Trend page.
)
)
)
Statistics:
# IMAGE     NPIX     MEAN        RMS        MIN     MAX
ACIS_oct19 6004901       7.484         10.500           0.0     2302


I2 node 0  262654	6.838854	3.182857	0.0	 52.0
I2 node 1  262654	7.057474	6.900412	0.0	2302.0
I2 node 2  262654	6.909552	4.398111	0.0	1563.0
I2 node 3  262654	7.035749	5.385070	0.0	2137.0

I3 node 0  262654	7.877734	5.256265	0.0	1755.0
I3 node 1  262654	7.491939	3.299602	0.0	140.0
I3 node 2  262654	7.407957	3.272137	0.0	 77.0
I3 node 3  262654	7.774703	4.001074	0.0	1020.0

S2 node 0  262654	9.033368	4.138670	0.0	363.0
S2 node 1  262654	9.577054	5.031152	0.0	358.0
S2 node 2  262654	10.886841	7.363308	0.0	299.0
S2 node 3  262654	11.019213	9.468524	0.0	528.0

S3 node 0  262654	14.365579	12.008241	0.0	196.0
S3 node 1  262654	15.428949	11.358692	0.0	235.0
S3 node 2  262654	14.944807	10.256289	0.0	164.0
S3 node 3  262654	12.912072	7.139661	0.0	 79.0
)
)
)
Statistics:
 IMAGE     NPIX      MEAN        RMS           MIN      MAX
ACIS_total   6004901       2340.815         3025.781           0.0   130926


I2 node 0  262654	2029.018790	404.056591	430.0	11725.0
I2 node 1  262654	2134.895657	568.343119	446.0	100885.0
I2 node 2  262654	2163.655413	458.011684	450.0	11925.0
I2 node 3  262654	2168.924448	559.730003	435.0	28625.0

I3 node 0  262654	2309.095254	569.294382	424.0	9764.0
I3 node 1  262654	2390.184610	1703.589047	452.0	55407.0
I3 node 2  262654	2111.881088	393.083417	431.0	12157.0
I3 node 3  262654	2104.017720	422.893571	387.0	32627.0

S2 node 0  262654	2725.617406	432.103721	1515.0	21947.0
S2 node 1  262654	2889.266266	647.276828	1685.0	15845.0
S2 node 2  262654	3195.897748	654.672475	2116.0	27828.0
S2 node 3  262654	3148.551906	514.170620	1871.0	60511.0

S3 node 0  262654	4827.658421	2317.037907	2116.0	33799.0
S3 node 1  262654	6050.781240	2290.336030	0.0	29922.0
S3 node 2  262654	4802.872928	1281.736685	2070.0	25710.0
S3 node 3  262654	3712.891231	677.558609	2281.0	25174.0
)
|
)
|
)
|
)
|
| Jul 2019 | Apr 2019 | Jan 2019 | Oct 2018 |
|---|
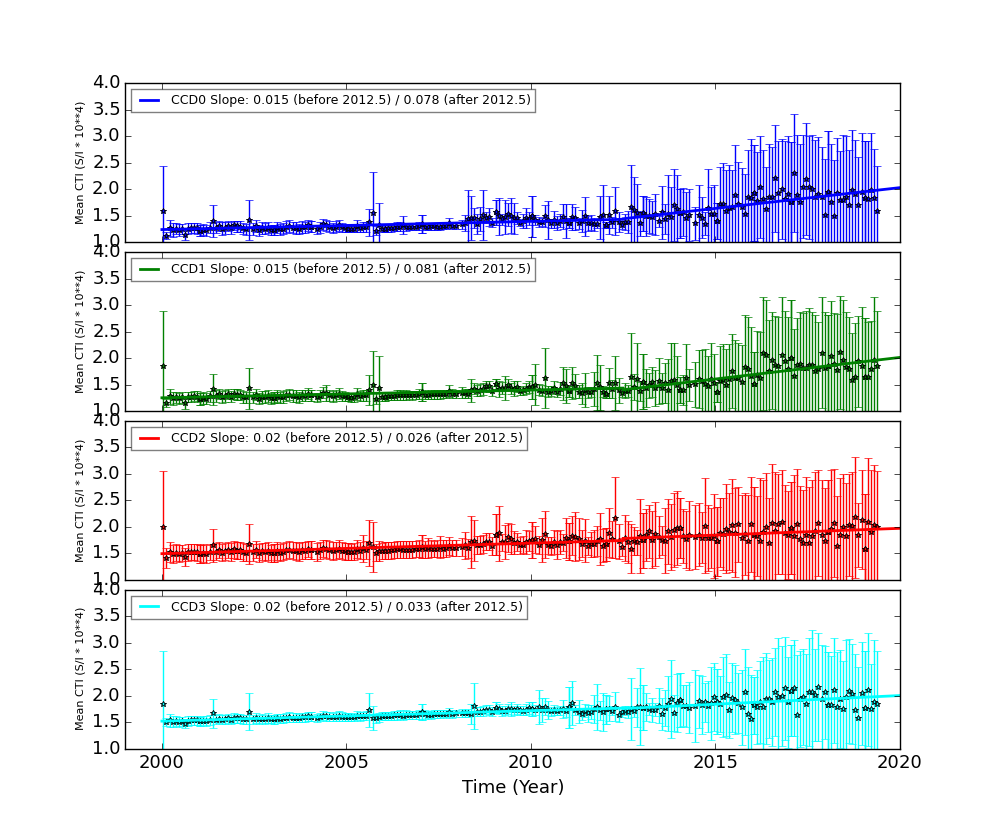
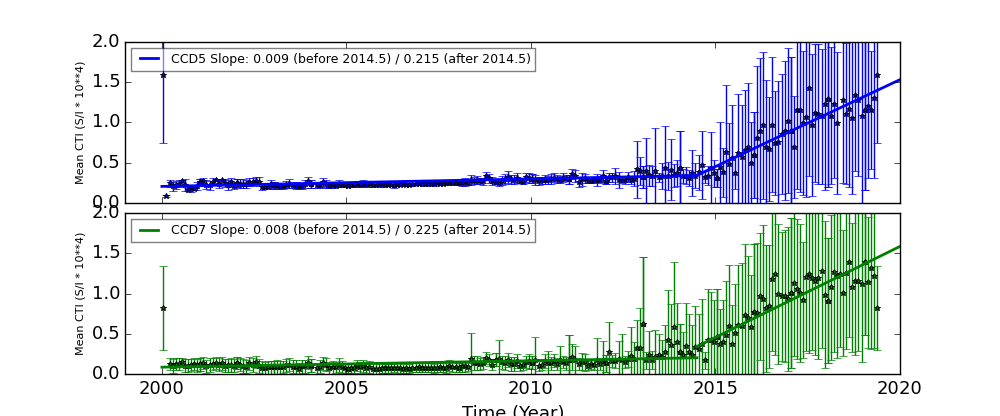
The Mean Detrended CTI
We report CTIs with a refined data definition. CTIs were computed for the temperature dependency corrected data. Please see CTI page for detailed explanation. CTI's are computed for Mn K alpha, and defined as slope/intercept x10^4 of row # vs ADU. Data file: here
Imaging CCDs
Spectral CCDs
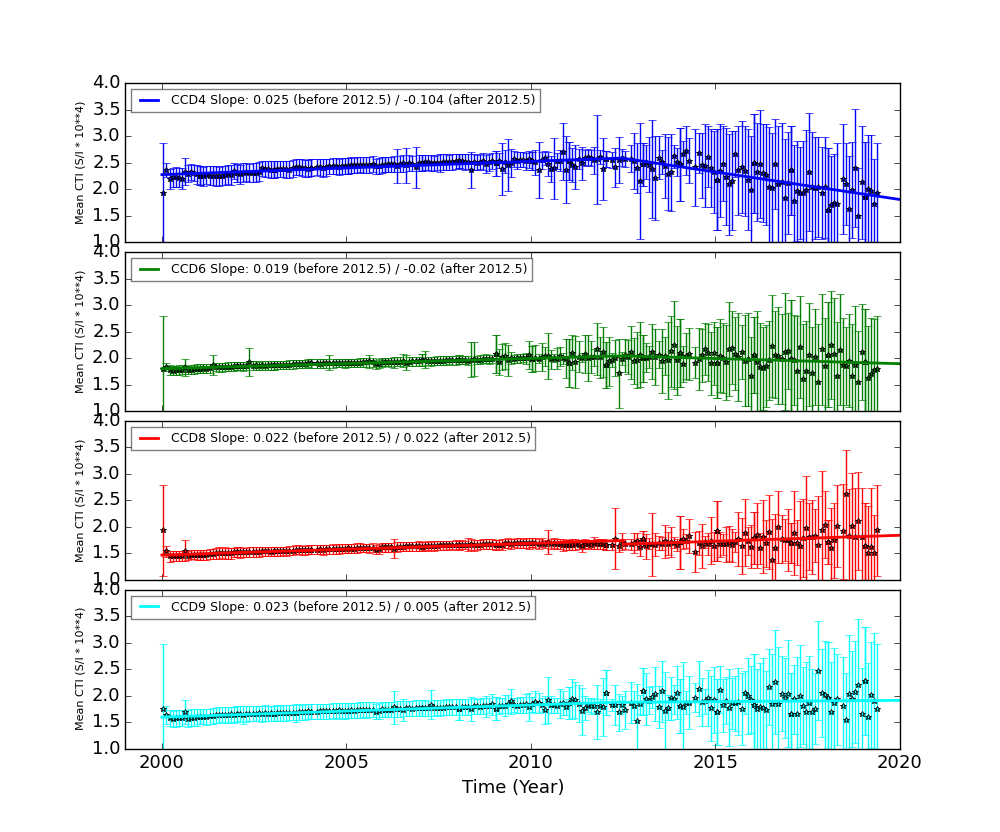
Backside CCDs
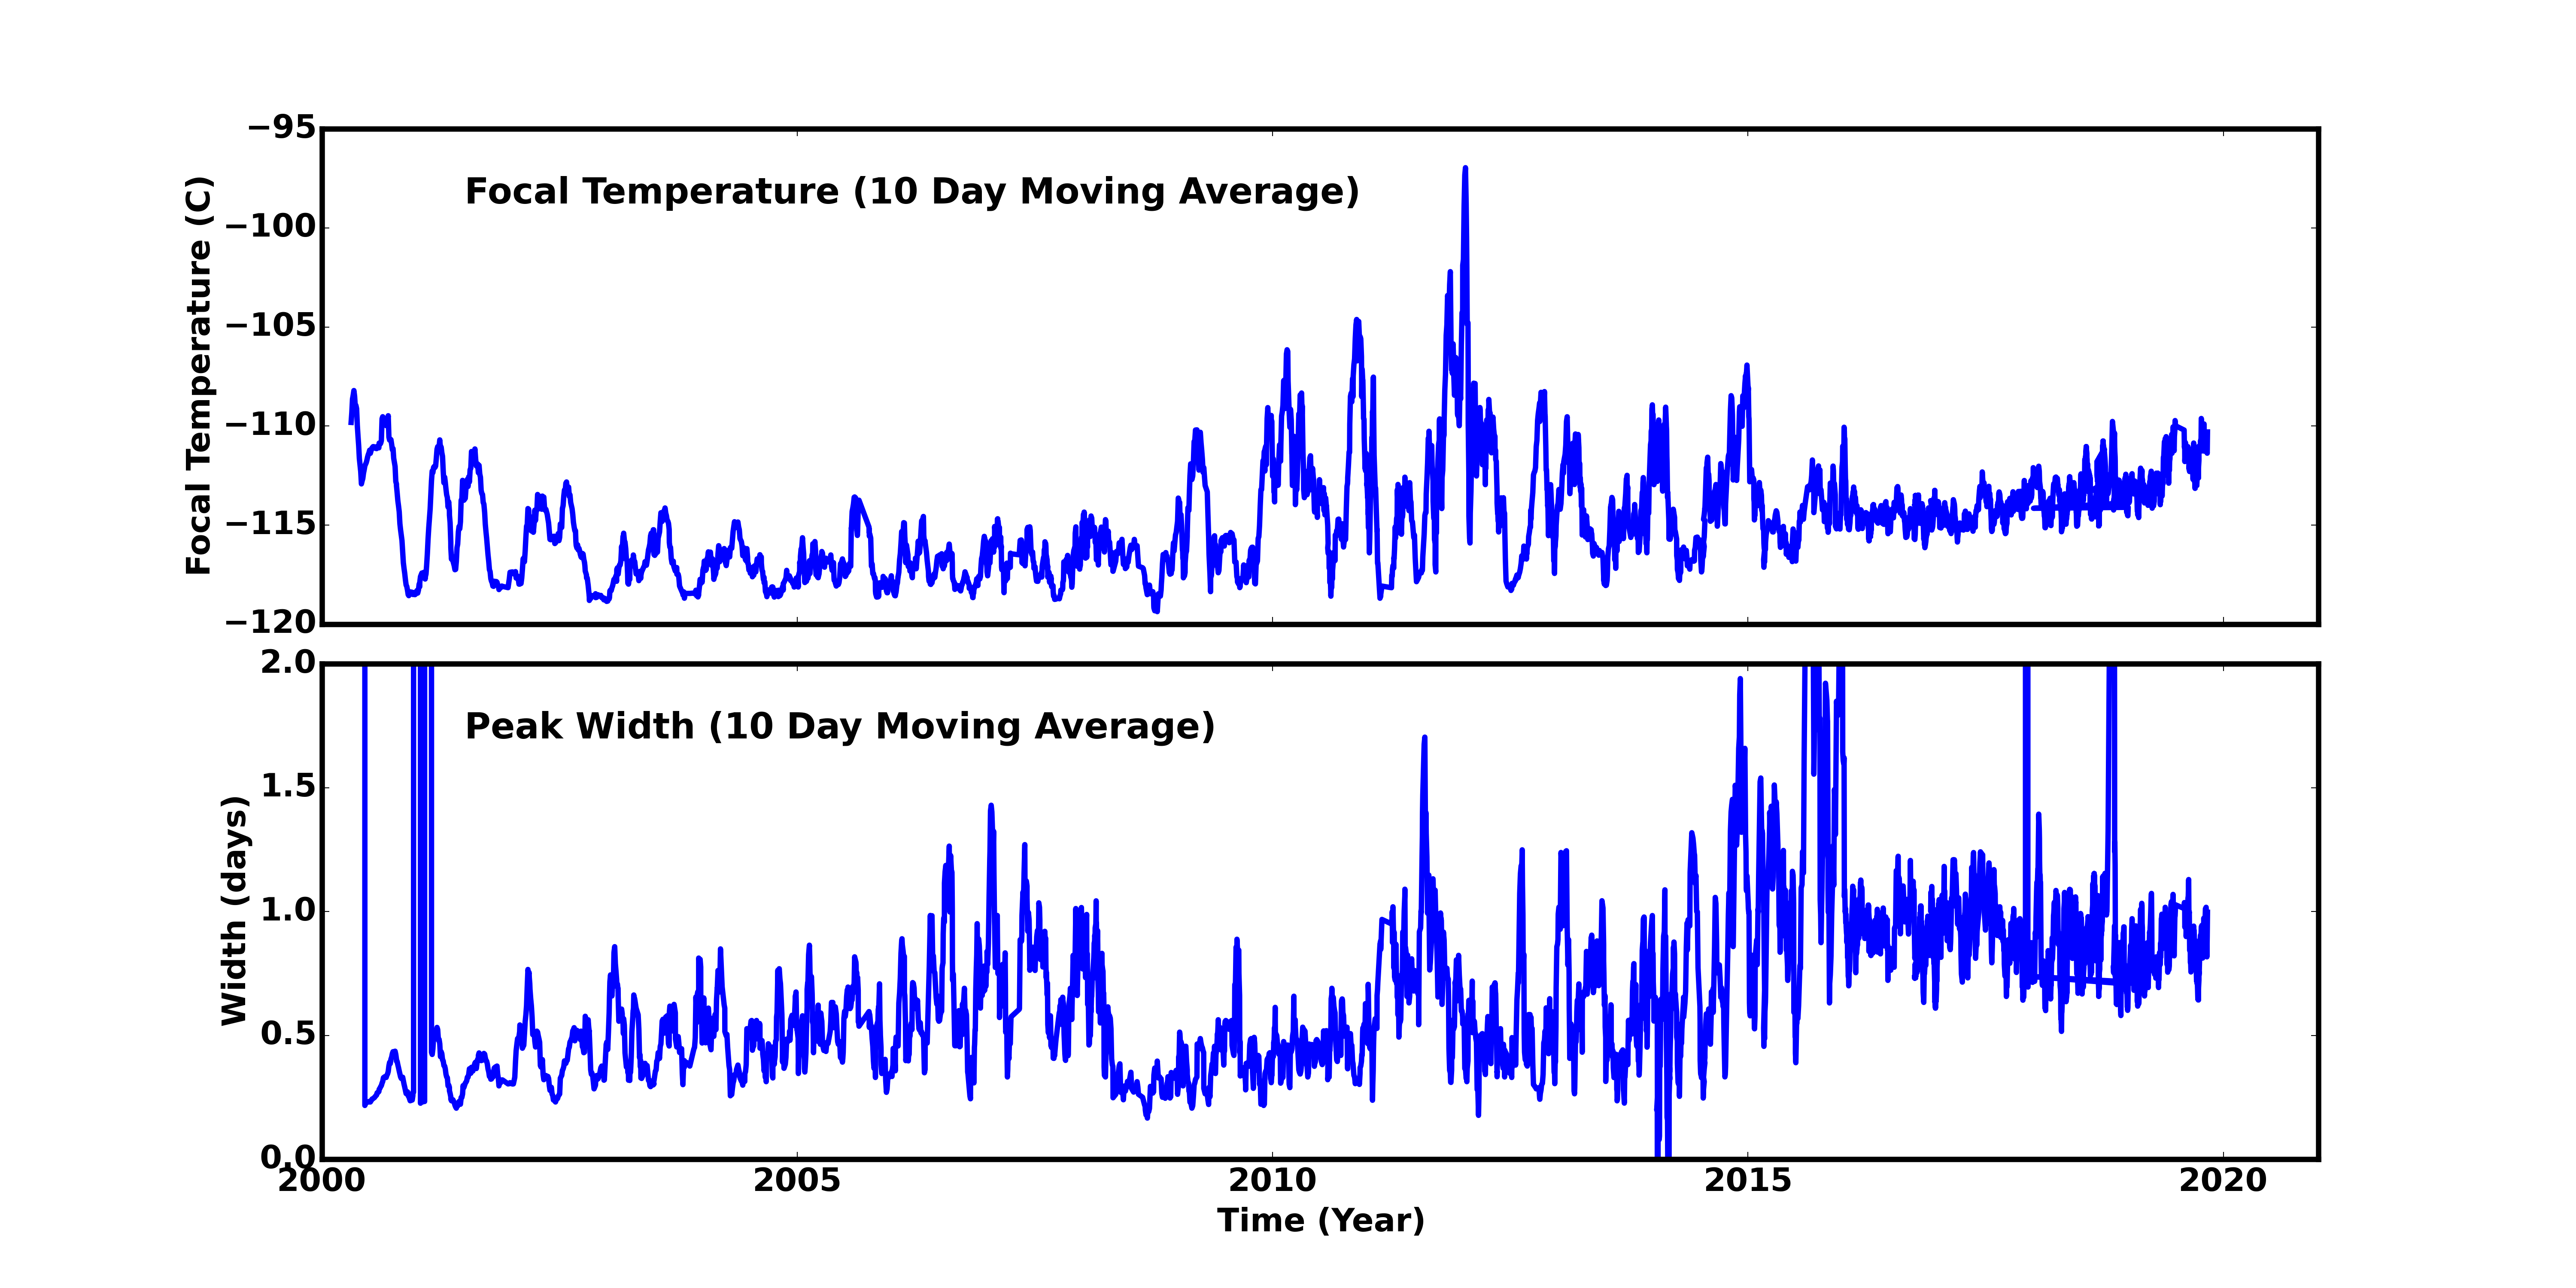
Focal Plane Temperature
Oct 2019 Focal Temperature
| The Mean (max) FPT: | |
|---|---|
| -110.63 | +/- 3.02 C |
| Mean Width: | |
| 0.93 | +/- 0.48 days |
Averaged Focal Plane Temperature
We are using 10 period moving averages to show trends of peak temperatures and peak widths. Note, the gaps in the width plot are due to missing/corrupted data.
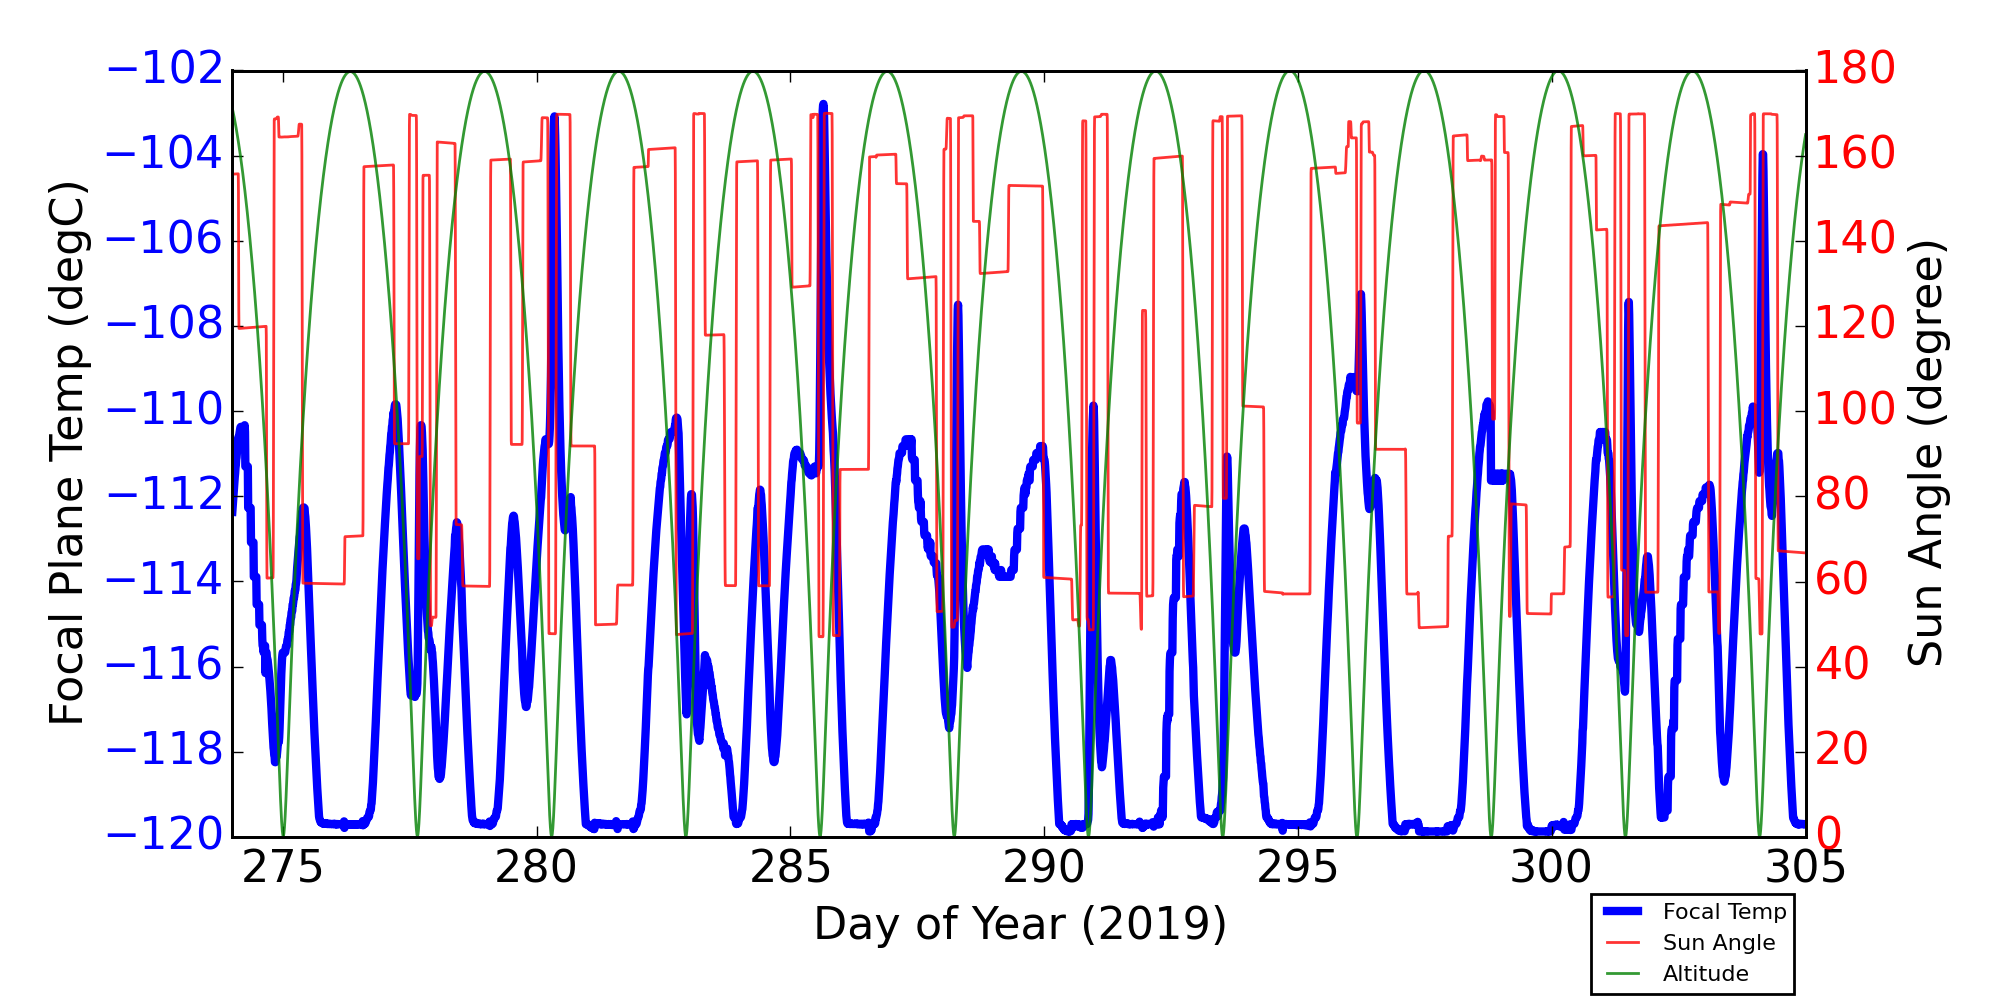
Focal Plane Temperature, Sun Angle and Altitude
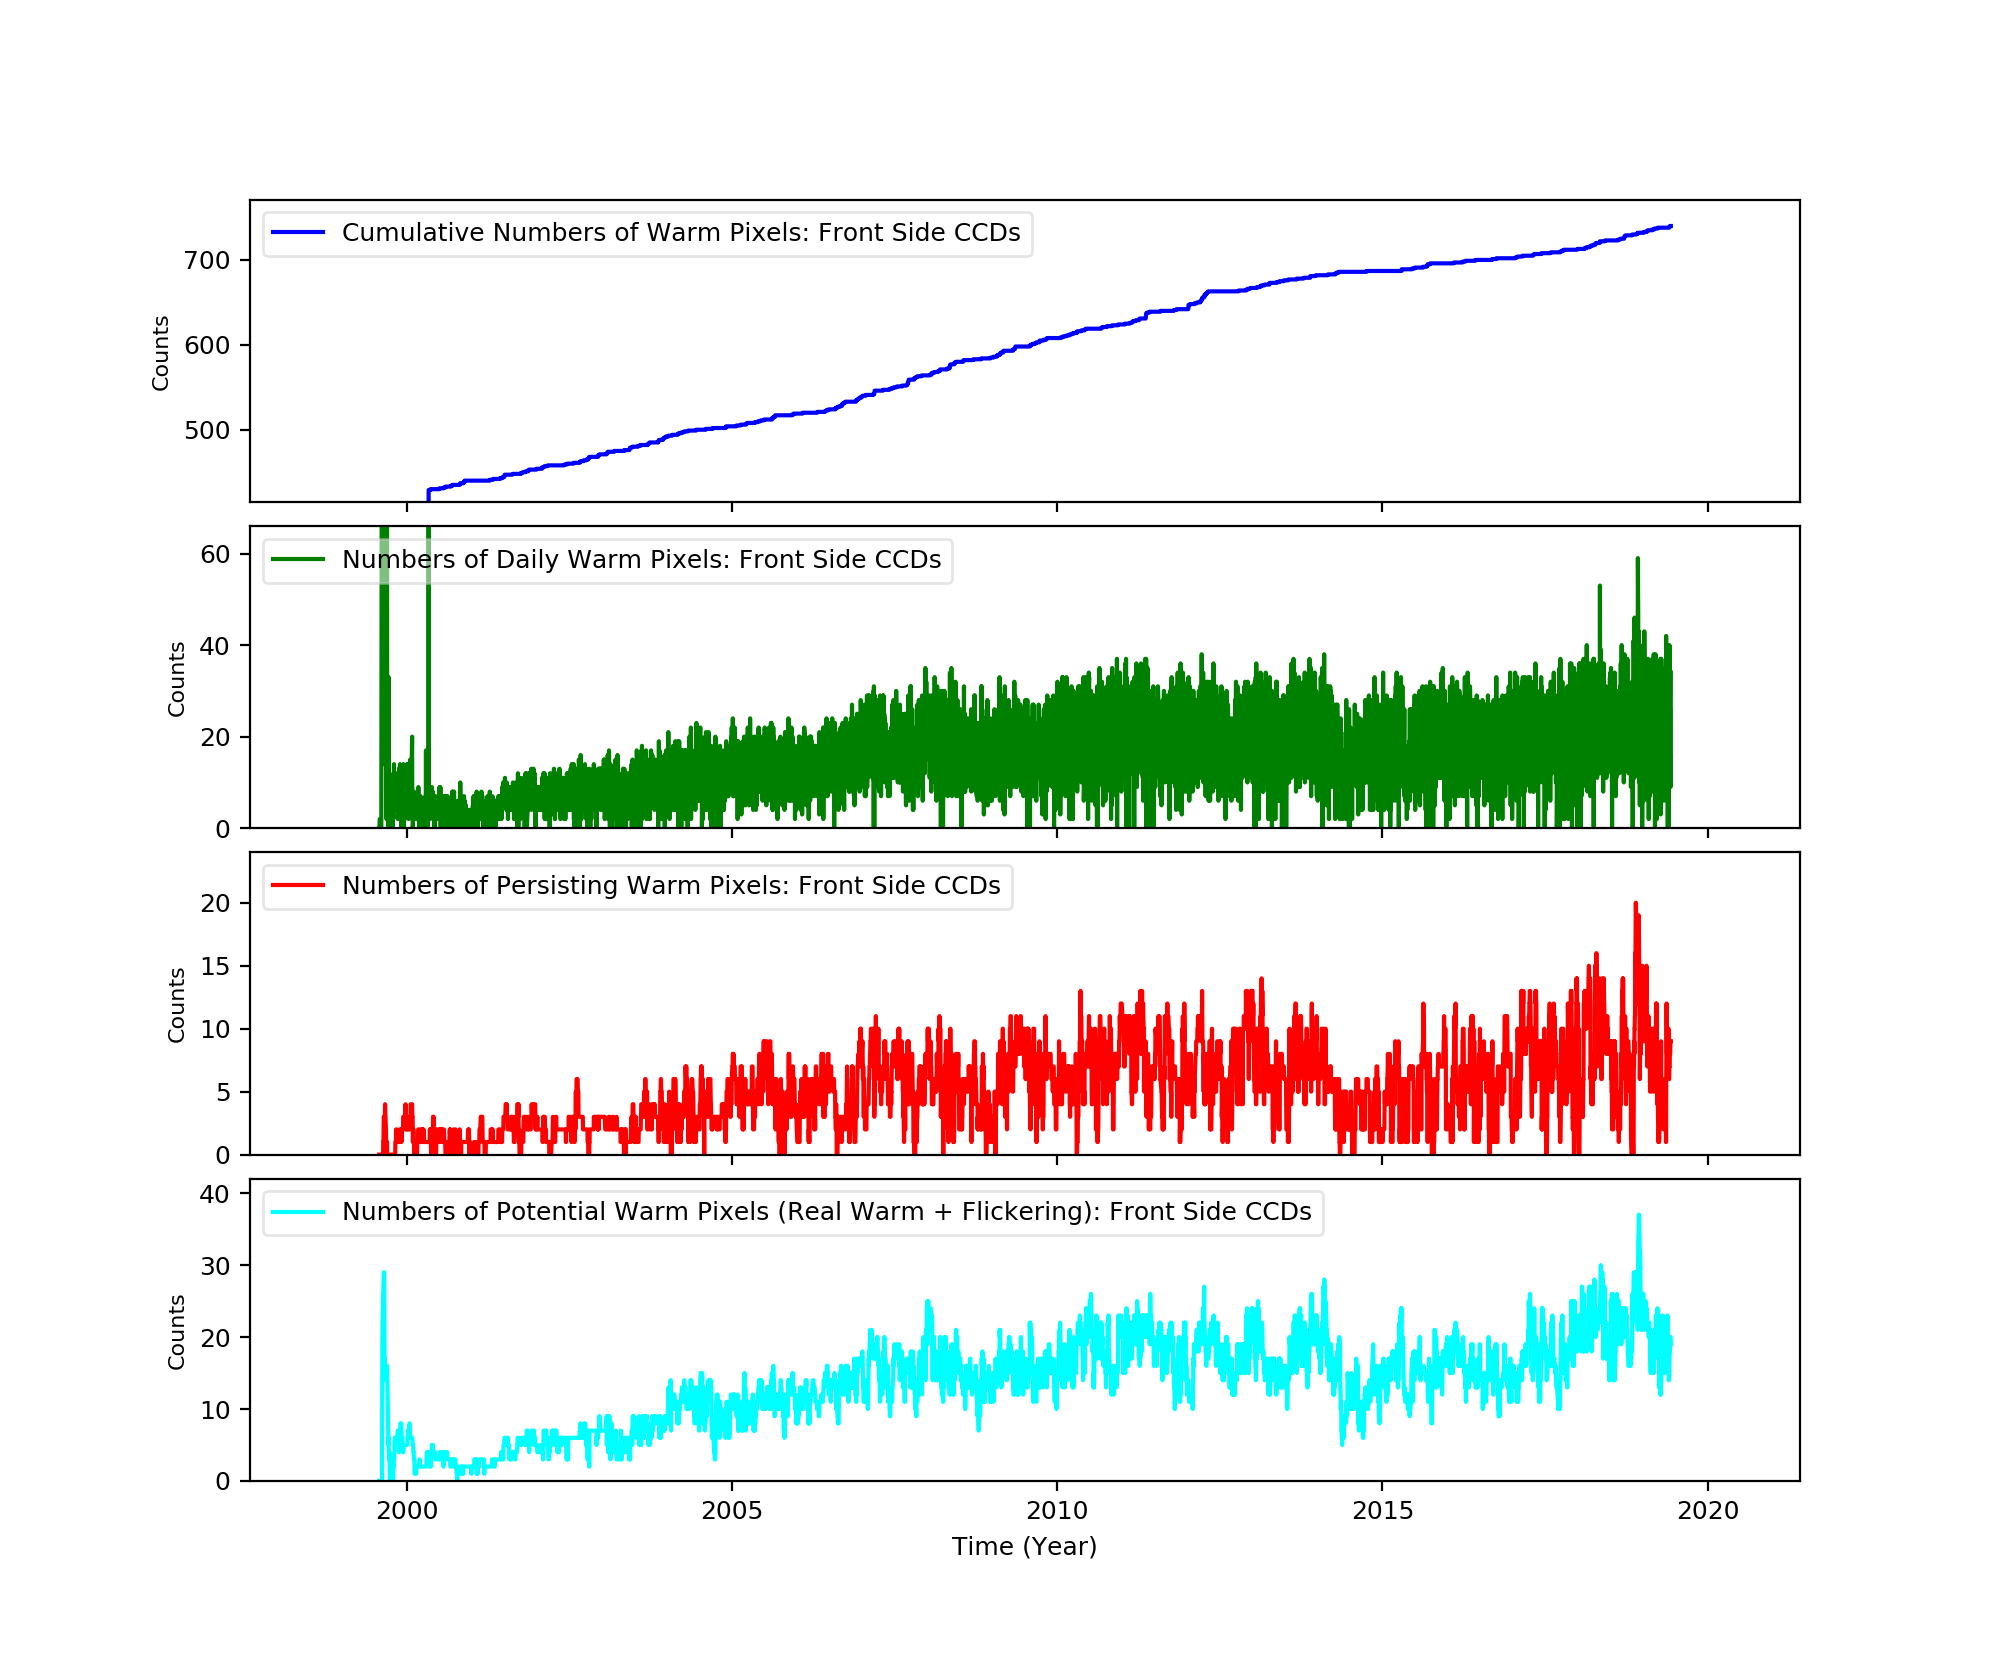
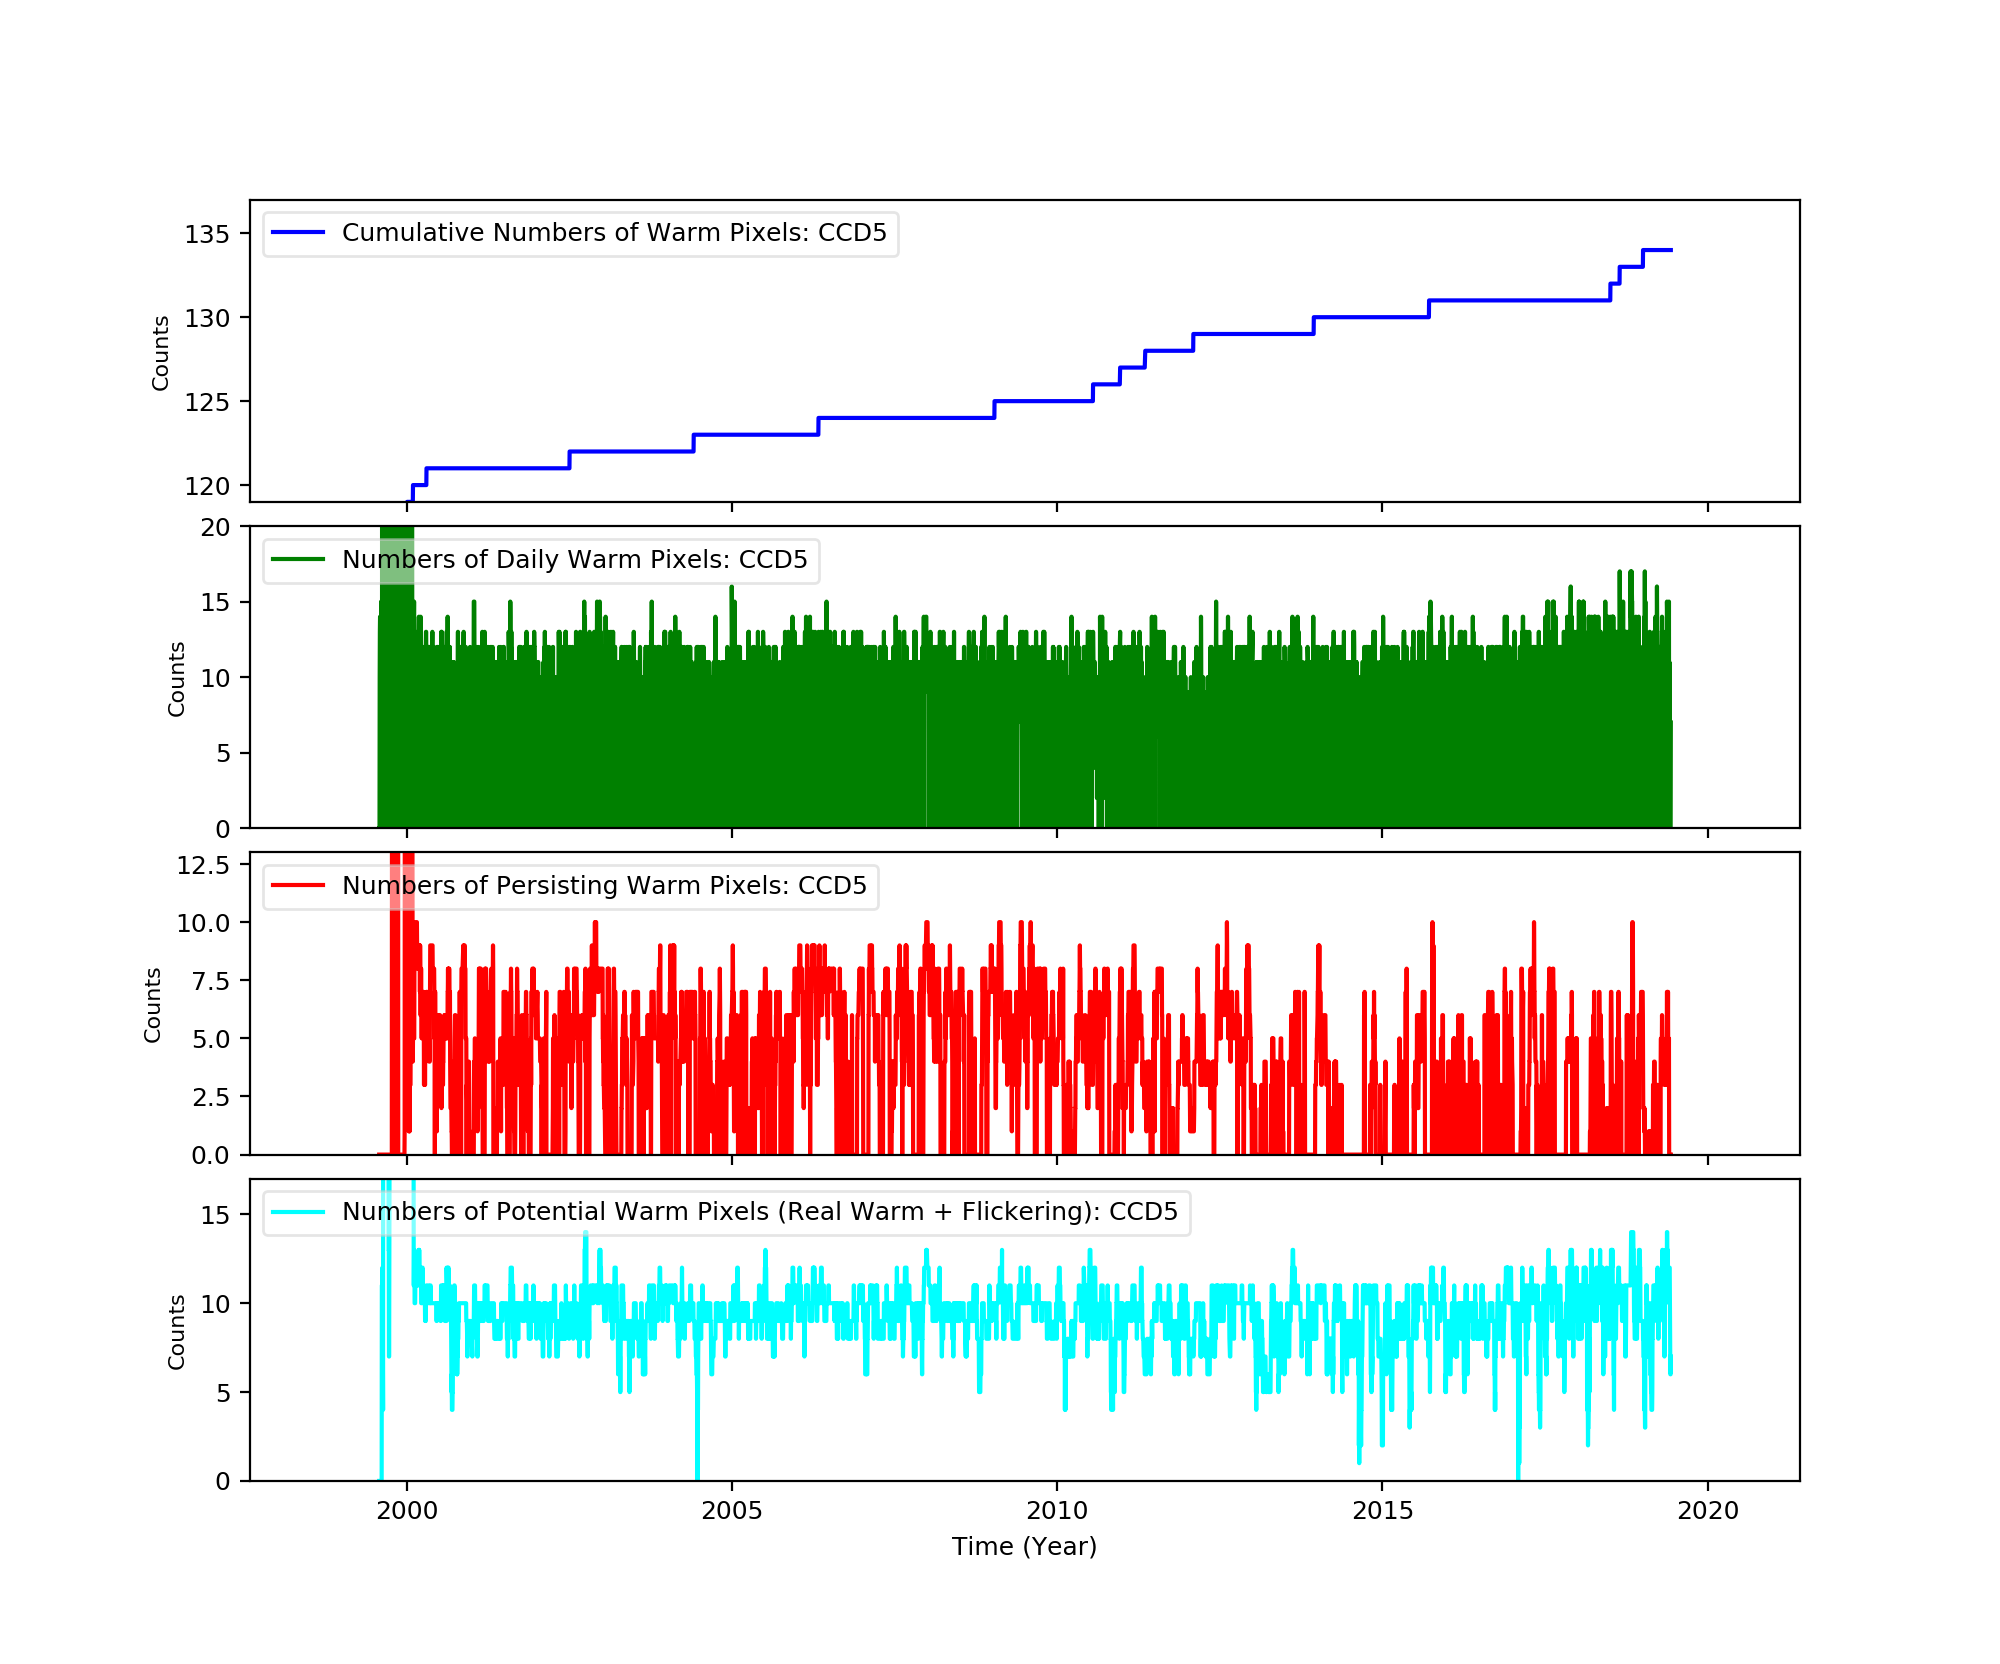
Bad Pixels
The plots below were generated with a new warm pixel finding script. Please see Acis Bad Pixel Page for details.
Front Side CCDs
Back Side CCD (CCD5)
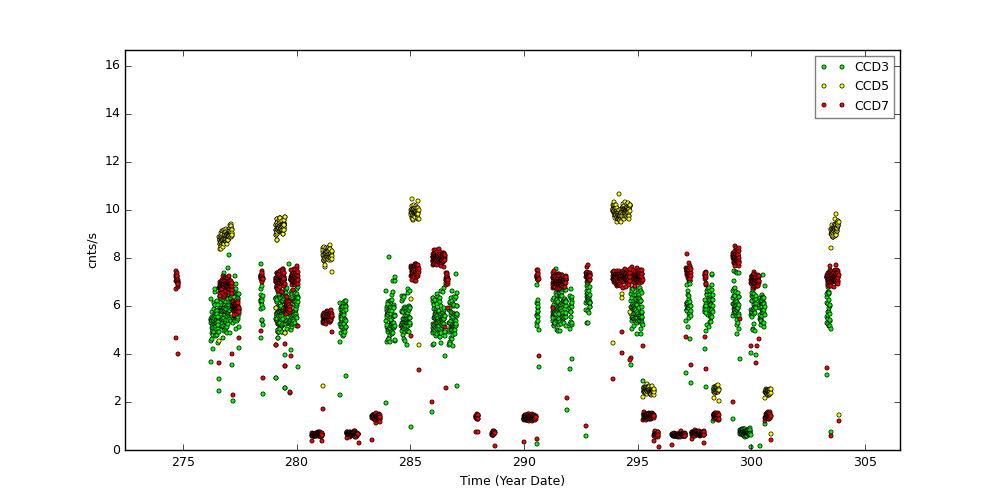
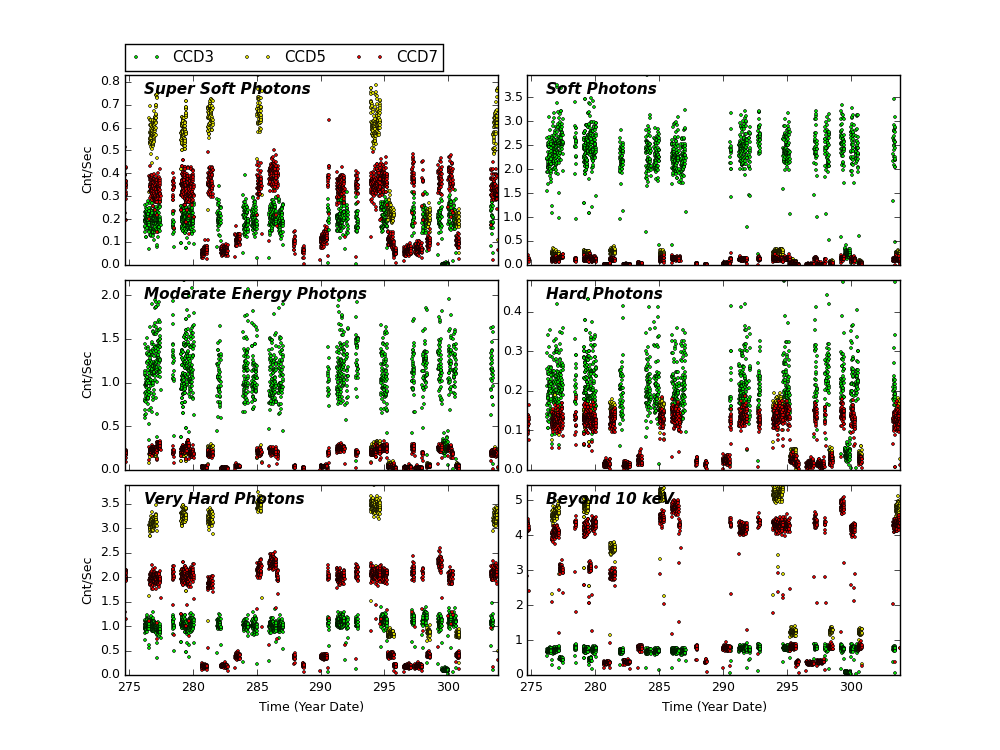
Science Instrument Background Rates
| Name | Low (keV) | High(KeV) | Description |
|---|---|---|---|
| SSoft | 0.00 | 0.50 | Super soft photons |
| Soft | 0.50 | 1.00 | Soft photons |
| Med | 1.00 | 3.00 | Moderate energy photons |
| Hard | 3.00 | 5.00 | Hard Photons |
| Harder | 5.00 | 10.00 | Very Hard photons |
| Hardest | 10.00 | Beyond 10 keV |
HRC
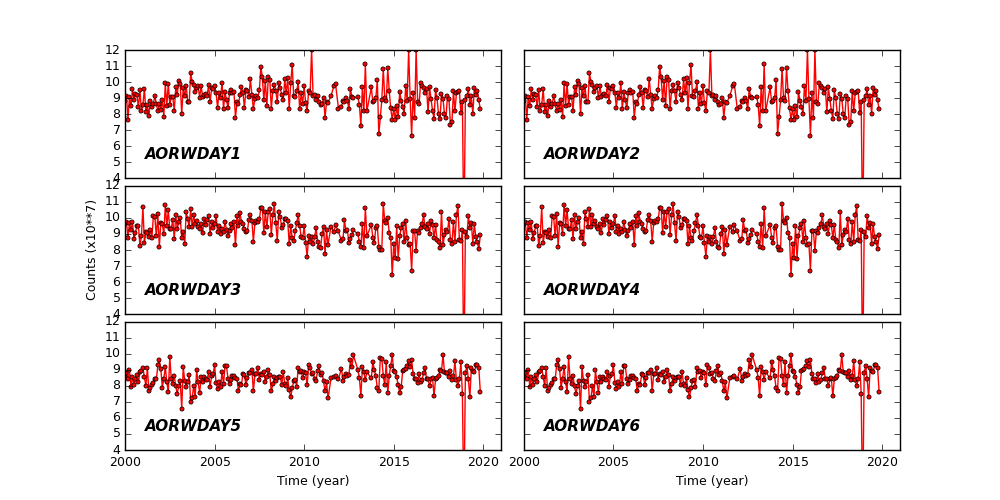
DOSE of Central 4K Pore-Pairs
Please refer to Maximum Dose Trends for more details.
)
|
|---|
IMAGE                NPIX      MEAN    STDDEV      MIN       MAX
HRCI_10_2019.fits  16777216	0.044 	0.213 	0.000 	10.000
)
IMAGE                       NPIX      MEAN    STDDEV      MIN       MAX
HRCI_08_1999_10_2019.fits  16777216	6.010 	5.855 	0.000 	303.000
)
|
|---|
IMAGE                NPIX      MEAN    STDDEV      MIN       MAX
HRCS_10_2019.fits  16777216	0.168 	0.478 	0.000 	7.000
)
IMAGE                       NPIX      MEAN    STDDEV      MIN       MAX
HRCS_08_1999_10_2019.fits  16777216	18.415 	33.580 	0.000 	1746.000
|
|
Max dose trend plots corrected for events that "pile-up"
in the center of the taps due to bad position information.
|
)
|
)
|
)
|
)
|
| Jul 2019 | Apr 2019 | Jan 2019 | Oct 2018 |
|---|
)
|
)
|
)
|
)
|
| Jul 2019 | Apr 2019 | Jan 2019 | Oct 2018 |
|---|
Gratings
Grating Trends/Focus
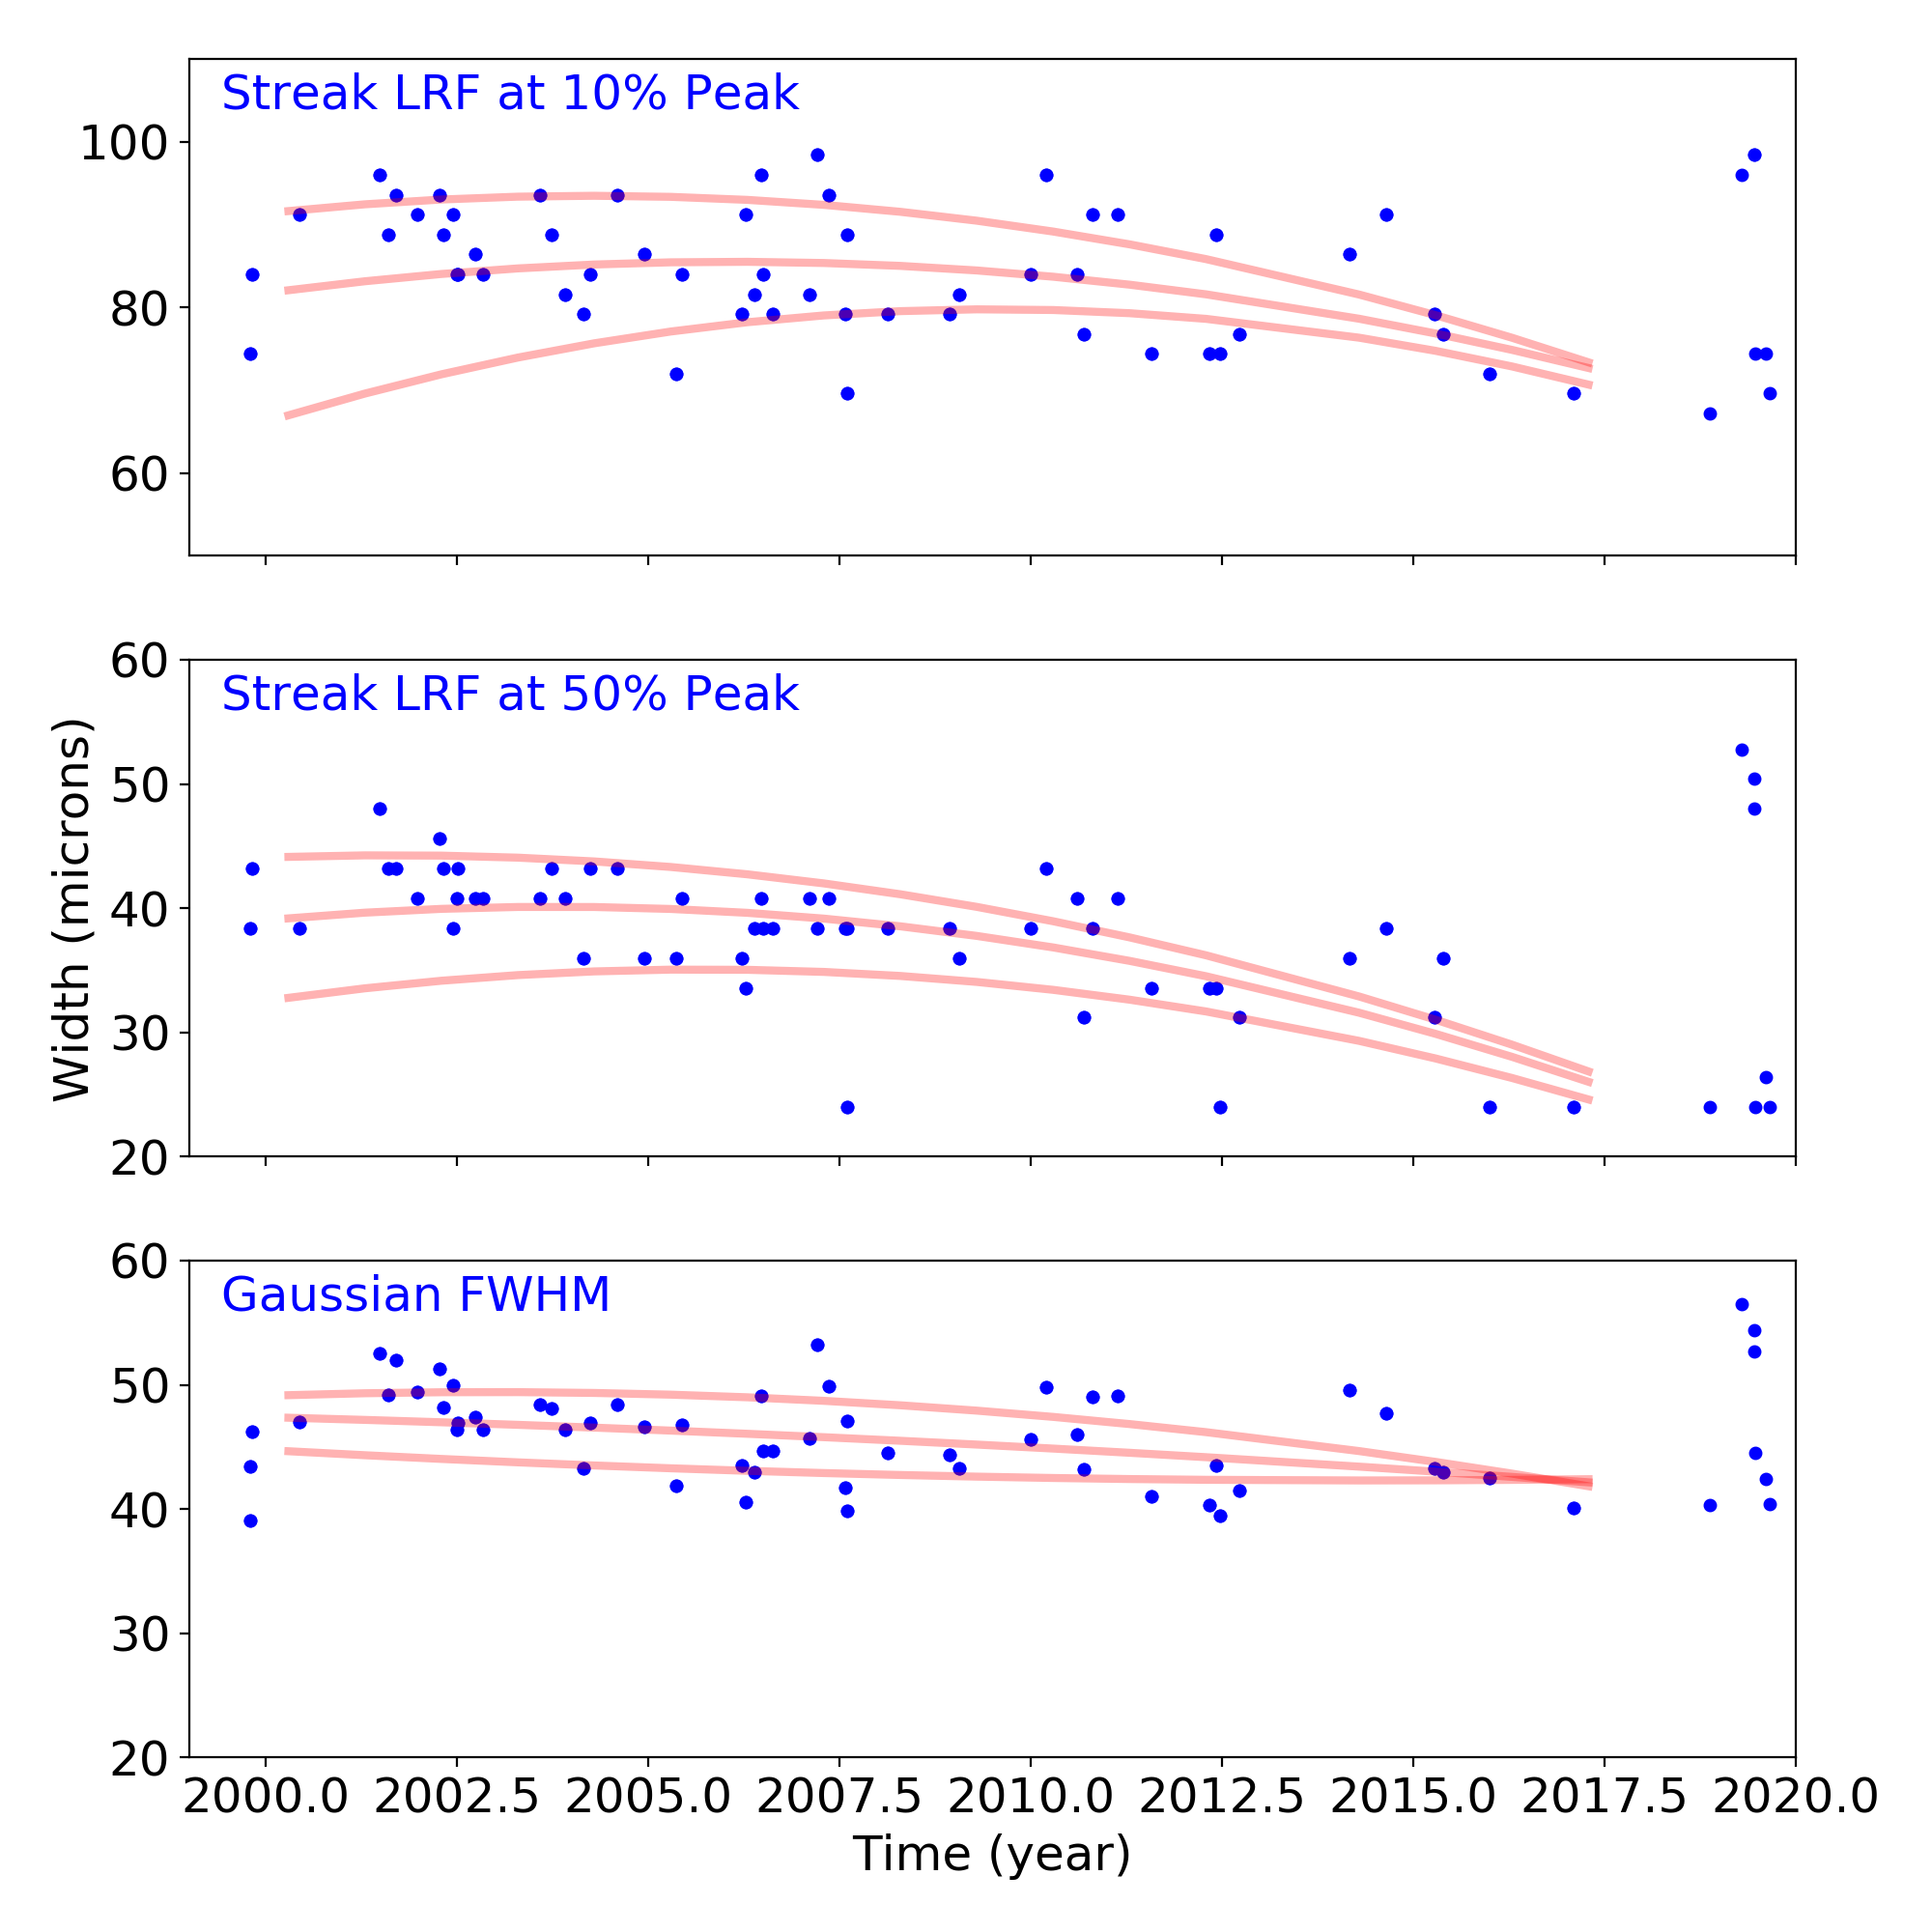
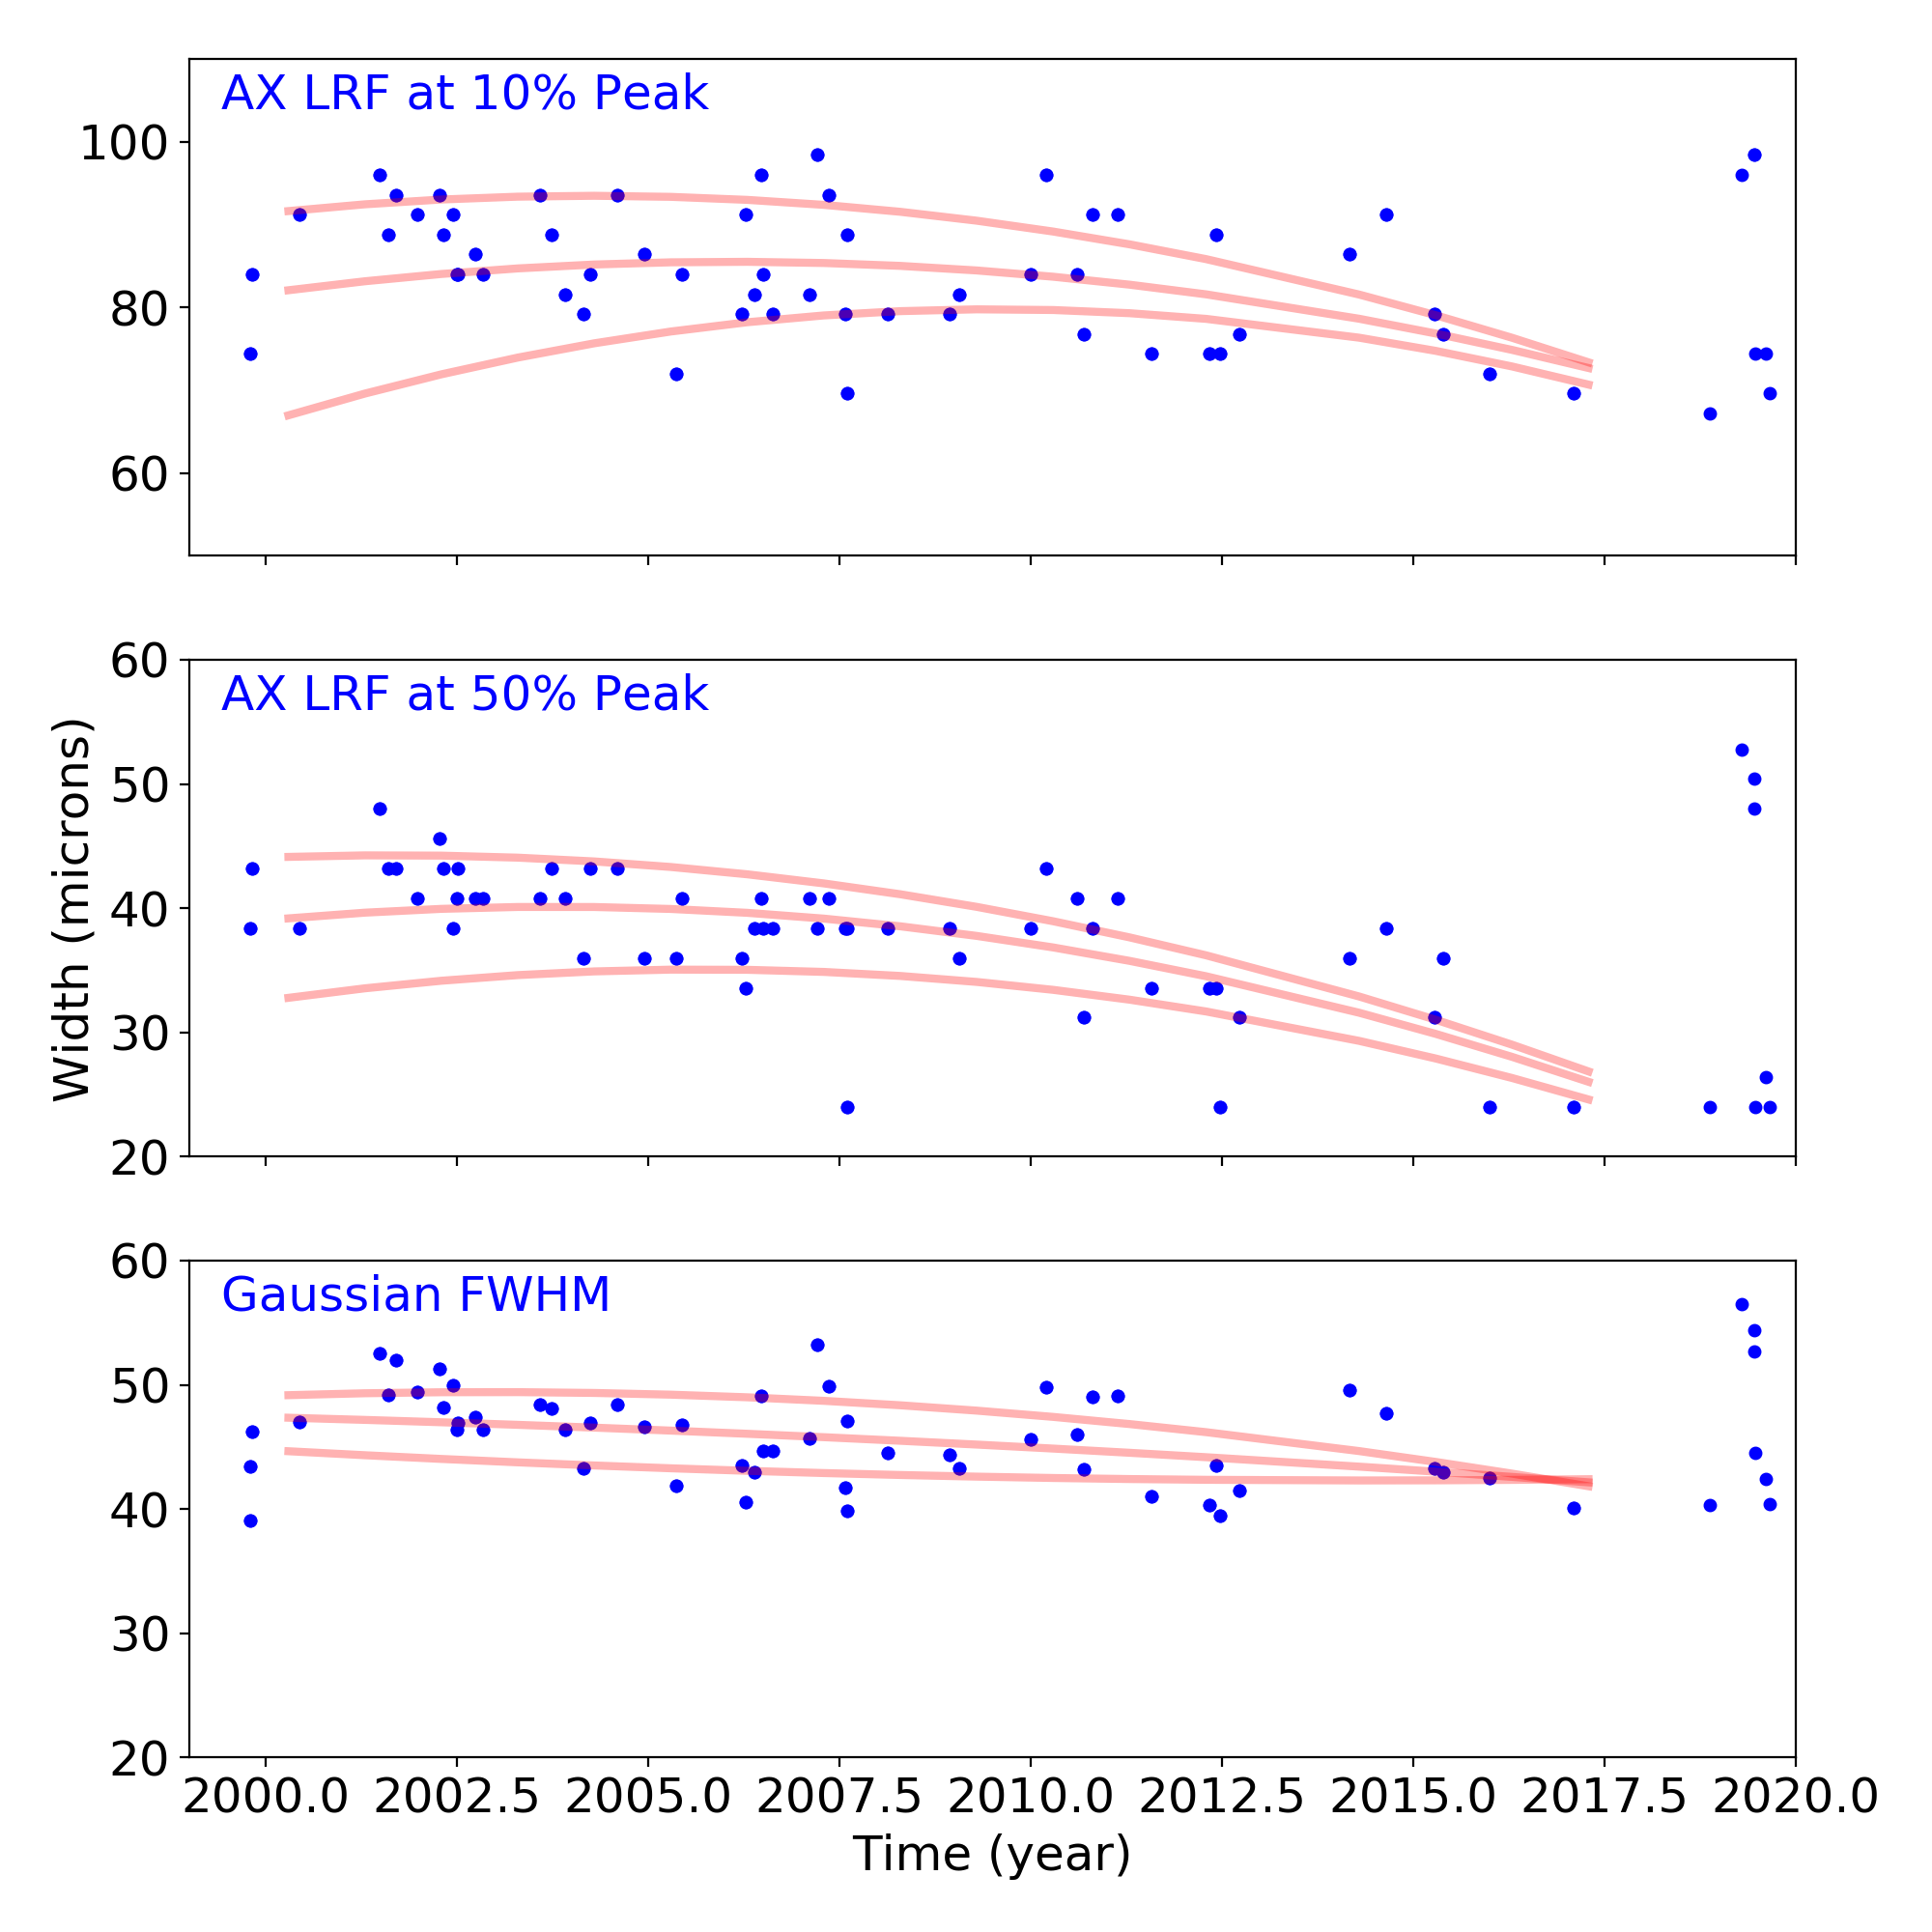
We plot the width of the zero order streak of ACIS/HETG observations and the width of the zero order image for HRC/LETG observations of point sources. No significant defocusing trend is seen at this time. See Gratings Trends pages.
Gratings Resolving Power
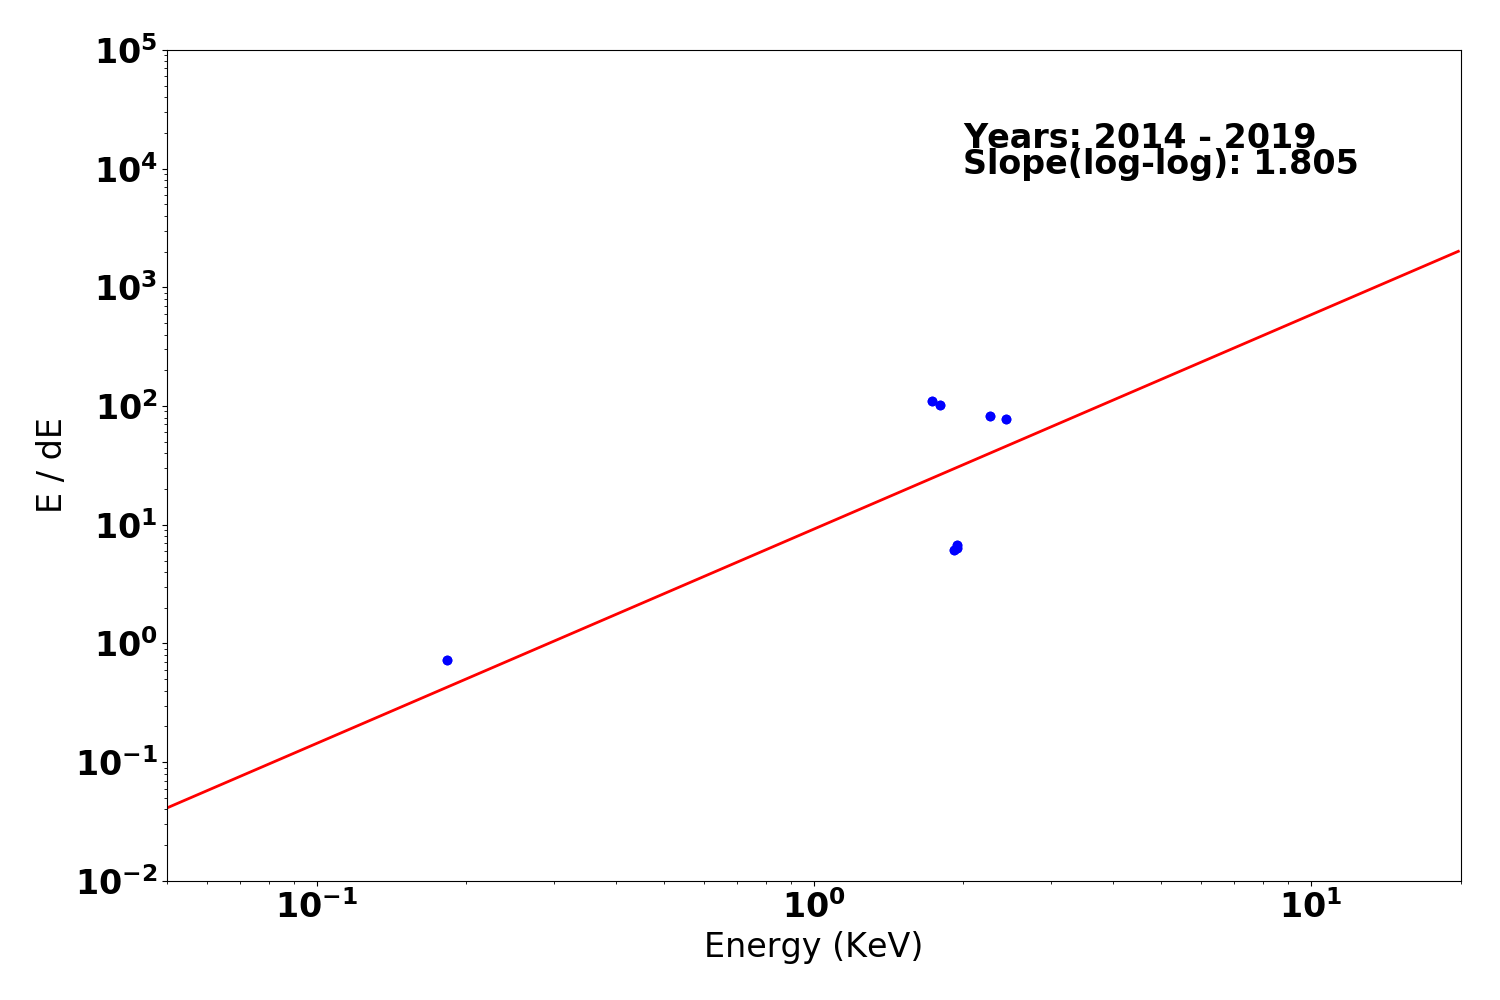
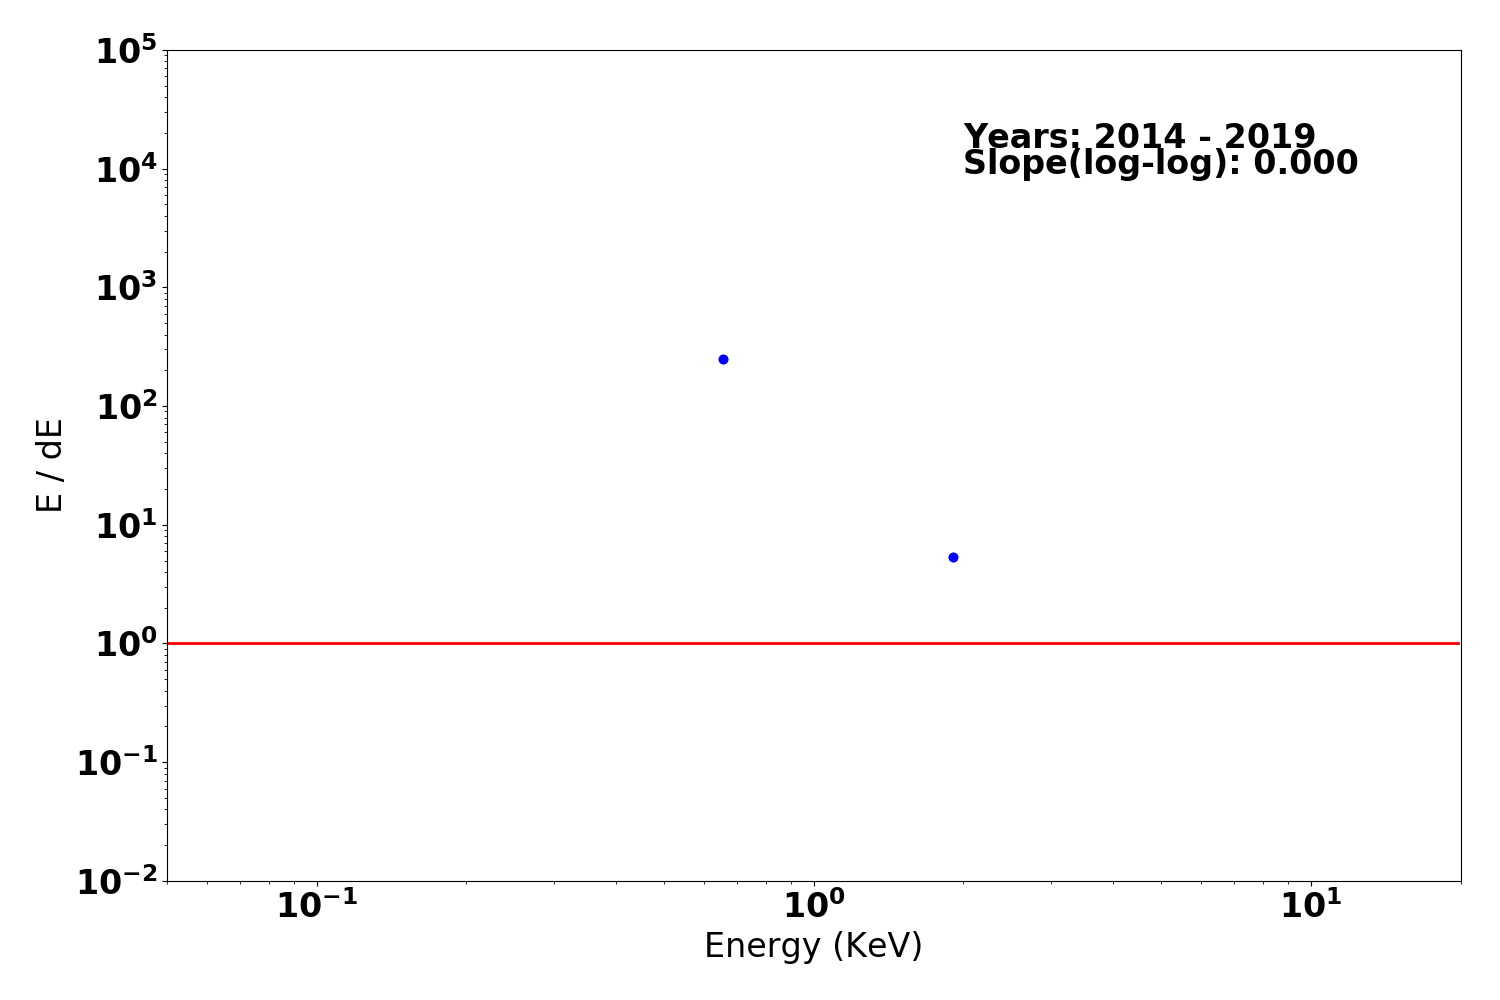
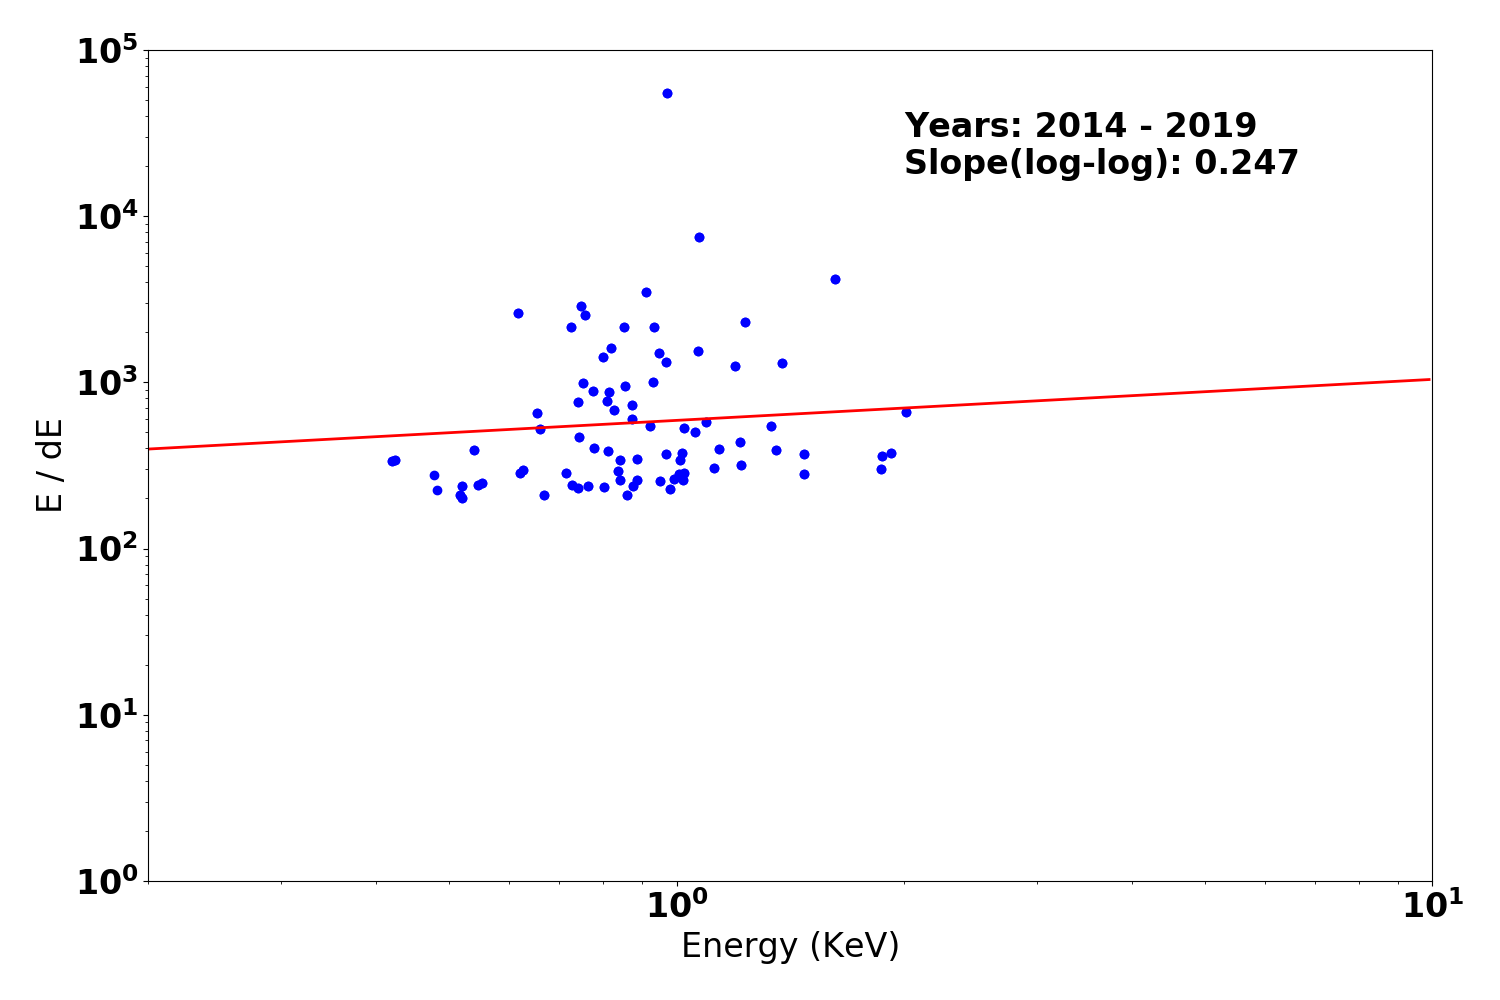
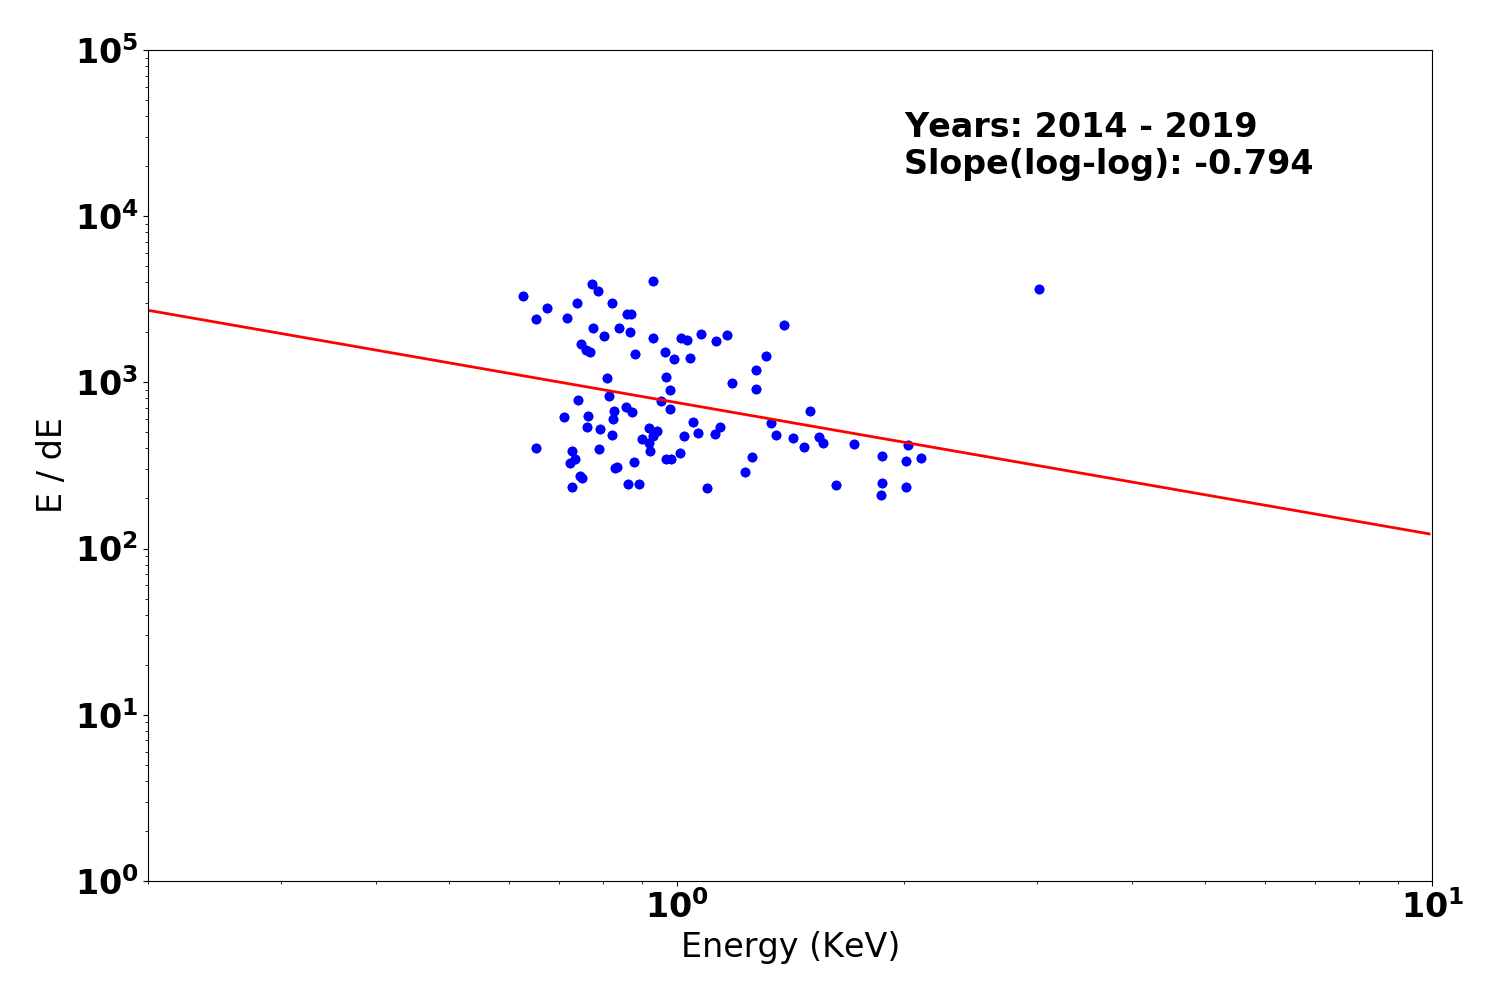
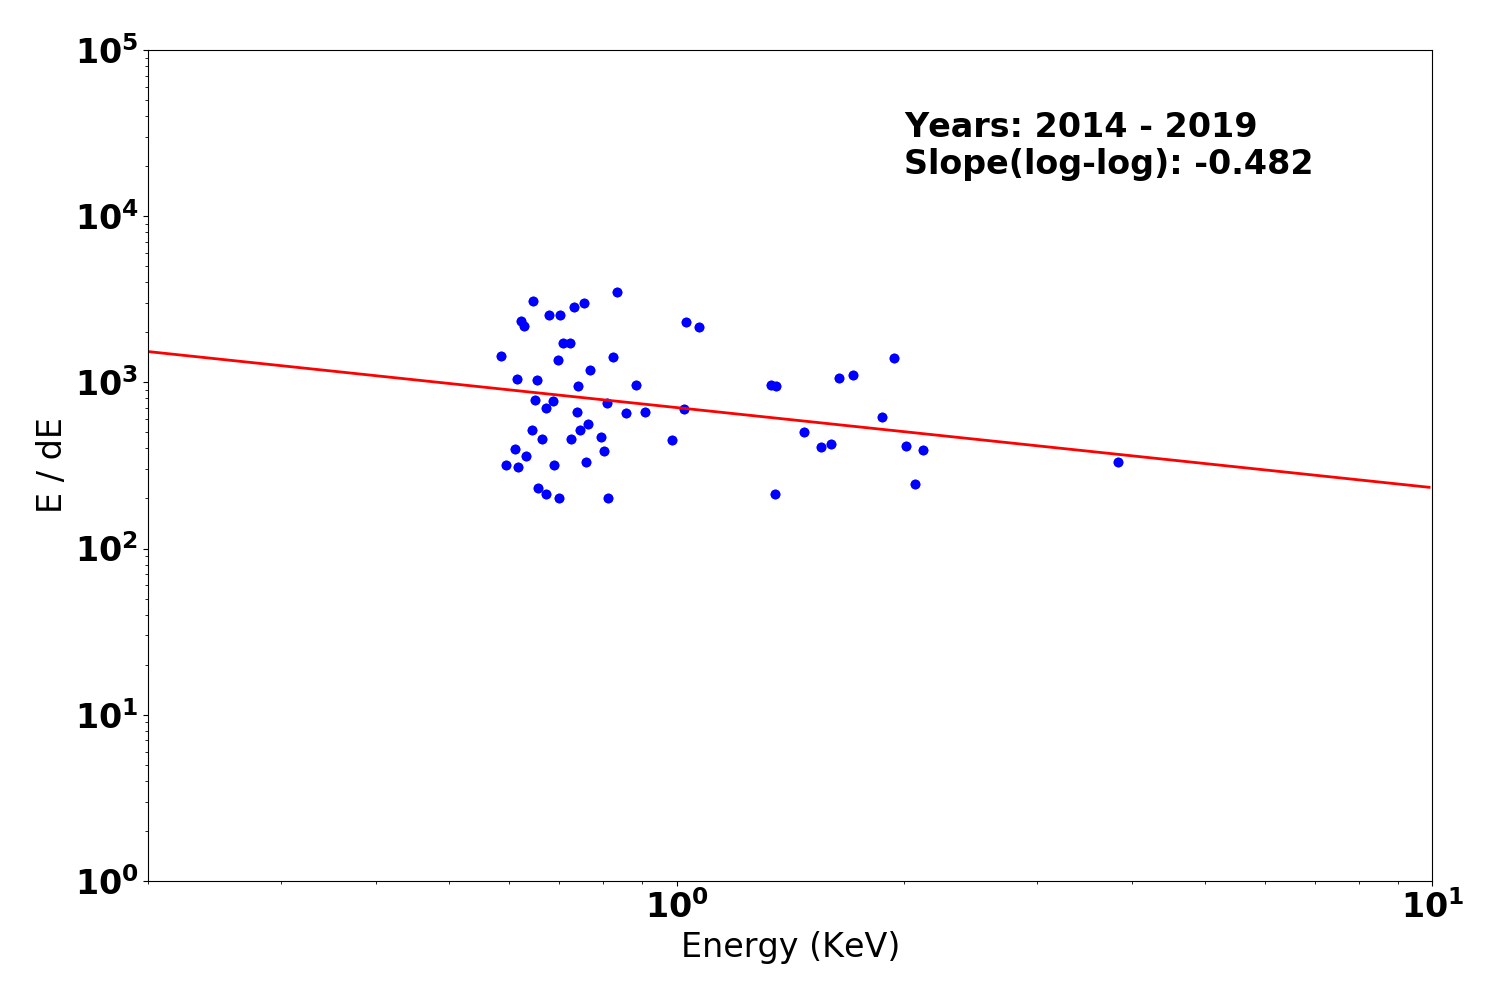
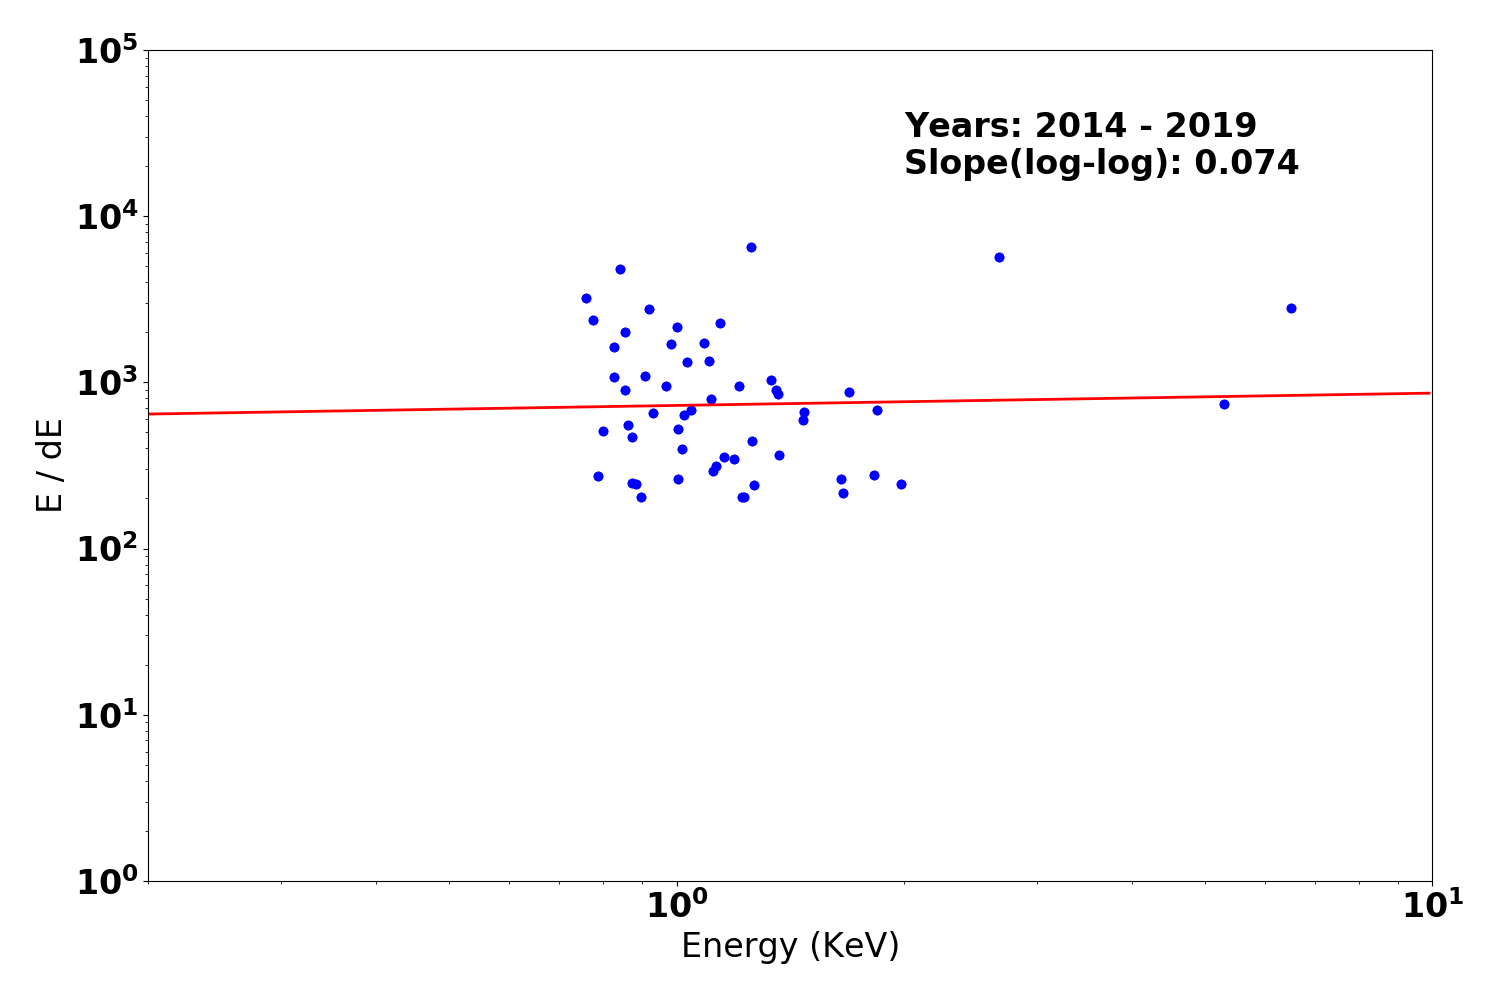
We plot E/dE vs. E for fits to detected lines with fwhm_error/fwhm less than 0.15 for the plus and minus arms of HEG, MEG, and LEG. Also shown are conservative (dotted line) and optimistic (dashed line) pre-launch resolving power expectations.
We have selected only calibration observations of Capella, HR1099, and Sigma Gem. See MIT technotes for a parallel analysis.
| Year 2014 - | |
|---|---|
| Letg minus side | Letg plus side |
 |
 |
| Metg minus side | Metg plus side |
 |
 |
| Hetg minus side | Hetg plus side |
 |
 |
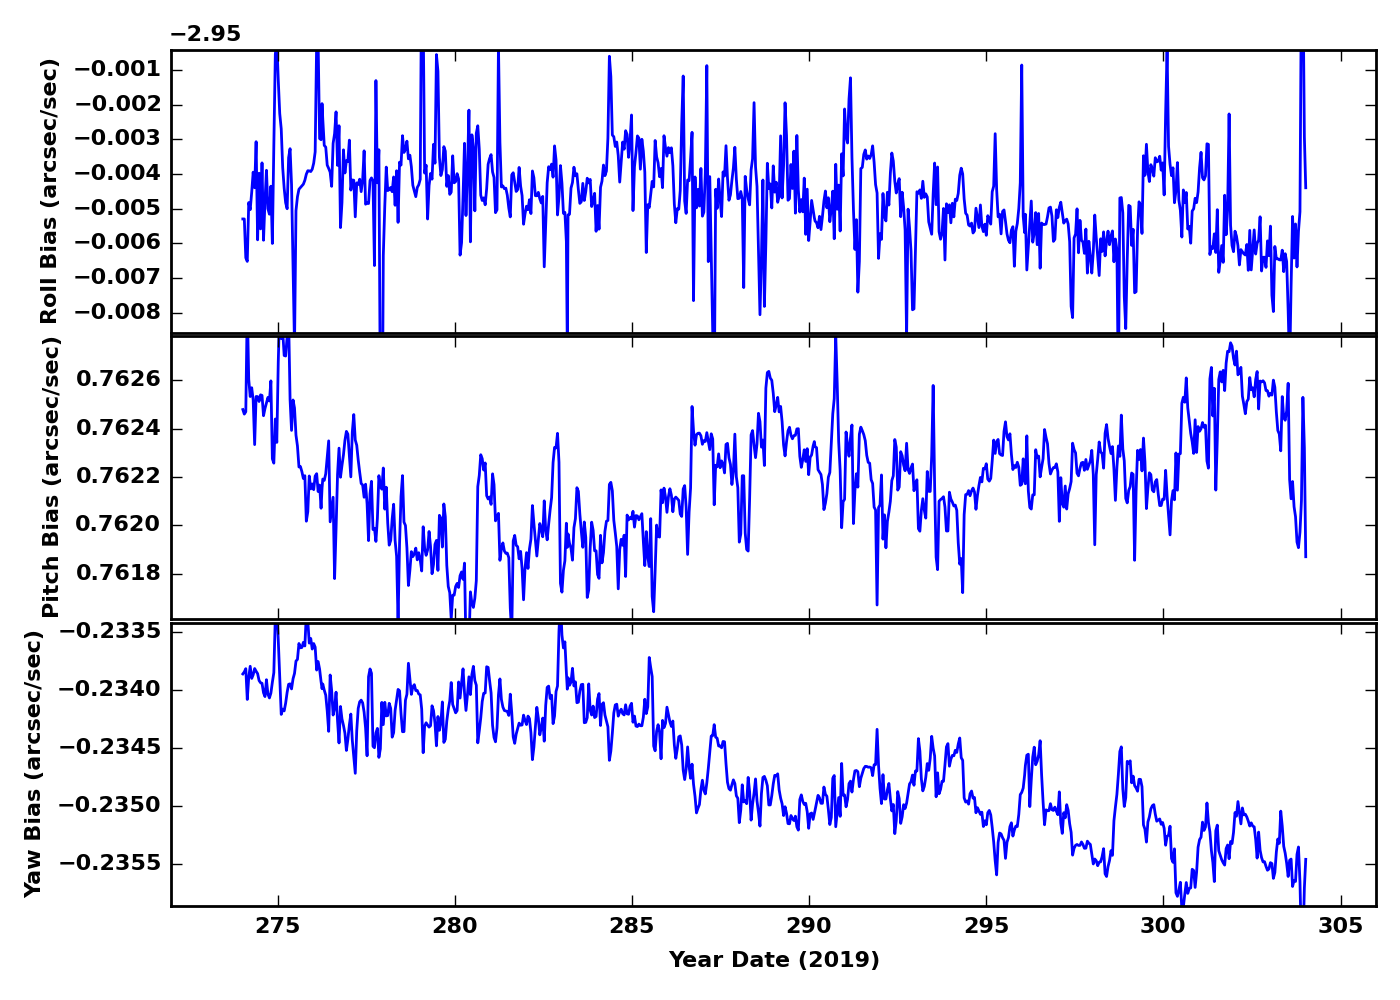
PCAD
ACA Trending
Gyro Bias Drift
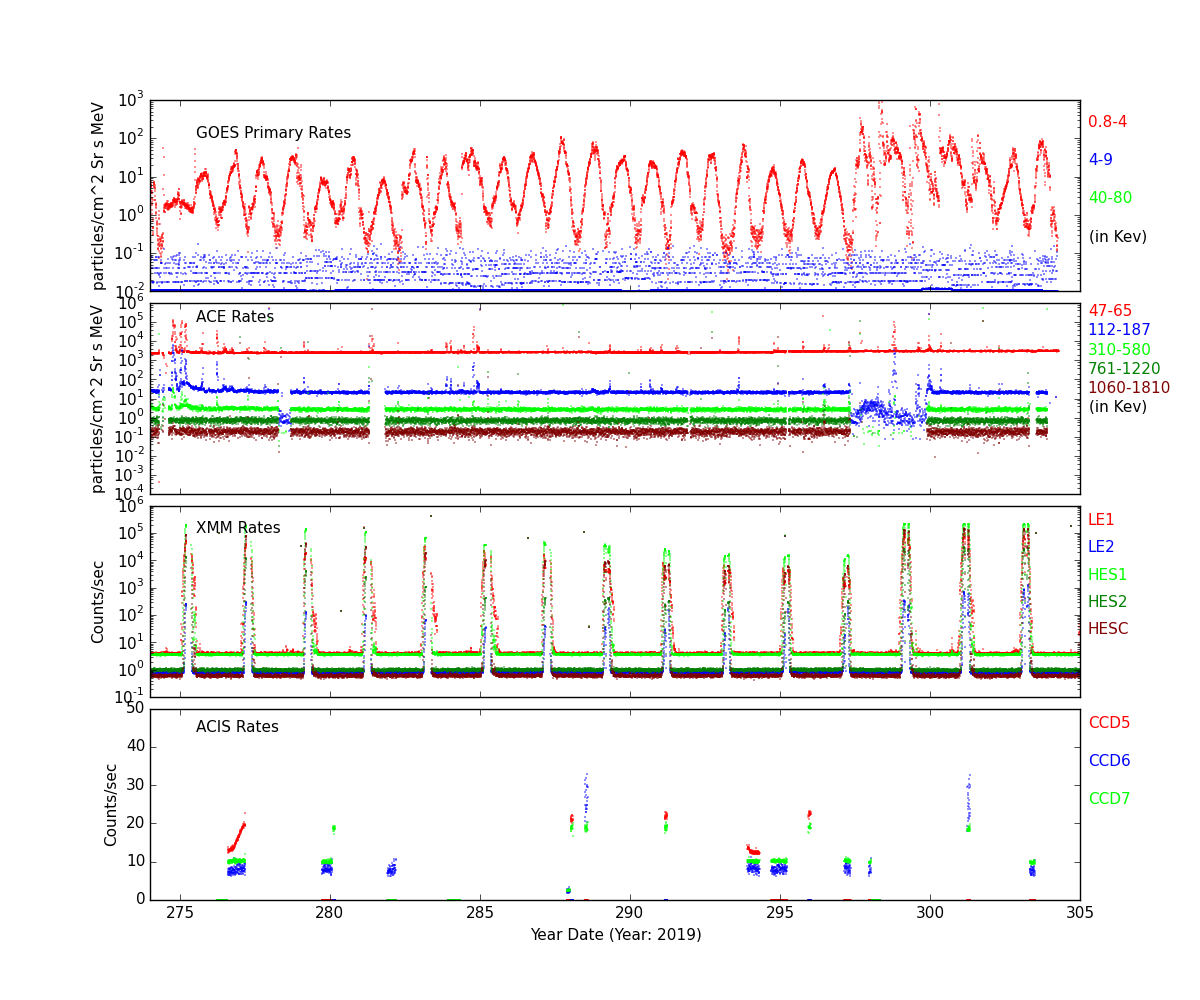
Radiation History
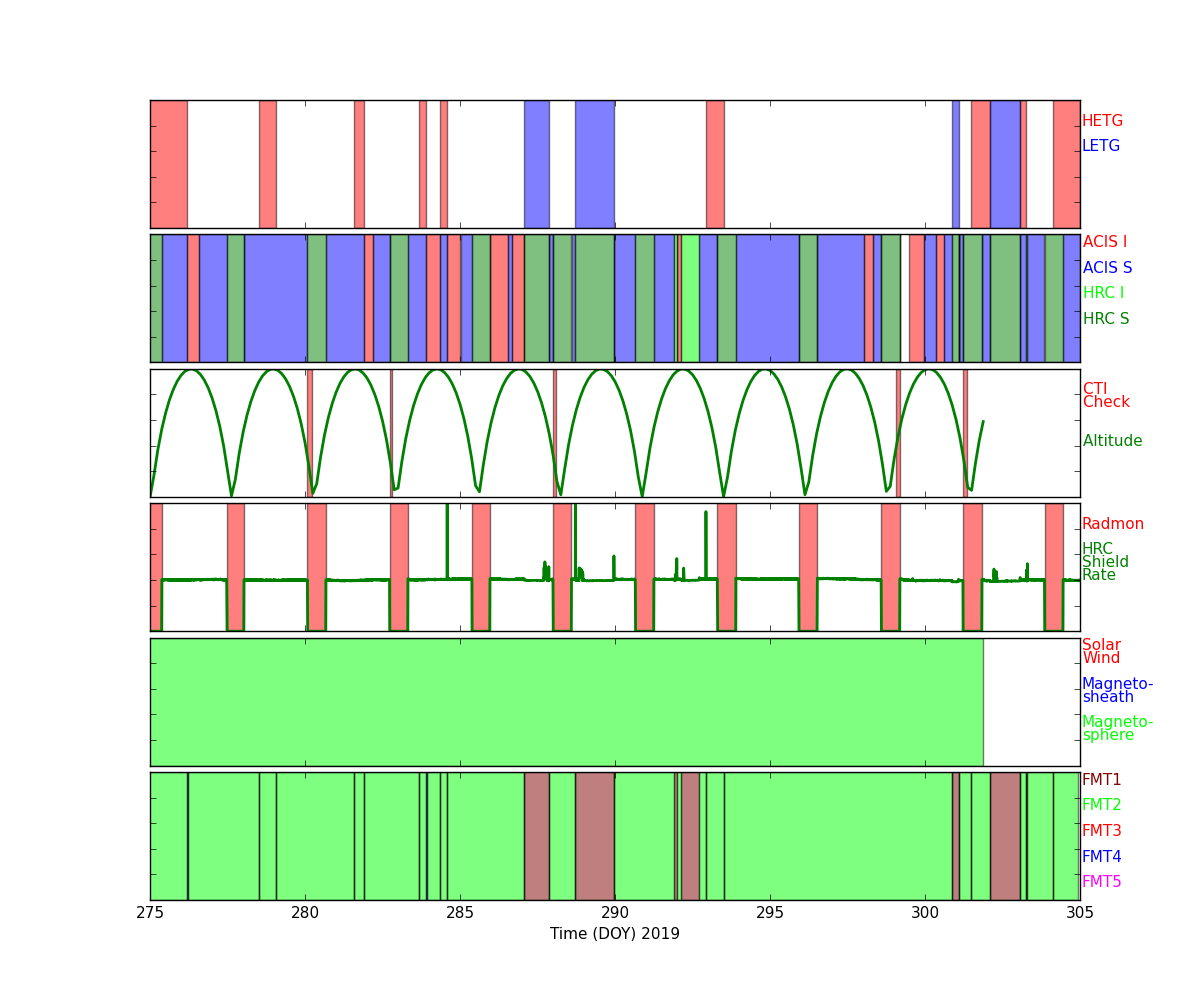
Radiation Count Rates of Oct 2019
Sun Spot History
SIM
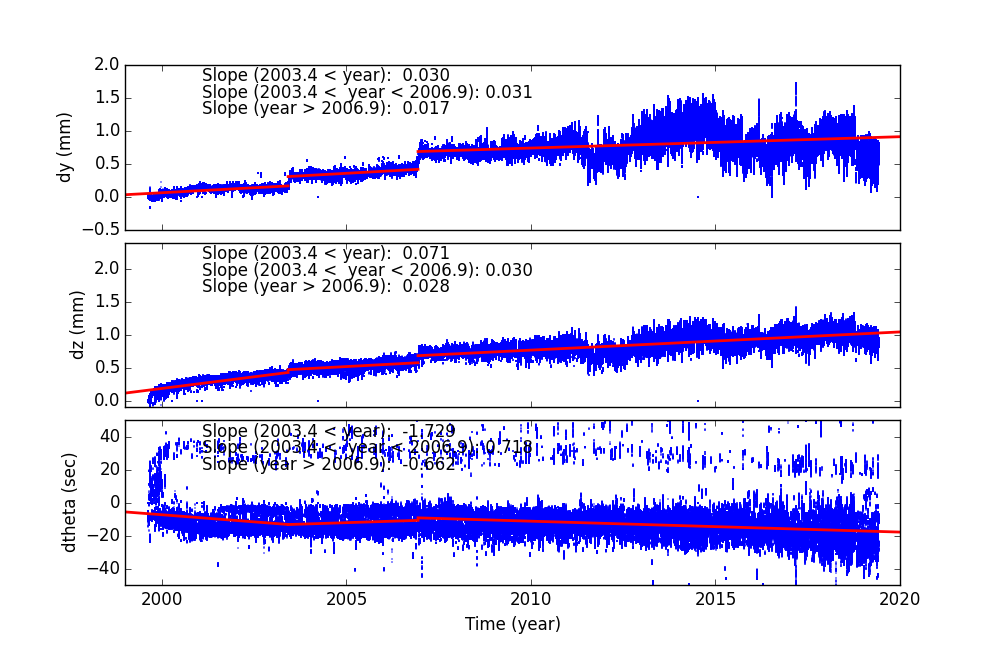
SIM Shift and Twist
SIM Shift and Twist Trend The following plots show trends of SIM shifts (dy and dz) and twist (dtheta). All quantities are directly taken from pcaf*_asol1.fits files. The units are mm for dy and dz, and degree for dtheta. We fit three lines separated before and after (Days of Mission)= 1400 (May 21, 2003), 2700 (Dec 11, 2006), and 4400 (Aug 07, 2011). The unit of slopes are mm per day or degree per day.
The sudden shift around DOM = 1400, 2700 and 4400 are due to fid light drift (see a memo by Aldcroft fiducial light drift). On the dtheta plot, two tracks are clearly observed. The track around 0.01 is due to HRC-I, and all others are clustered around -0.002. For more detail, please see SIM Shift and Twist Trend page
Trending
Quarterly Trends
- EPS Batteries
| Previous Quarter | ||||||
| MSID | MEAN | RMS | DELTA/YR | DELTA/YR/YR | UNITS | DESCRIPTION |
| eb2ci | 0.289 | 0.089 | (-1.28+/-0.32)e-5 | (3.77+/-3.74)e-4 | AMP | BATT 2 CHARGE CURRENT |
|---|---|---|---|---|---|---|
| eb2di | 0.020 | 0.164 | (-1.90+/-0.00)e-7 | (-8.54+/-9.58)e-12 | AMP | BATT 2 DISCHARGE CURRENT |
| eb2v | 32.319 | 0.083 | (-1.70+/-80.92)e-7 | 0.001+/-0.001 | V | BATT 2 VOLTAGE |
| ecnv1v | 14.894 | 0.006 | (2.06+/-1.05)e-6 | (-8.89+/-30.00)e-5 | V | CONV 1 +15V OUTPUT |
| ecnv2v | 14.845 | 0.012 | (5.47+/-4.36)e-6 | -0.002+/-0.002 | V | CONV 2 +15V OUTPUT |
| ecnv3v | 15.294 | 0.003 | (-4.94+/-1.08)e-6 | (3.80+/-1.39)e-4 | V | CONV 3 +15V OUTPUT |
- Spacecraft Electronics
| Previous Quarter | ||||||
| MSID | MEAN | RMS | DELTA/YR | DELTA/YR/YR | UNITS | DESCRIPTION |
| elbi | 55.030 | 1.385 | 0.001+/-0.000 | -0.072+/-0.094 | AMP | LOAD BUS CURRENT |
|---|---|---|---|---|---|---|
| elbv | 28.625 | 0.212 | 0.001+/-0.000 | -0.022+/-0.007 | V | LOAD BUS VOLTAGE |
- OBA Heater
| Previous Quarter | ||||||
| MSID | MEAN | RMS | DELTA/YR | DELTA/YR/YR | UNITS | DESCRIPTION |
| oobthr04 | 299.594 | 0.886 | (-1.53+/-3.24)e-4 | 0.287+/-0.152 | K | RT 27: HRMA STRUT |
|---|---|---|---|---|---|---|
| oobthr12 | 298.464 | 1.679 | (-1.32+/-6.16)e-4 | 0.424+/-0.212 | K | RT 35: OBA FWD CONE |
| oobthr26 | 301.119 | 3.341 | 0.002+/-0.001 | 0.673+/-0.309 | K | RT 48: OBA AFT CONE |
| oobthr38 | 283.192 | 0.011 | (1.80+/-0.40)e-5 | 0.002+/-0.001 | K | RT 60: TFTE FWD CYLINDER |
| oobthr44 | 300.073 | 1.502 | 0.001+/-0.001 | 0.317+/-0.208 | K | RT 66: TFTE AFT CYLINDER |
| oobthr50 | 294.709 | 1.406 | (3.69+/-5.12)e-4 | 0.602+/-0.185 | K | RT 76: S/C STRUT |
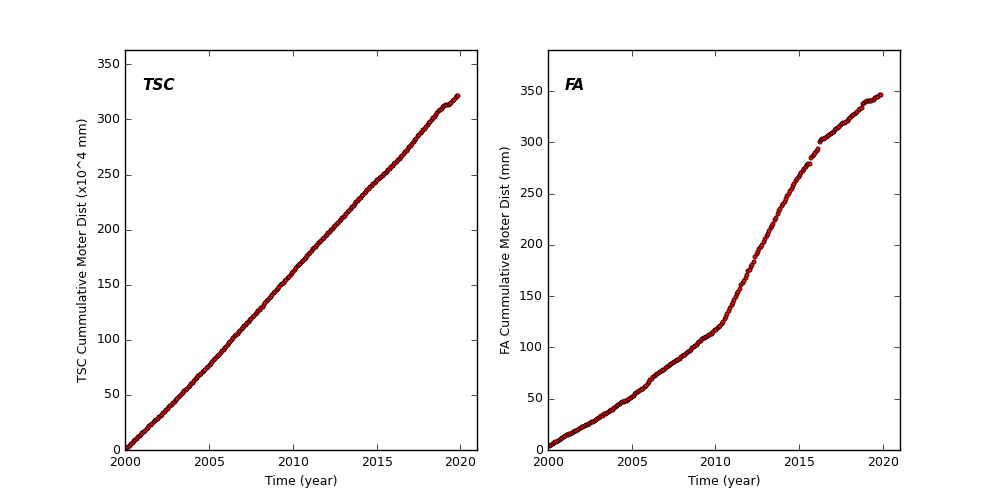
Spacecraft Motions
TSC and FA Cummulative Moter Distance
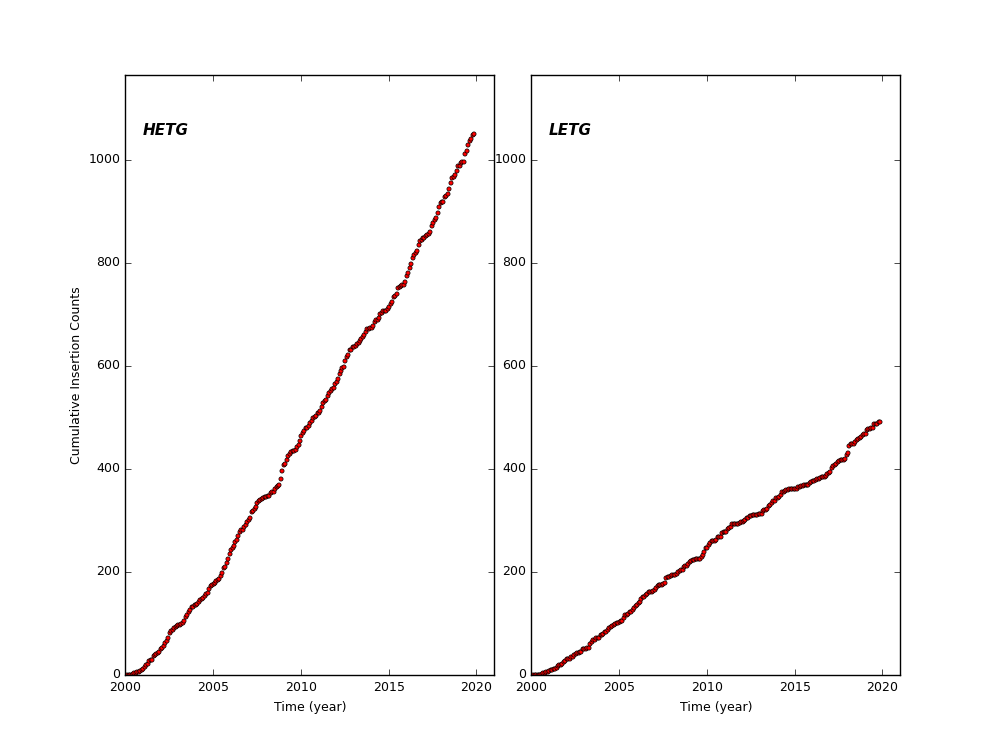
HETG and LETG Cummulative Insertion Counts
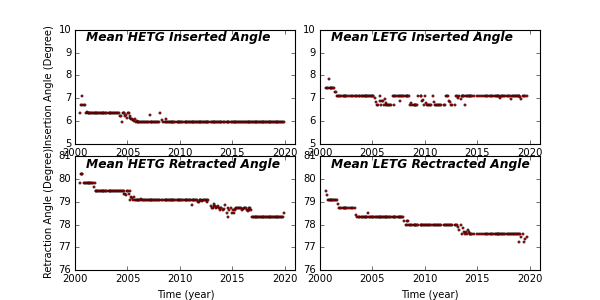
HETG/LETG Insertion/Retraction Angle
Reaction Wheel Rotations