ACIS
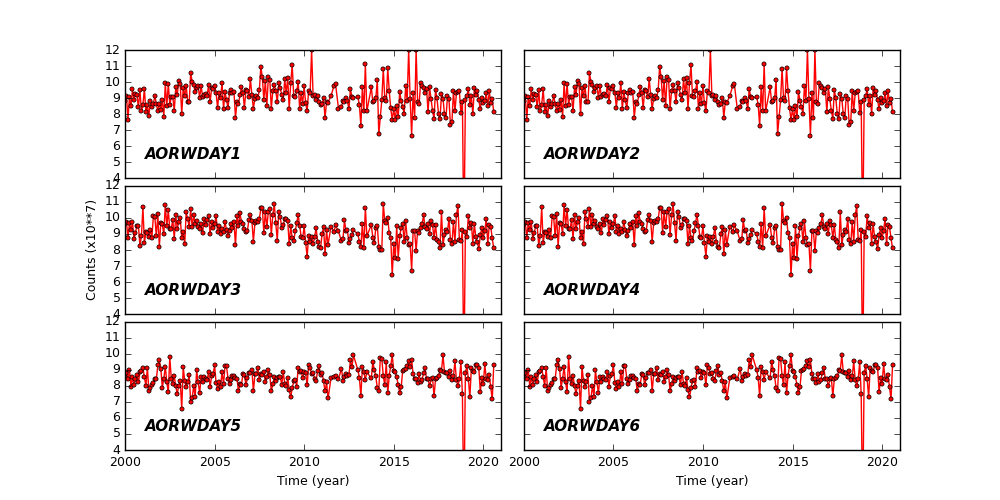
ACIS DOSE Registered-Photon-Map
The steps we took to compute the dose map are;
- Level 1 Event files for a specified month are obtained from archive.
- Image data including I2, I3, S2, S3 CCDs are extracted from all event files.
- All the extracted image data were merged to create a month long exposure map for the month.
- The exposure map is opened with ds9, and check a distribution of count rates against energy. From this, estimate the upper threshold value. Any events beyond this upper threshold are assumed erroneous events such as bad pixels.
- Using this upper threshold, the data is filtered, and create a cleaned exposure map for the month.
- The exposure map from each month from the Sep 1999 is added up to create a cumulative exposure map for each month.
- Using fimgstatistic, we compute count rate statistics for each CCDs.
- For observations with high data drop rates (e.g., Crab nebula, Cas A), we corrected the observations by adding events.
Please check more detail plots at Telemetered Photon Dose Trend page.
)
)
)
Statistics:
# IMAGE     NPIX     MEAN        RMS        MIN     MAX
ACIS_dec20 6004901       8.462         21.733           0.0     3771


I2 node 0  262654	5.864267	4.047888	0.0	1433.0
I2 node 1  262654	6.248474	3.686135	0.0	968.0
I2 node 2  262654	6.035485	2.949390	0.0	 90.0
I2 node 3  262654	5.913487	3.153132	0.0	292.0

I3 node 0  262654	7.510220	3.571716	0.0	133.0
I3 node 1  262654	7.178633	5.453128	0.0	1753.0
I3 node 2  262654	6.939731	3.187510	0.0	 82.0
I3 node 3  262654	7.040725	4.539514	0.0	1276.0

S2 node 0  262654	11.299839	10.366189	0.0	3683.0
S2 node 1  262654	11.947845	8.128702	0.0	534.0
S2 node 2  262654	13.333310	15.172267	0.0	3446.0
S2 node 3  262654	13.926877	17.564550	0.0	739.0

S3 node 0  262654	20.687948	84.542705	0.0	3771.0
S3 node 1  262654	18.357598	13.155195	0.0	435.0
S3 node 2  262654	18.724008	16.395125	1.0	266.0
S3 node 3  262654	16.533948	13.200588	1.0	245.0
)
)
)
Statistics:
 IMAGE     NPIX      MEAN        RMS           MIN      MAX
ACIS_total   6004901       2452.869         3153.243           0.0   136615


I2 node 0  262654	2119.616121	424.195109	450.0	12487.0
I2 node 1  262654	2229.301968	599.162302	465.0	113662.0
I2 node 2  262654	2256.185084	477.041528	478.0	12940.0
I2 node 3  262654	2261.439750	583.414340	452.0	28727.0

I3 node 0  262654	2424.049968	596.255177	449.0	12349.0
I3 node 1  262654	2501.933915	1714.030722	485.0	55556.0
I3 node 2  262654	2221.675481	414.860494	451.0	13010.0
I3 node 3  262654	2214.251793	446.432570	417.0	33700.0

S2 node 0  262654	2863.038607	457.278078	1571.0	22168.0
S2 node 1  262654	3034.936543	681.799160	1750.0	16552.0
S2 node 2  262654	3357.046009	678.425470	2172.0	28214.0
S2 node 3  262654	3322.329142	533.567182	1919.0	66765.0

S3 node 0  262654	5070.792793	2451.101973	2214.0	37029.0
S3 node 1  262654	6293.732061	2324.252523	0.0	36168.0
S3 node 2  262654	5029.667521	1291.940872	2241.0	26156.0
S3 node 3  262654	3907.909279	688.831218	2384.0	25524.0
)
|
)
|
)
|
)
|
| Sep 2020 | Jun 2020 | Mar 2020 | Dec 2019 |
|---|
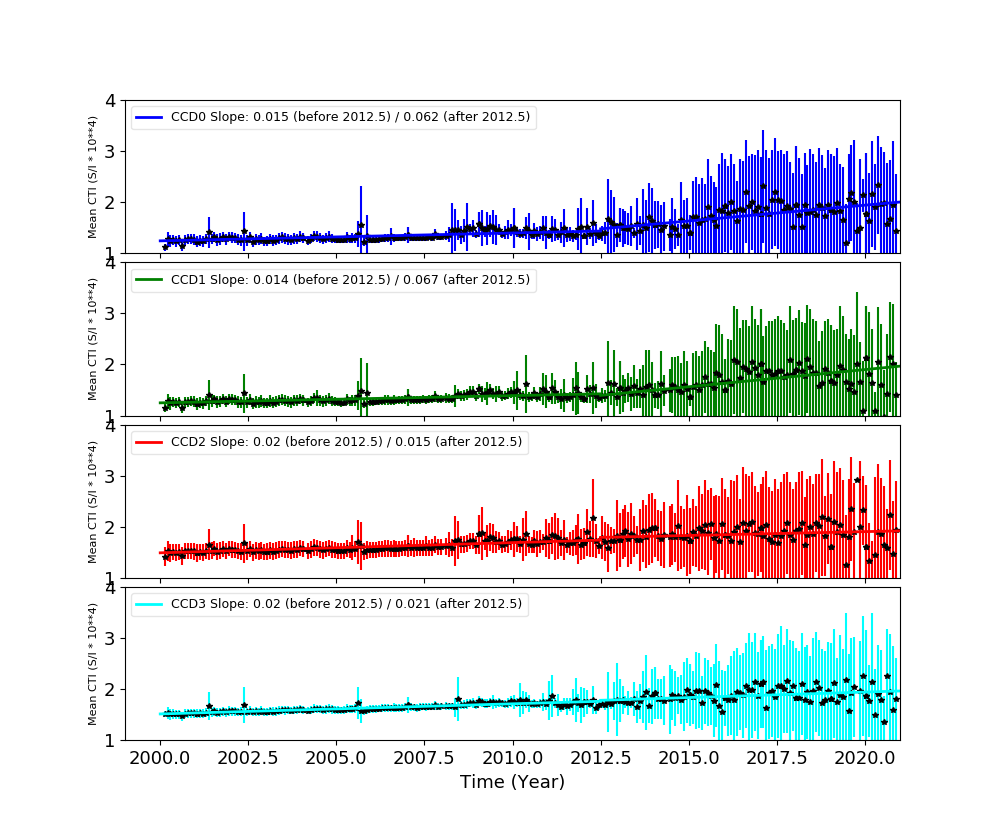
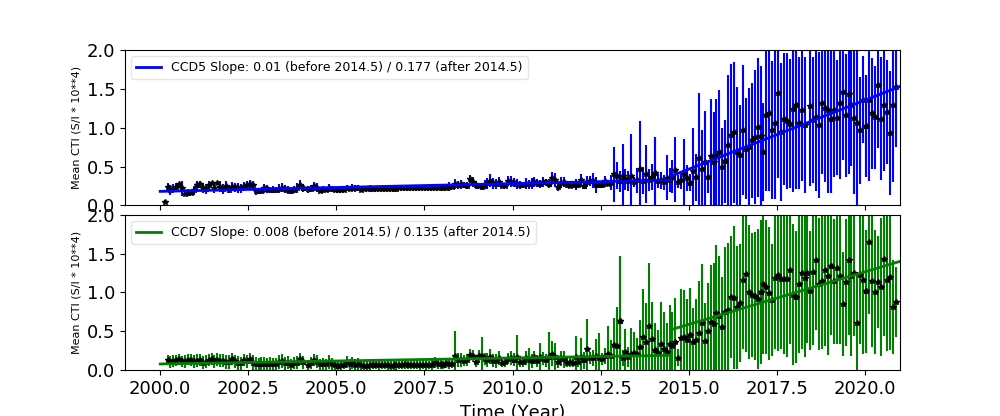
The Mean Detrended CTI
We report CTIs with a refined data definition. CTIs were computed for the temperature dependency corrected data. Please see CTI page for detailed explanation. CTI's are computed for Mn K alpha, and defined as slope/intercept x10^4 of row # vs ADU. Data file: here
Imaging CCDs
Spectral CCDs
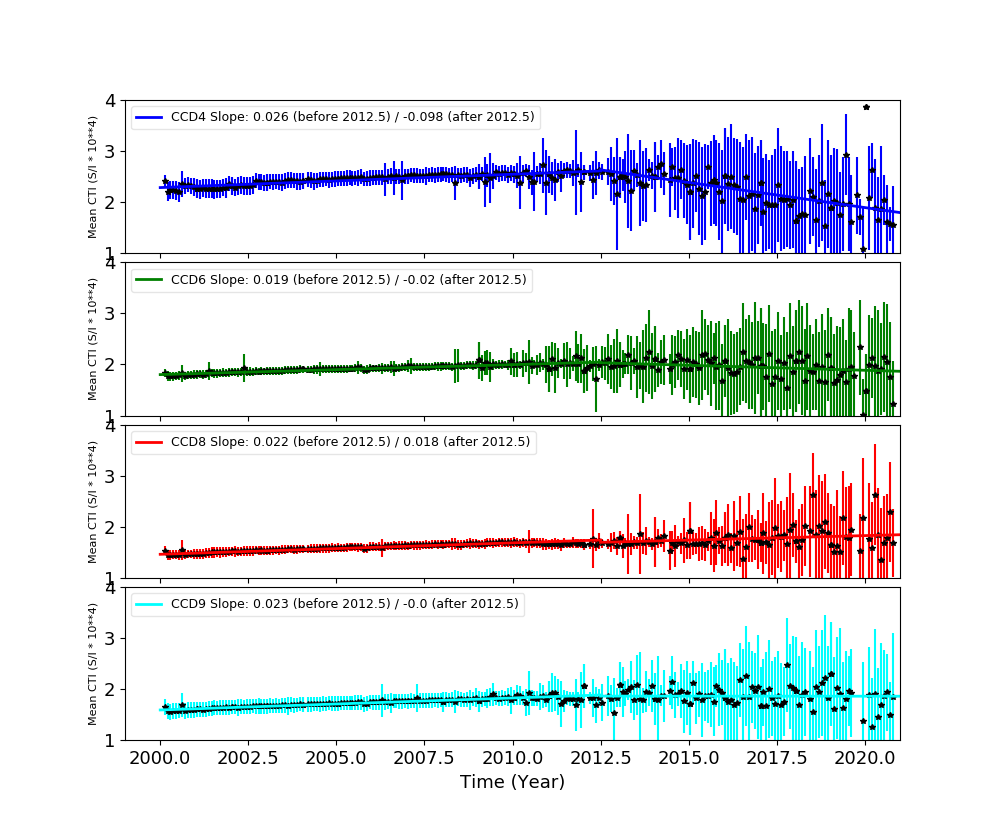
Backside CCDs
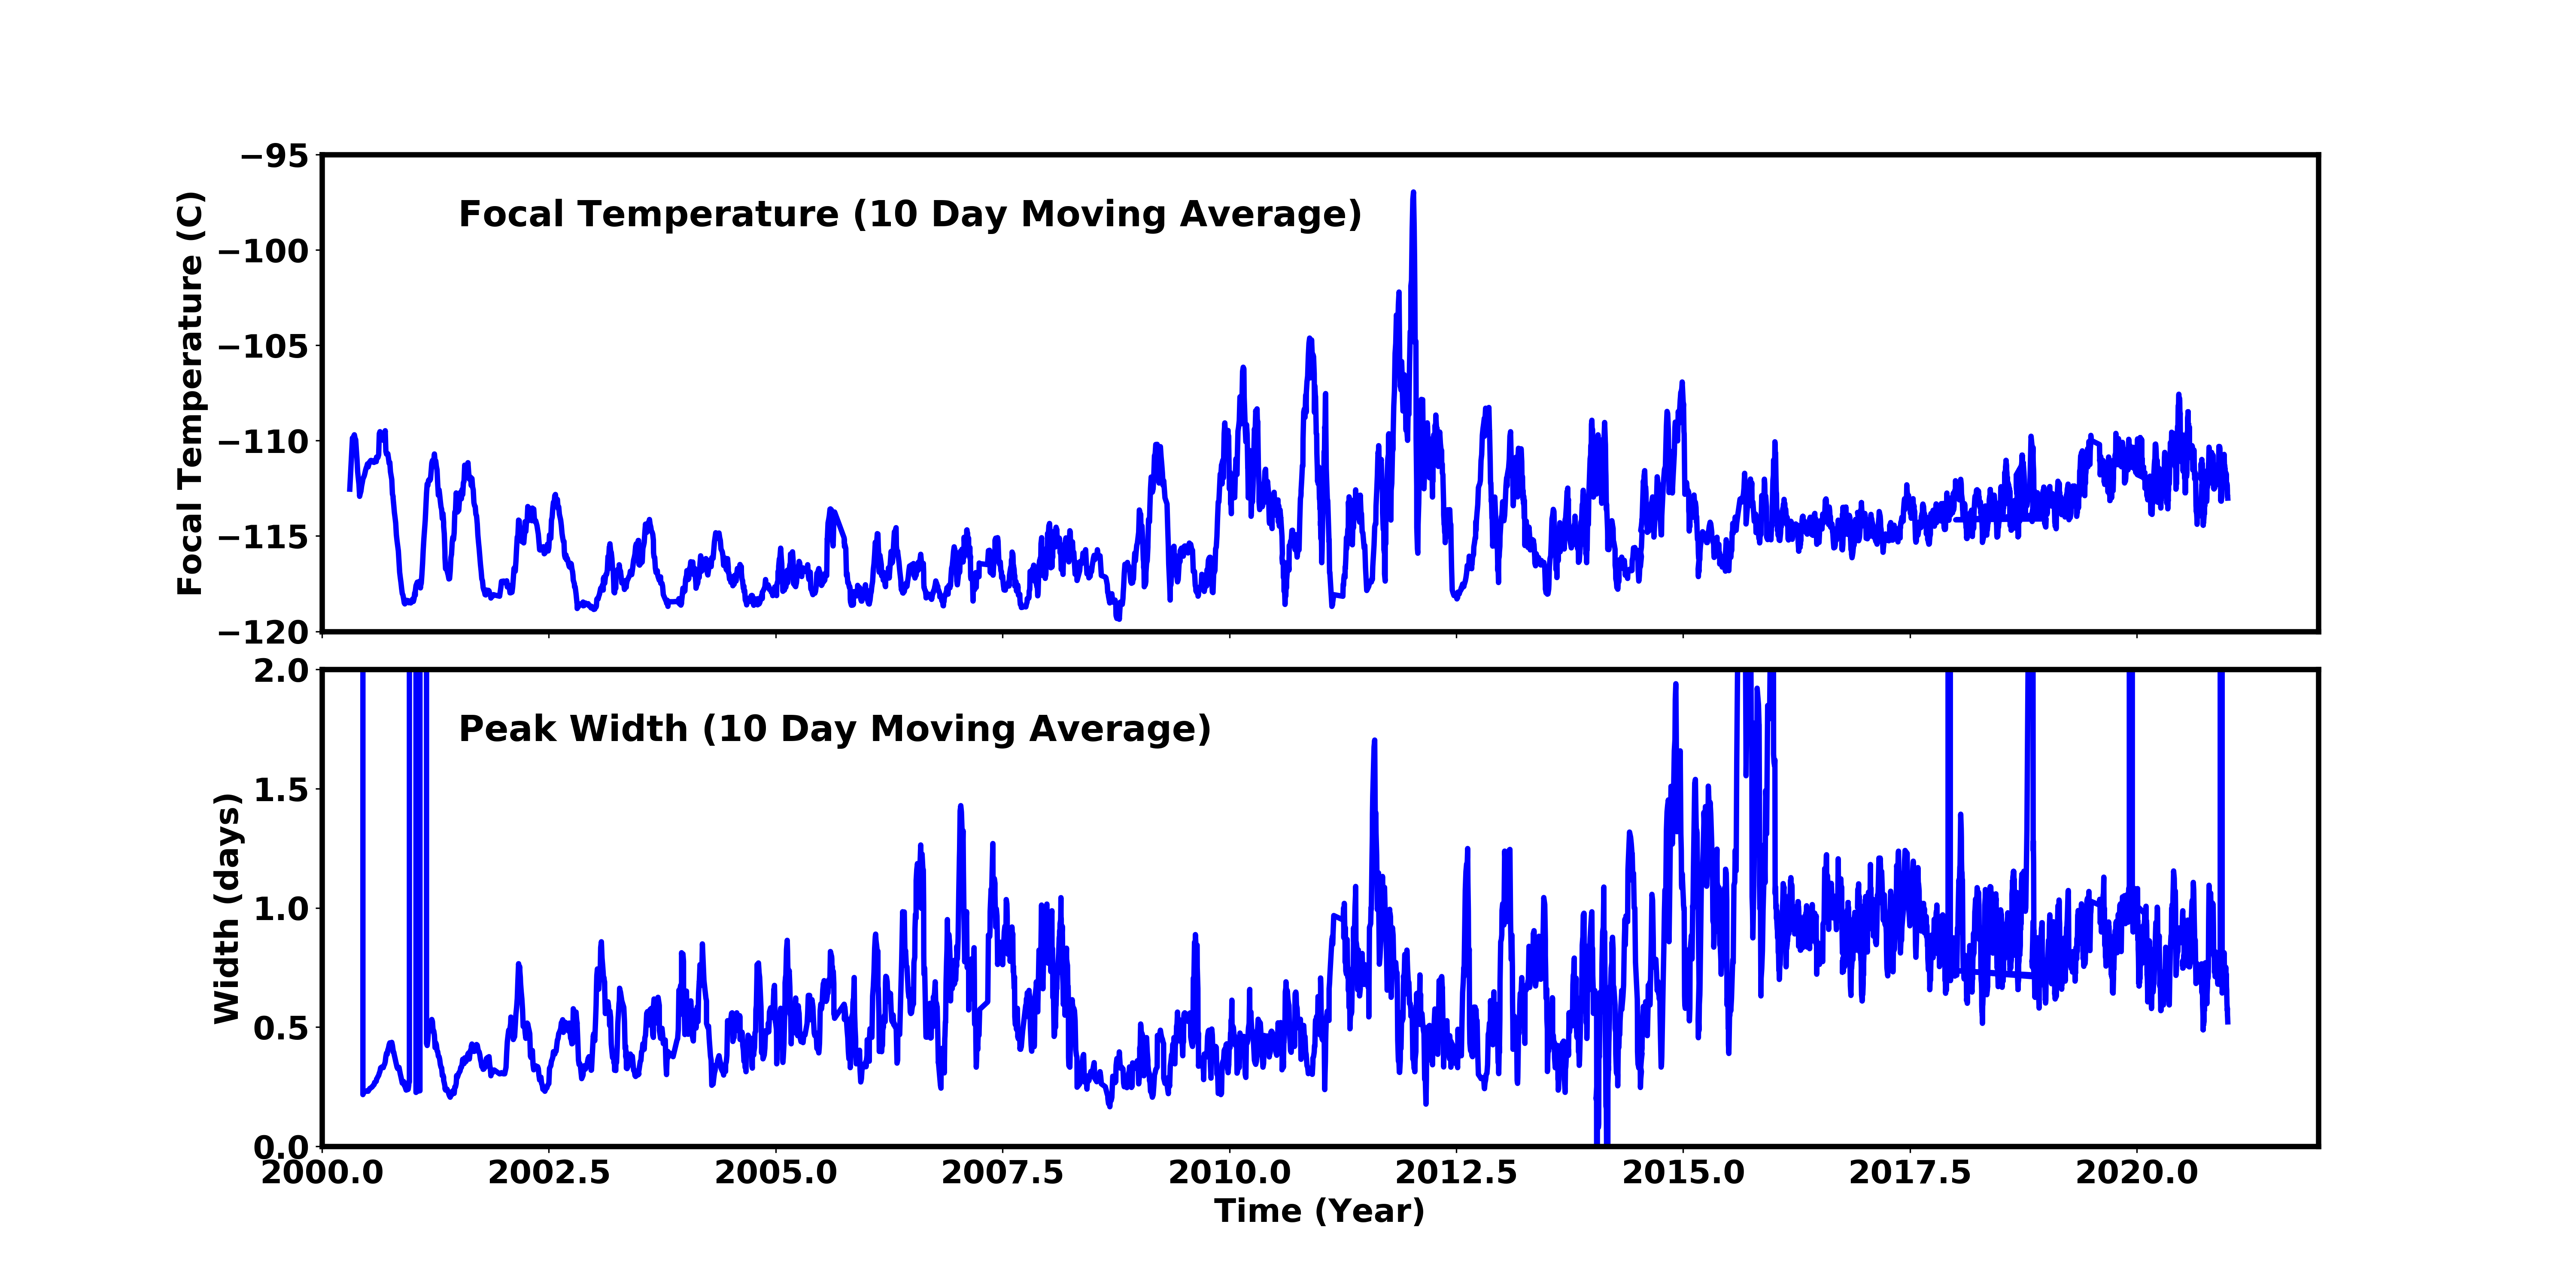
Focal Plane Temperature
Dec 2020 Focal Temperature
| The Mean (max) FPT: | |
|---|---|
| -112.14 | +/- 2.16 C |
| Mean Width: | |
| 8.46 | +/- 50.58 days |
Averaged Focal Plane Temperature
We are using 10 period moving averages to show trends of peak temperatures and peak widths. Note, the gaps in the width plot are due to missing/corrupted data.
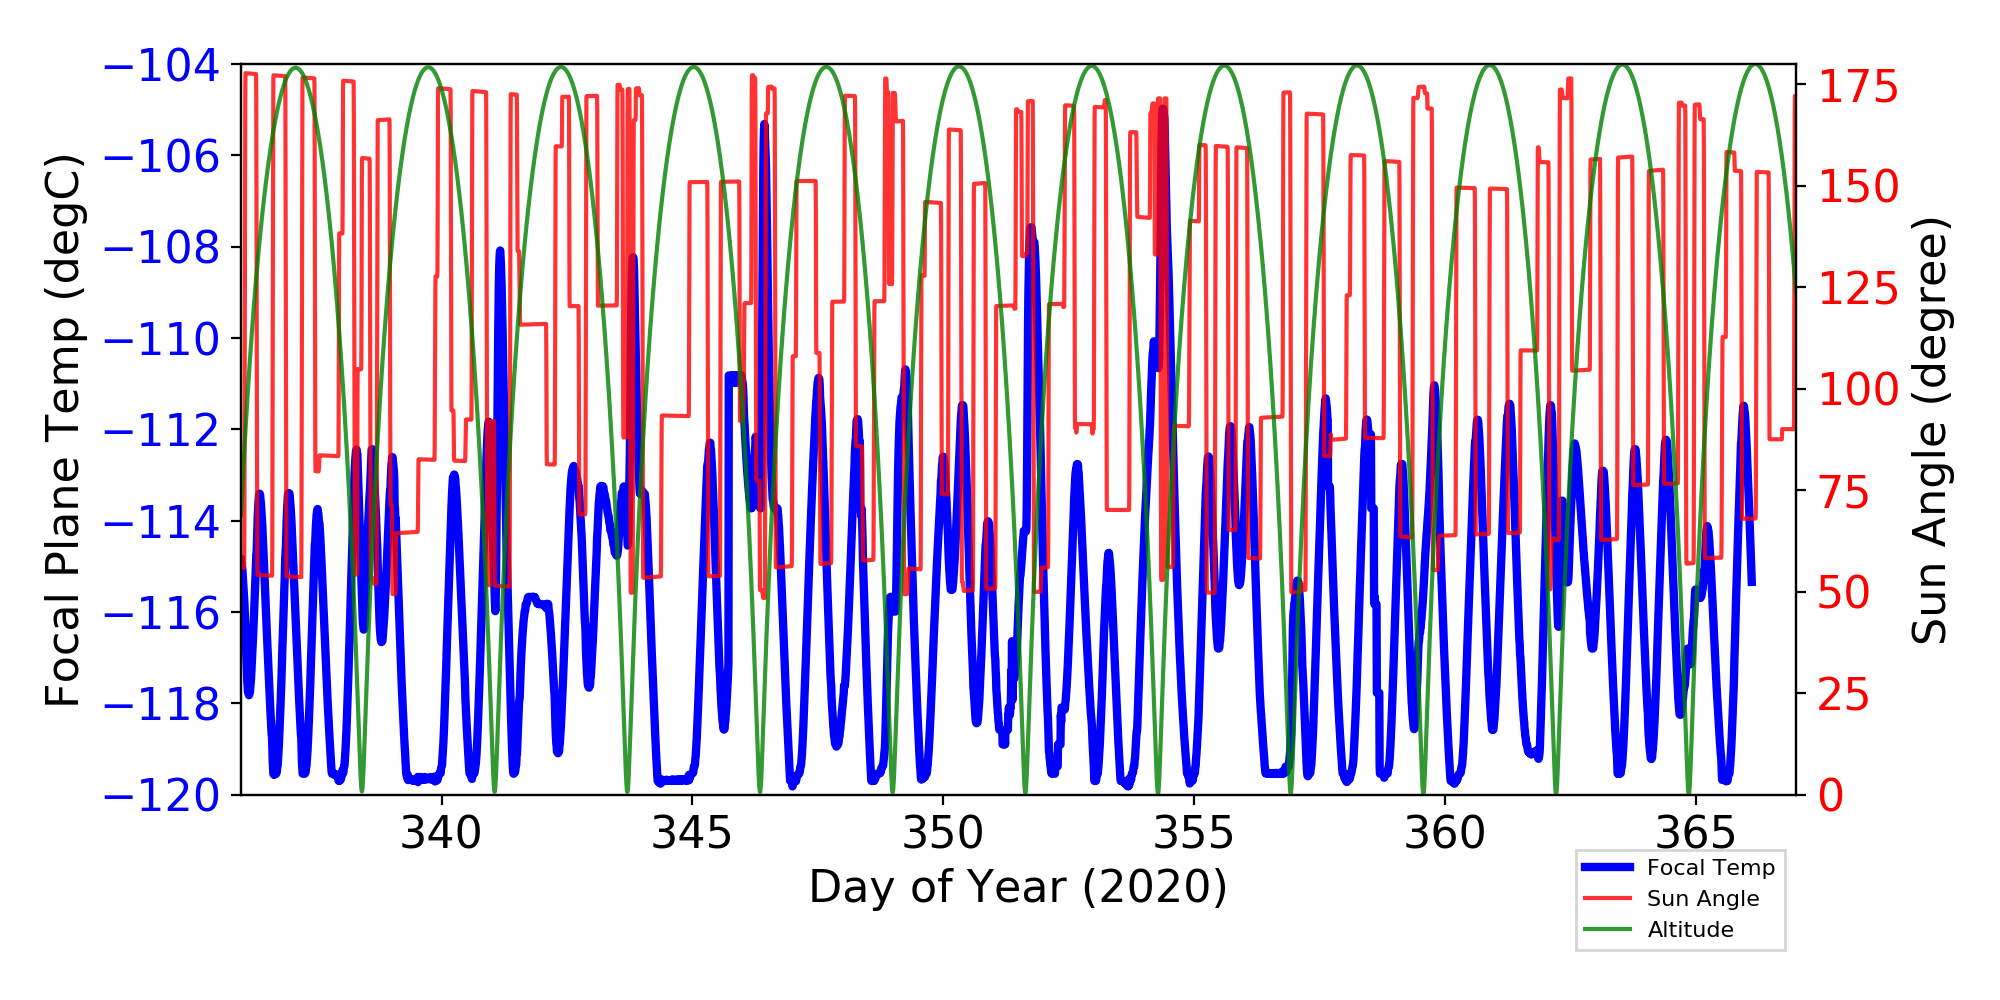
Focal Plane Temperature, Sun Angle and Altitude
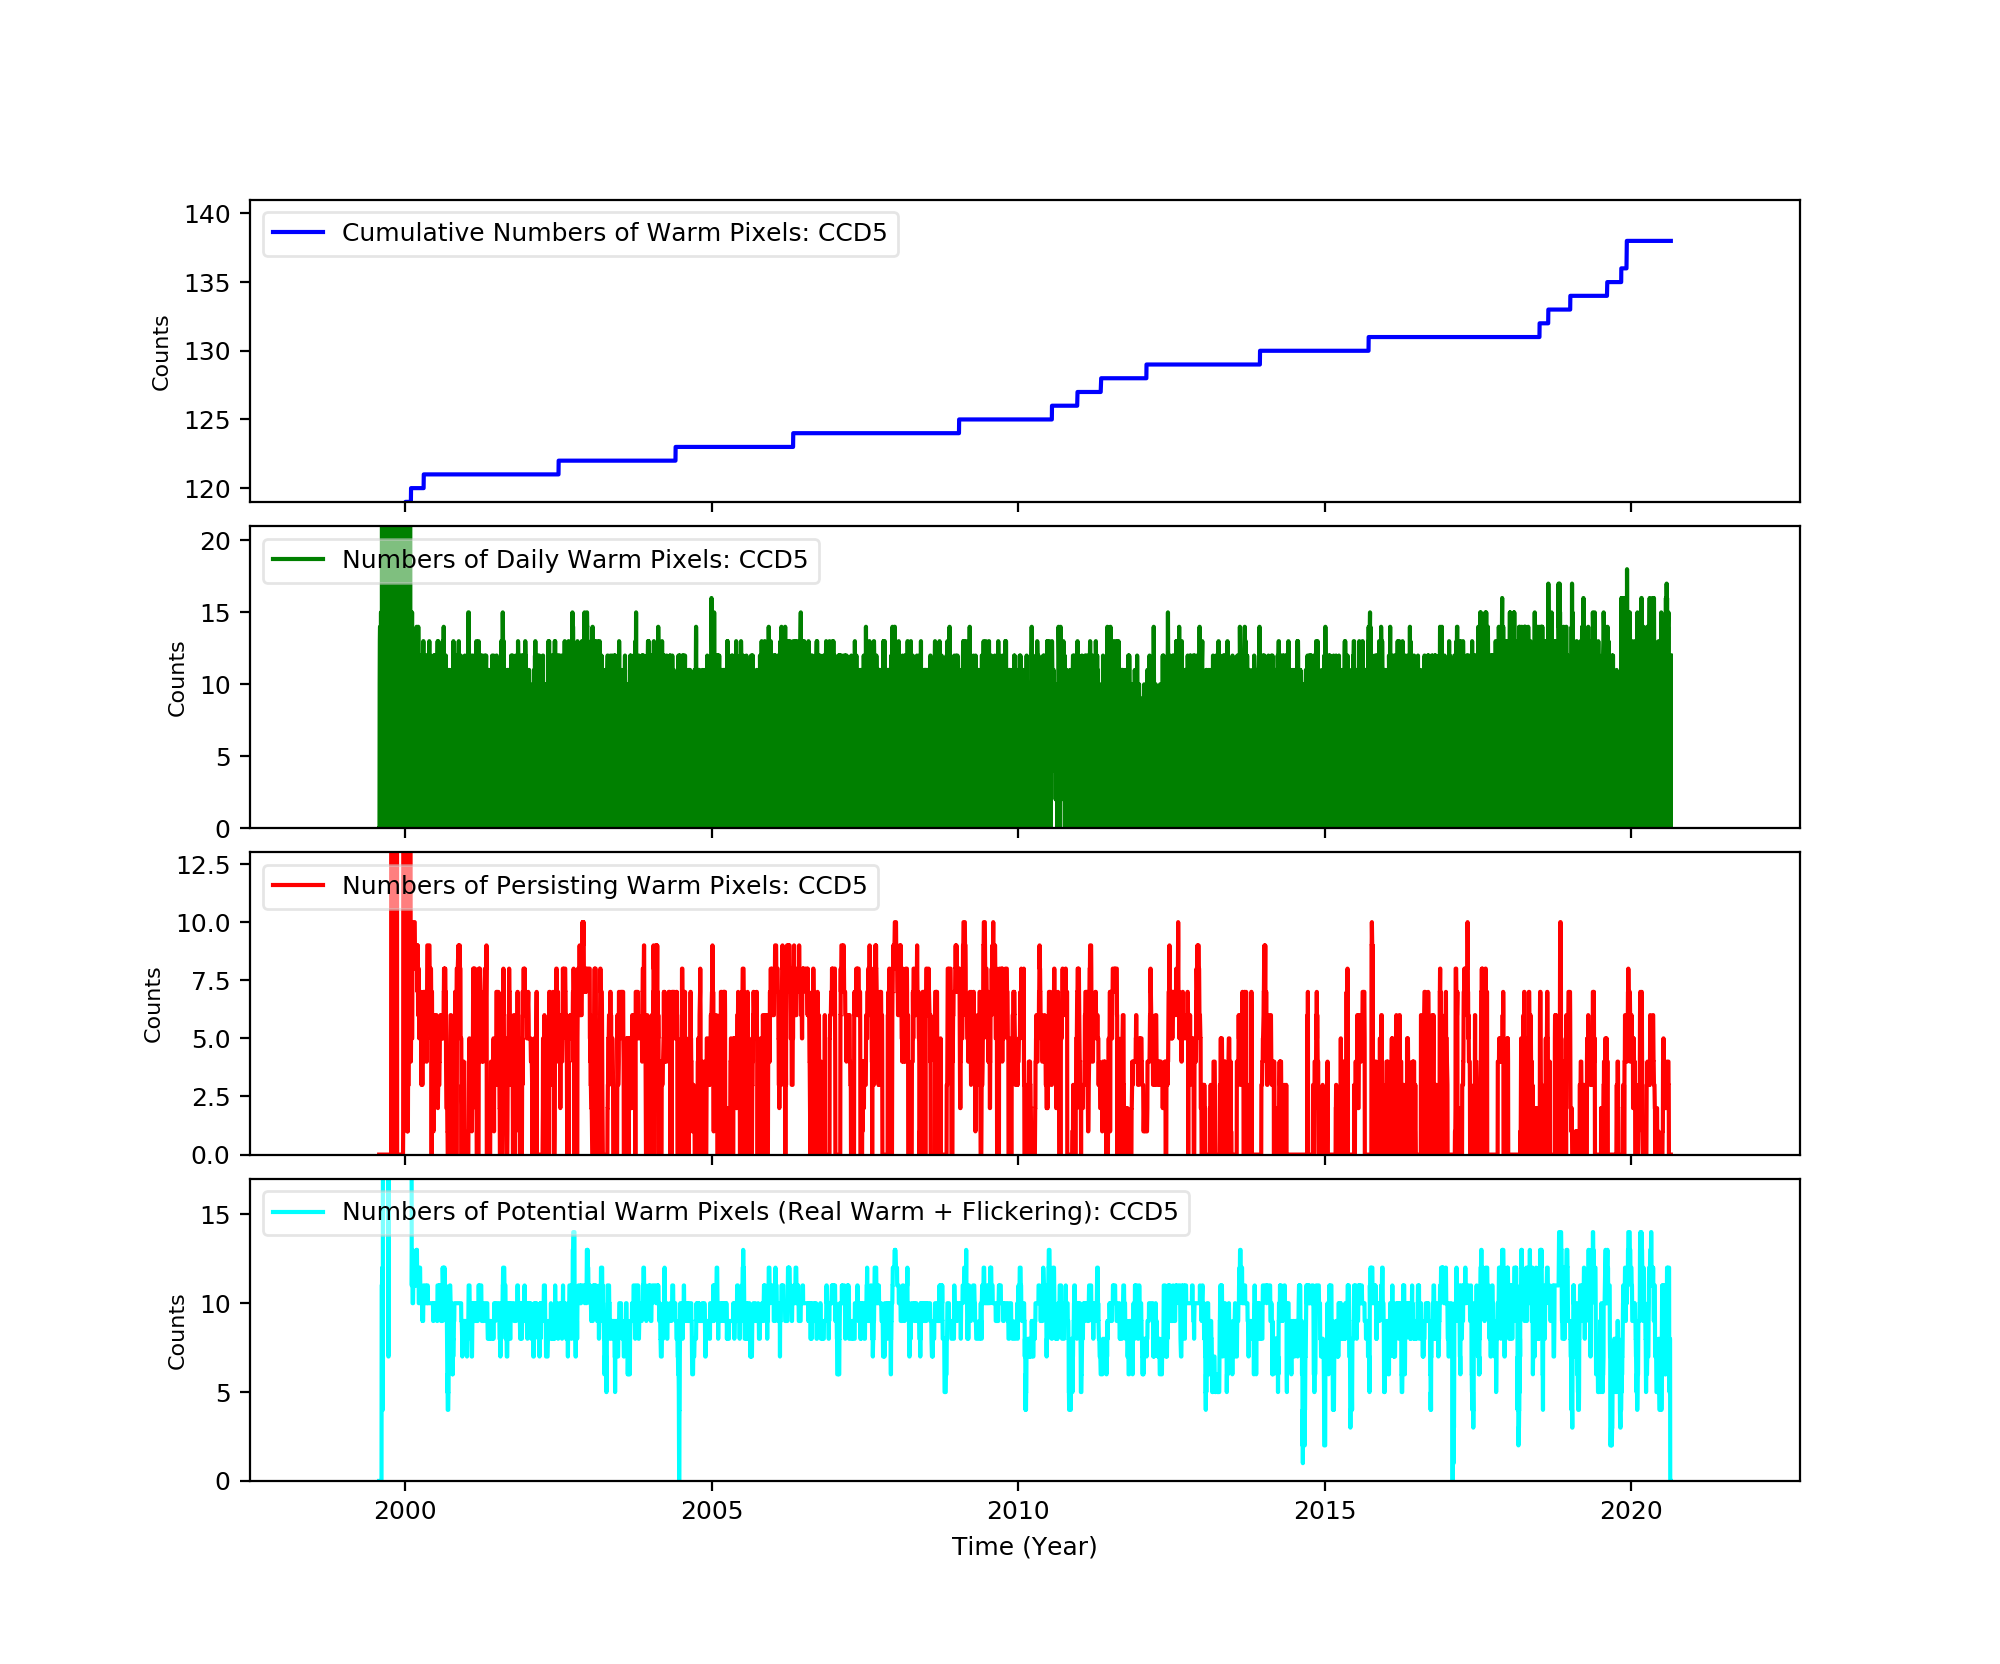
Bad Pixels
The plots below were generated with a new warm pixel finding script. Please see Acis Bad Pixel Page for details.
Front Side CCDs
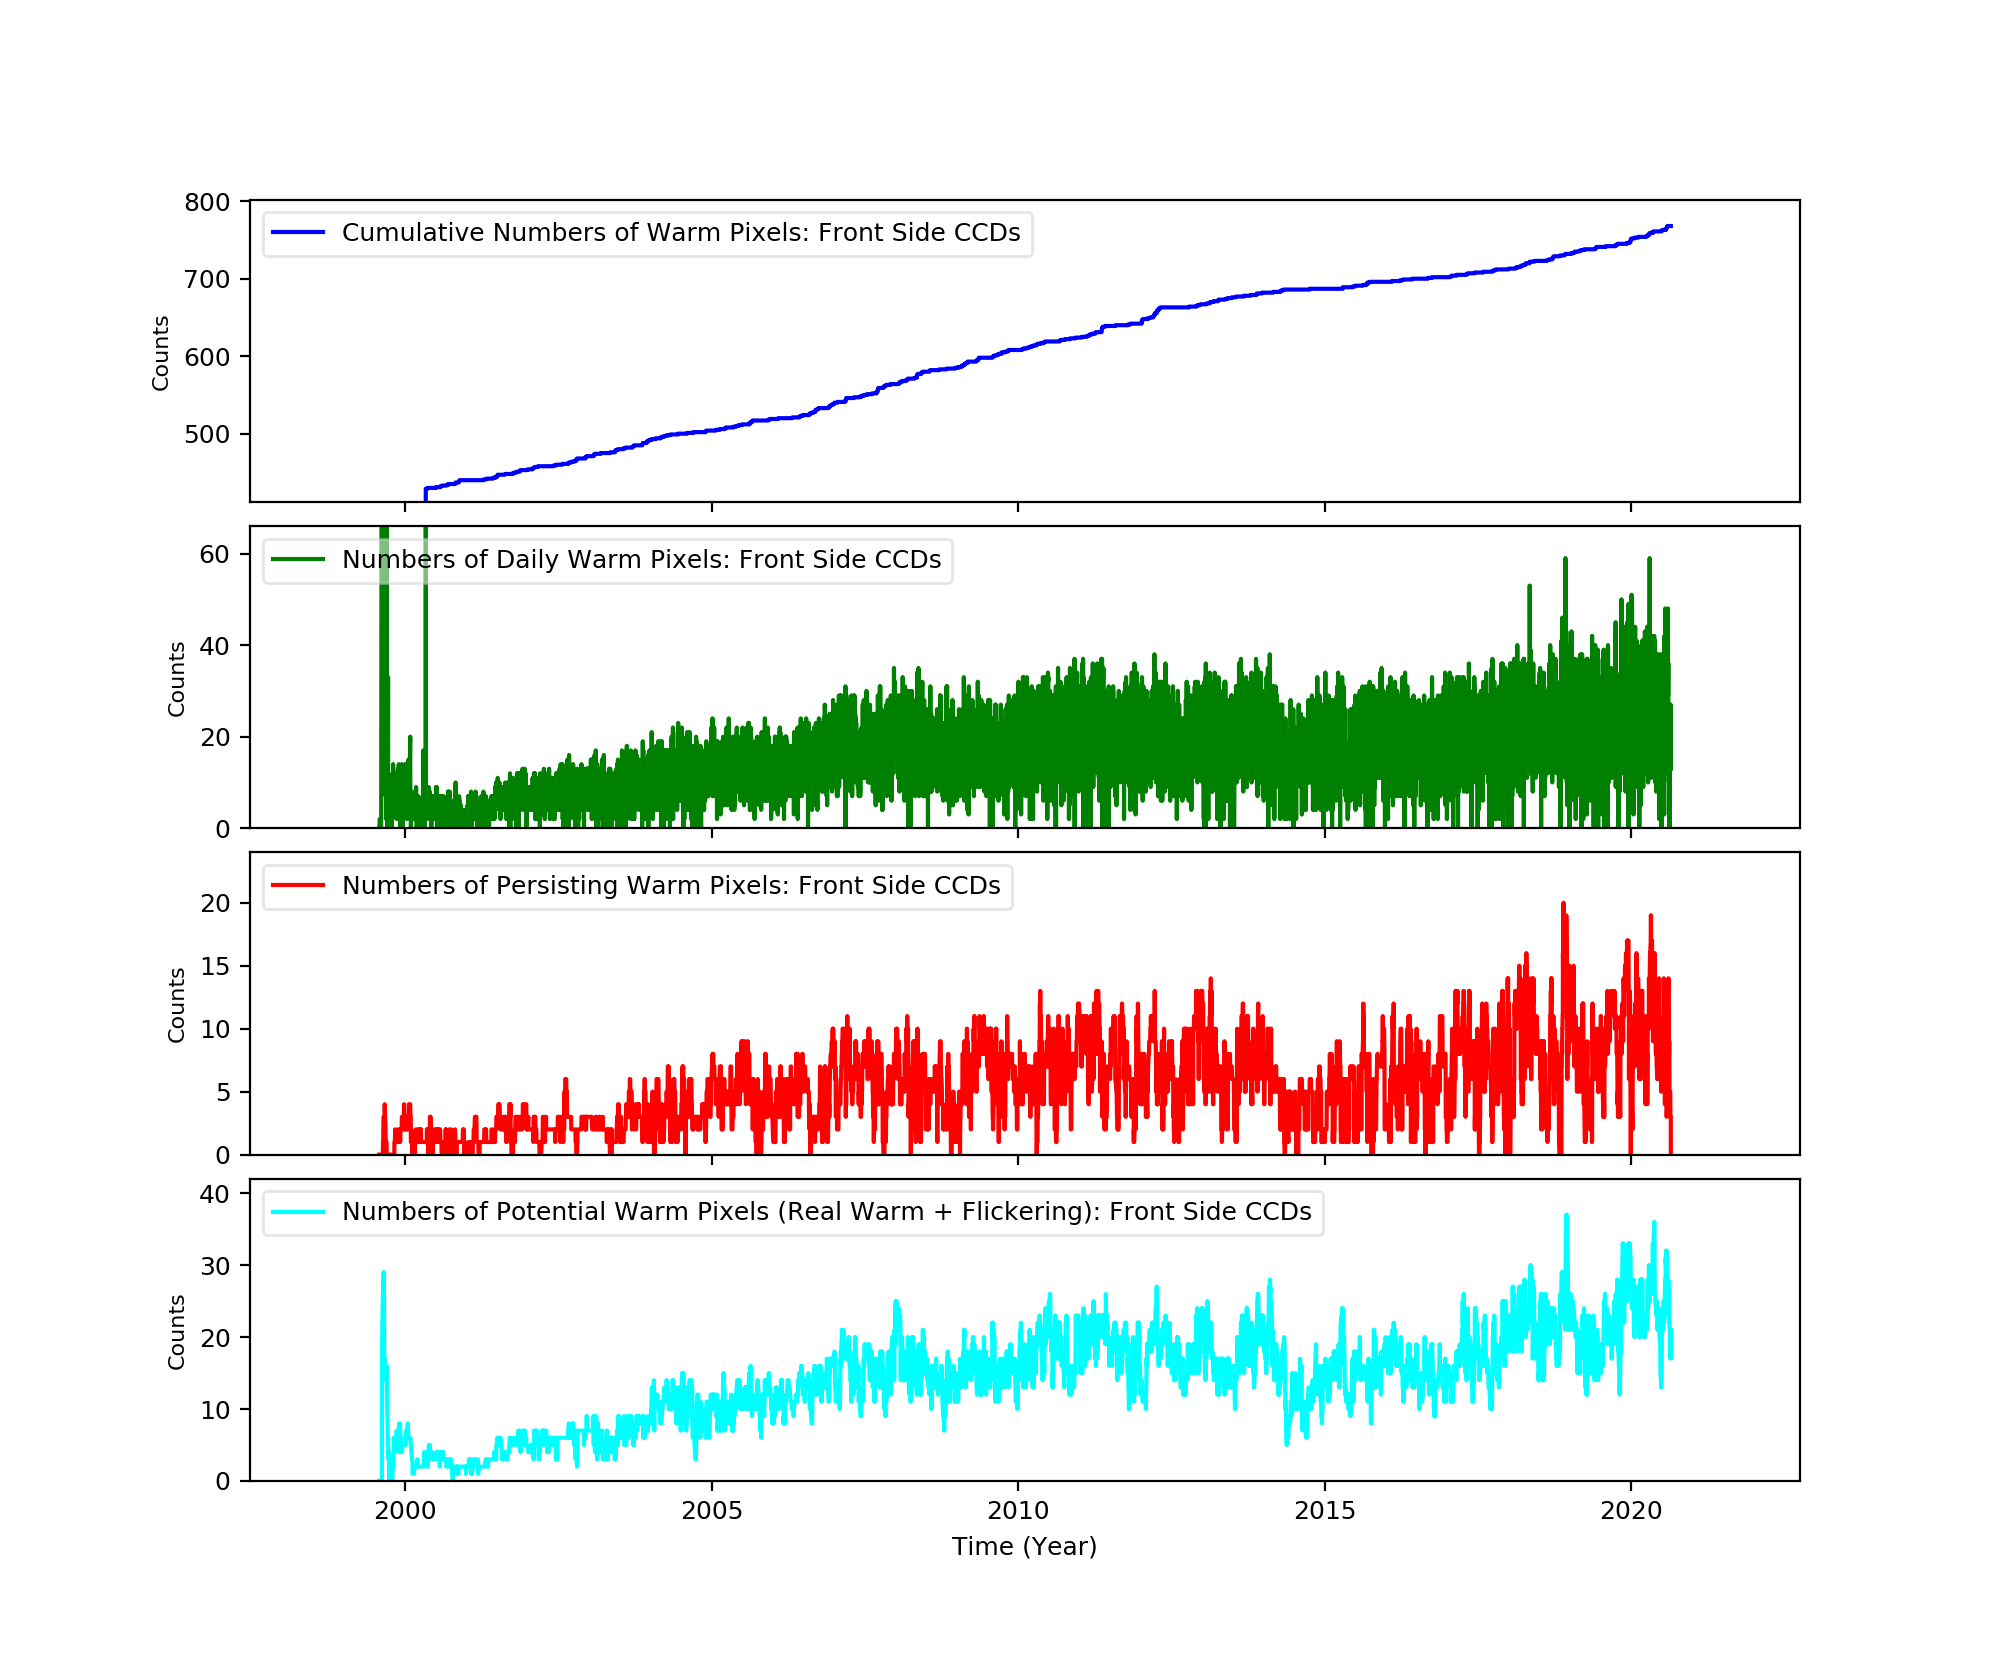
Back Side CCD (CCD5)
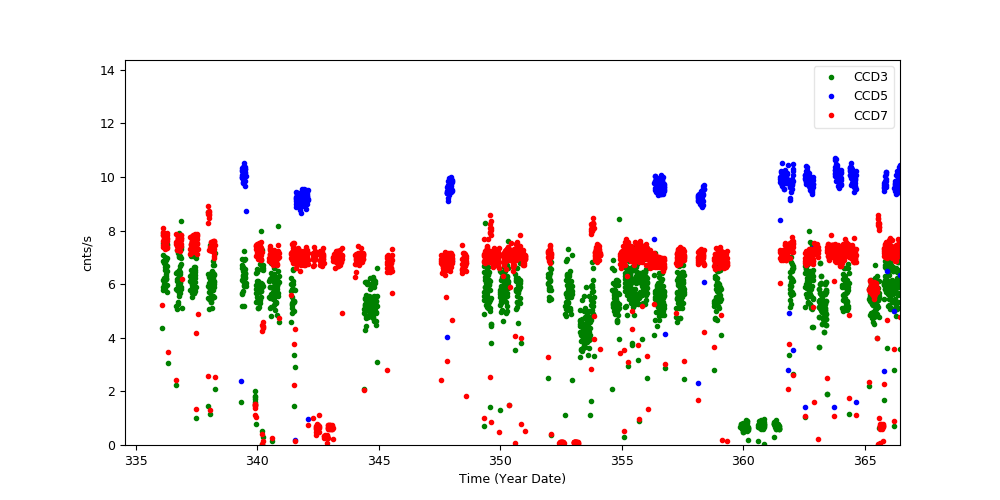
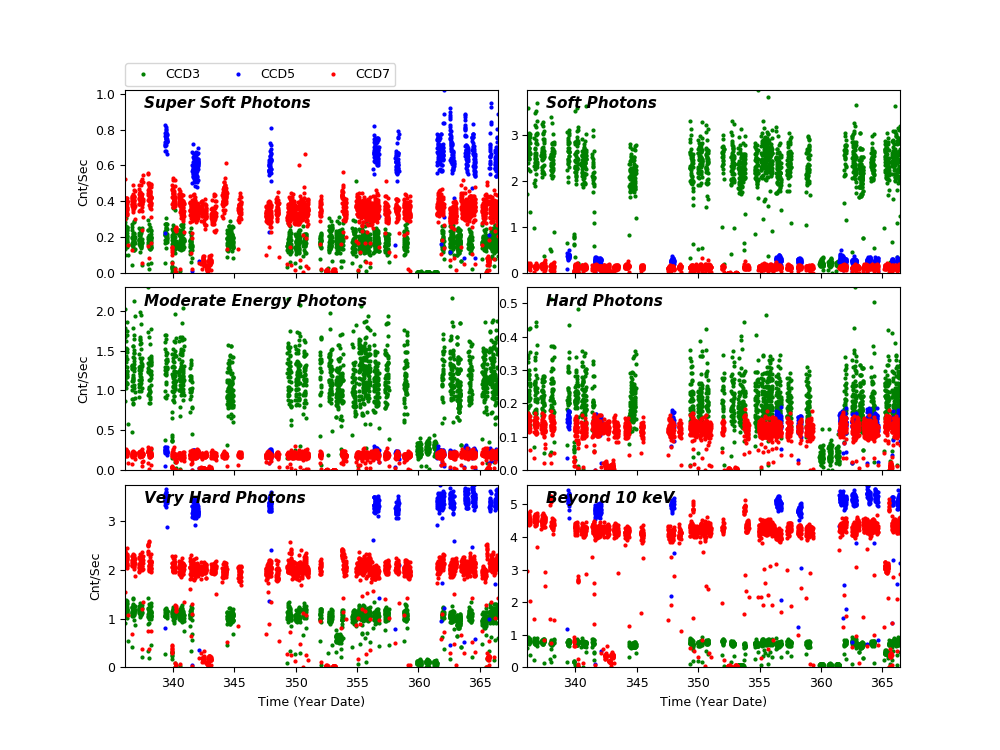
Science Instrument Background Rates
| Name | Low (keV) | High(KeV) | Description |
|---|---|---|---|
| SSoft | 0.00 | 0.50 | Super soft photons |
| Soft | 0.50 | 1.00 | Soft photons |
| Med | 1.00 | 3.00 | Moderate energy photons |
| Hard | 3.00 | 5.00 | Hard Photons |
| Harder | 5.00 | 10.00 | Very Hard photons |
| Hardest | 10.00 | Beyond 10 keV |
HRC
DOSE of Central 4K Pore-Pairs
Please refer to Maximum Dose Trends for more details.
)
|
|---|
IMAGE                NPIX      MEAN    STDDEV      MIN       MAX
HRCI_12_2020.fits  16777216	0.039 	0.200 	0.000 	7.000
)
IMAGE                       NPIX      MEAN    STDDEV      MIN       MAX
HRCI_08_1999_12_2020.fits  16777216	6.717 	6.172 	0.000 	310.000
)
|
|---|
IMAGE                NPIX      MEAN    STDDEV      MIN       MAX
HRCS_12_2020.fits  16777216	0.075 	0.282 	0.000 	5.000
)
IMAGE                       NPIX      MEAN    STDDEV      MIN       MAX
HRCS_08_1999_12_2020.fits  16777216	19.199 	34.564 	0.000 	1751.000
|
|
Max dose trend plots corrected for events that "pile-up"
in the center of the taps due to bad position information.
|
)
|
)
|
)
|
)
|
| Sep 2020 | Jun 2020 | Mar 2020 | Dec 2019 |
|---|
)
|
)
|
)
|
)
|
| Sep 2020 | Jun 2020 | Mar 2020 | Dec 2019 |
|---|
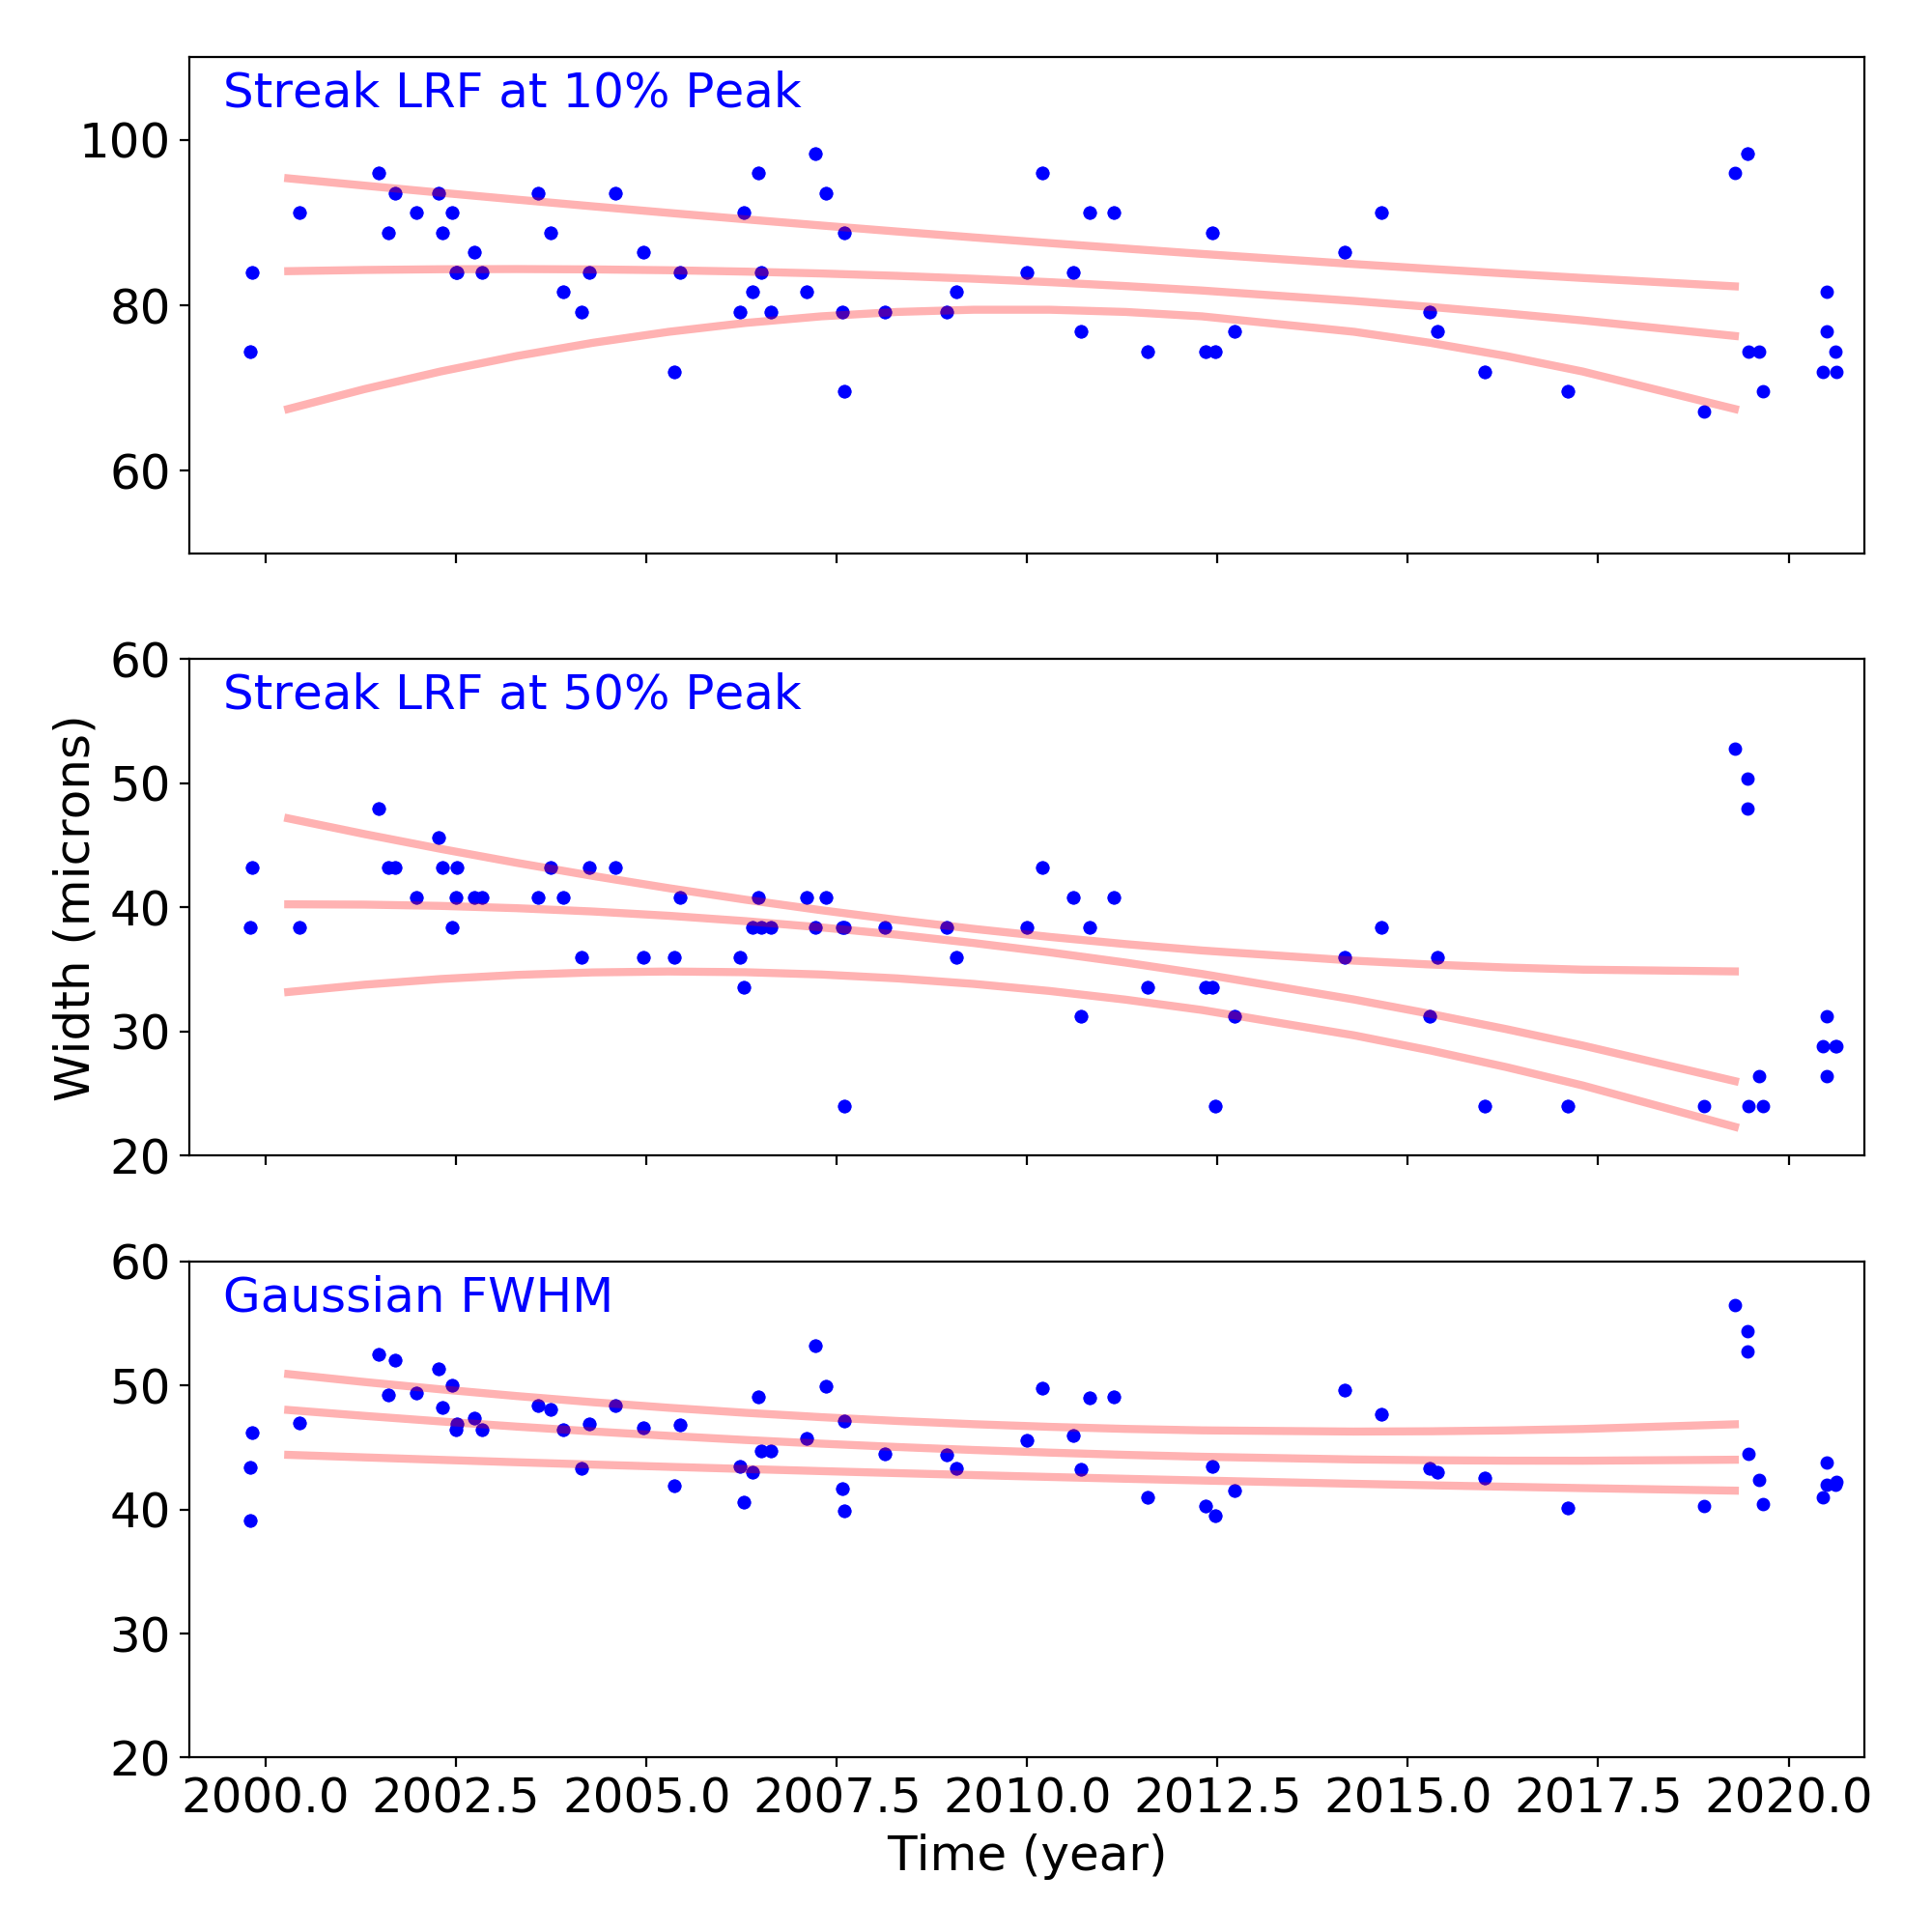
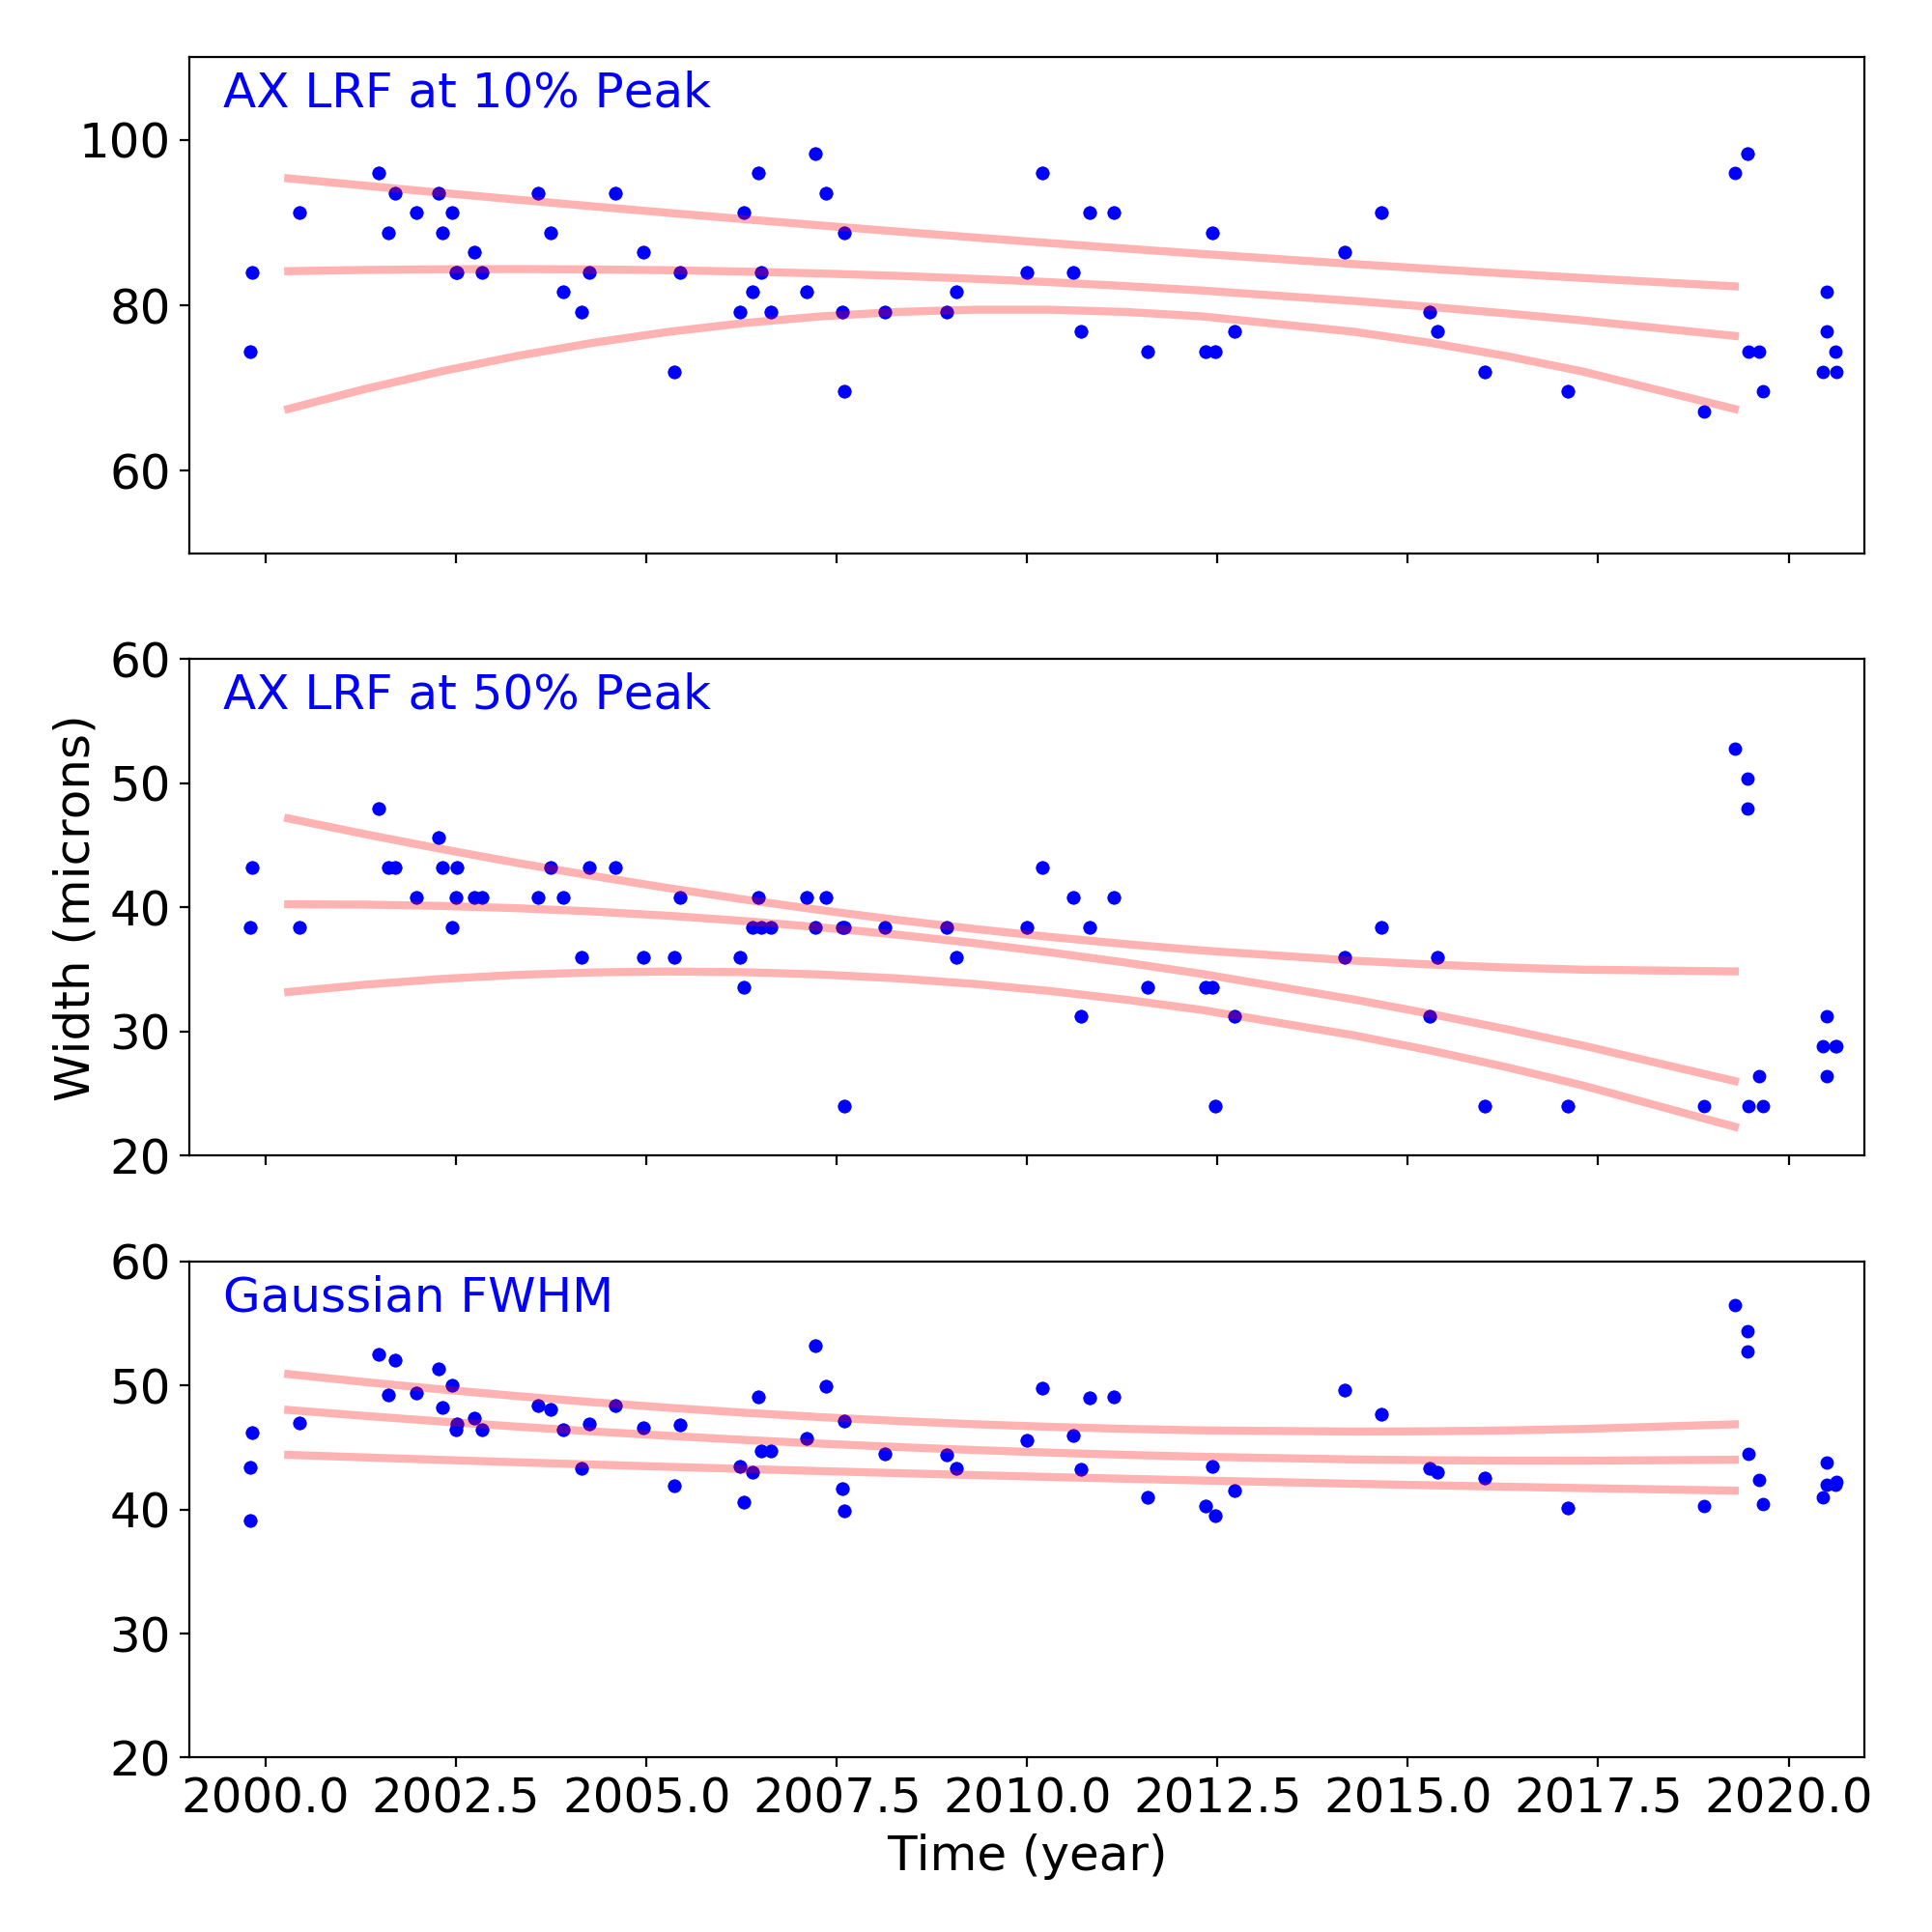
Gratings
Grating Trends/Focus
We plot the width of the zero order streak of ACIS/HETG observations and the width of the zero order image for HRC/LETG observations of point sources. No significant defocusing trend is seen at this time. See Gratings Trends pages.
PCAD
ACA Trending
| ACIS |
)
|
)
|
)
|
|
|---|---|---|---|---|
)
|
)
|
)
| ||
| HRCI |
)
|
)
|
)
|
)
|
| HRCI |
)
|
)
|
)
|
)
|
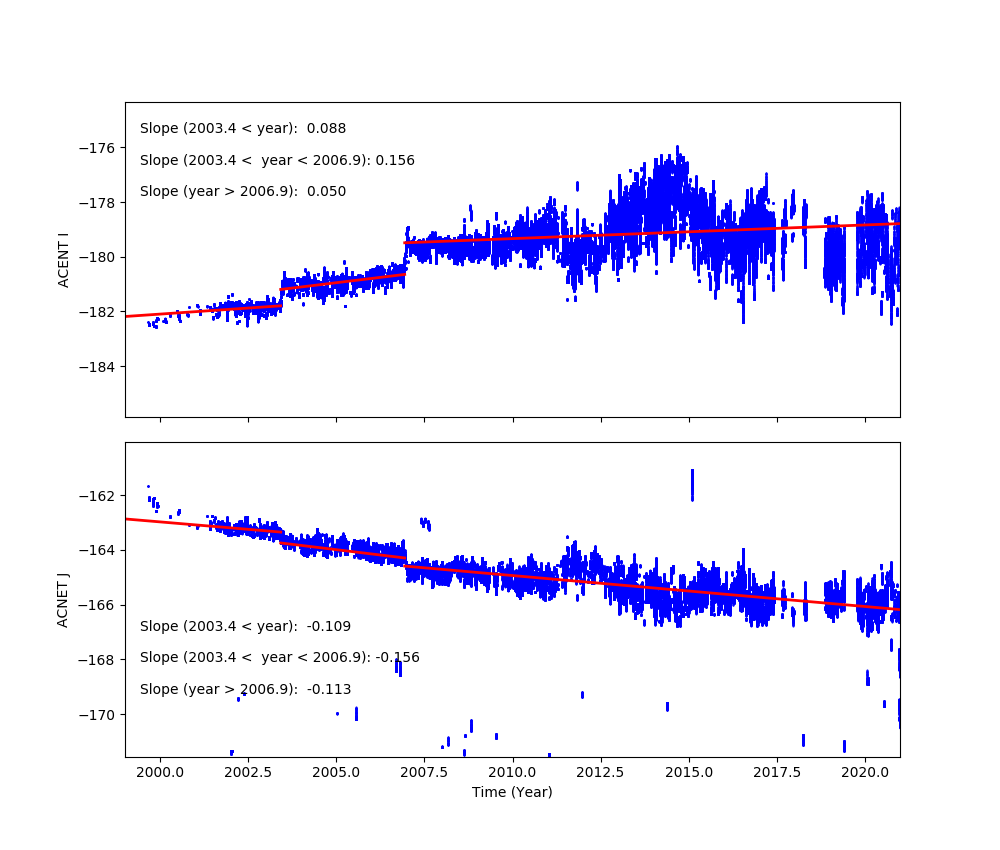
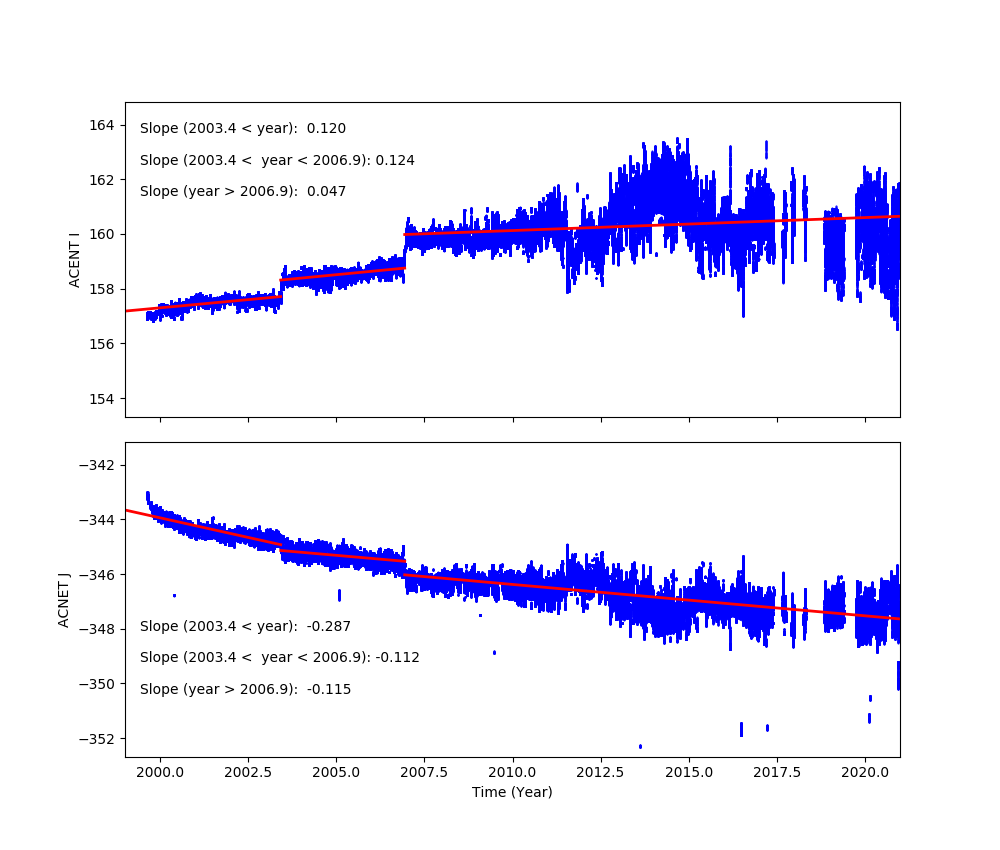
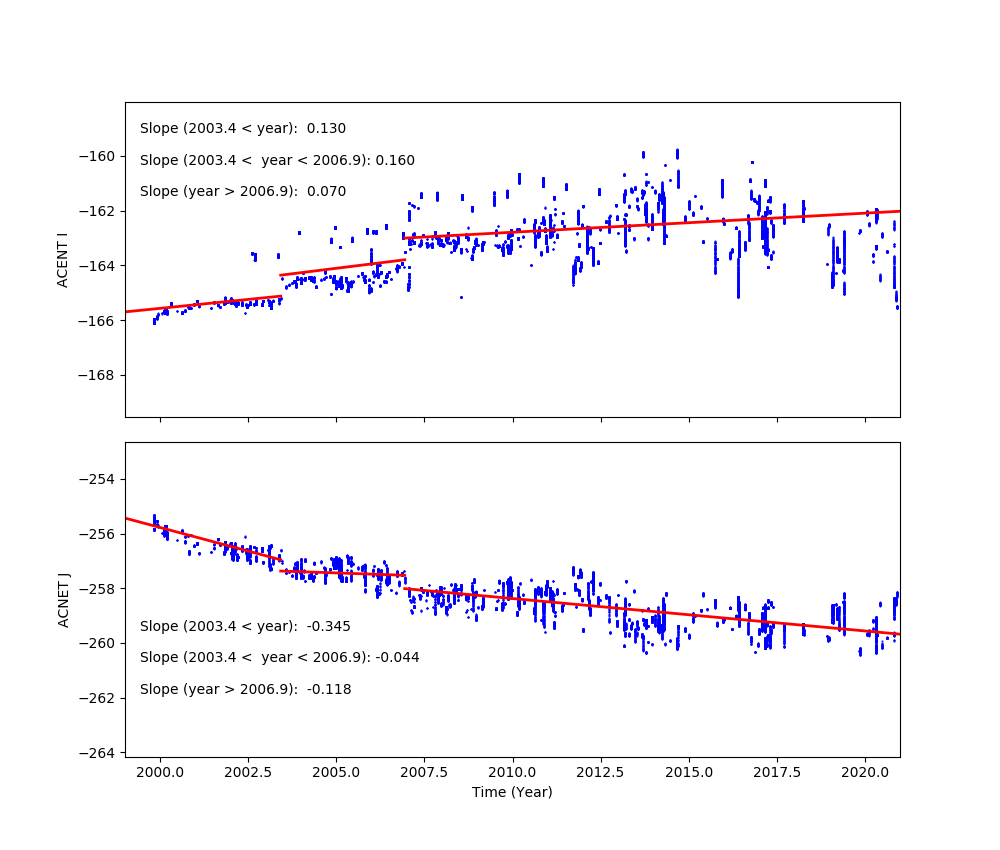
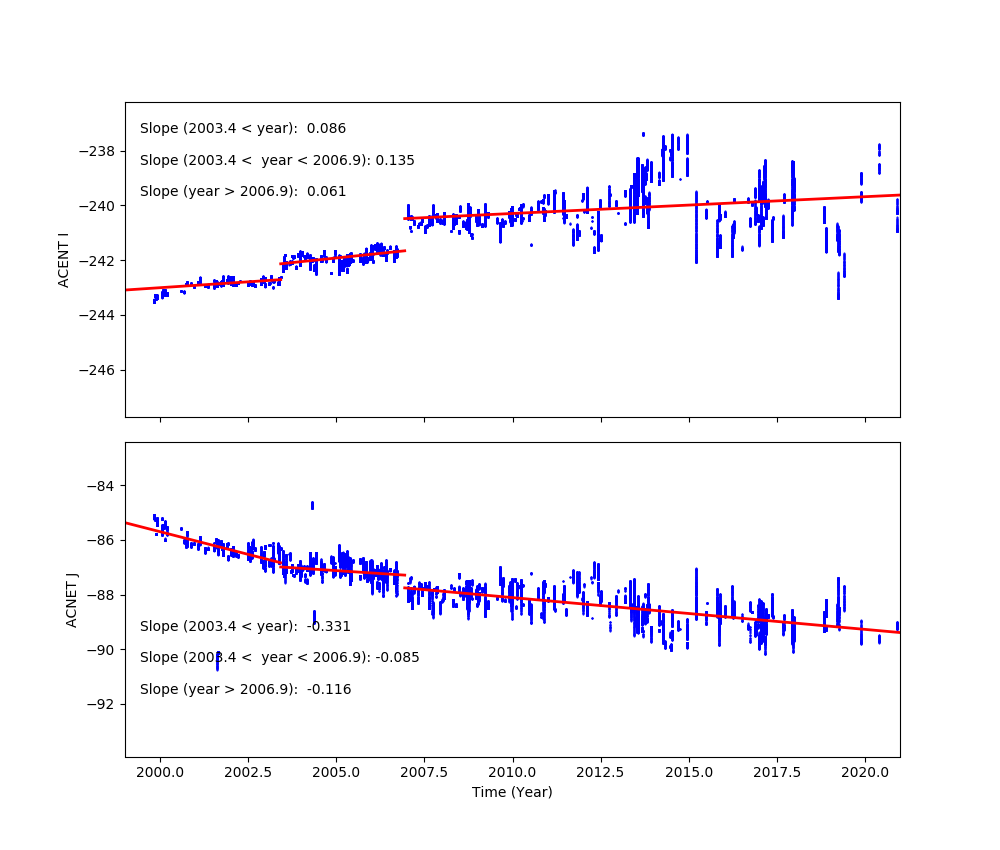
Fid Light Drift
Fid light positions on ACA drift with time. The drift trends of Fid light 2 with ACIS-I and ACIS-S configurations are shown below.
The top panel shows Fid light 2 drift in ACENT I (app. along with -Y axis), and the
bottom panel shows that in ACENT J (app. along with Z axis). The unit is a pixel, and
one pixel is approximately 0.5 arcsec. The slope listed at the top right corner is
the change in a position per year (arcsec/yr). The vertical line on DOM = 1411 (Jun 1, 2003)
indicates a transition date of use of IRU-1 to IRU-2.
See also Tom Aldcroft's updated page:
https://cxc.cfa.harvard.edu/mta/ASPECT/fid_drift
Fid 2 (ACIS-I)
Fid 2 (ACIS-S)
Fid 8 (HRC-I)
Fid 12 (HRC-S)
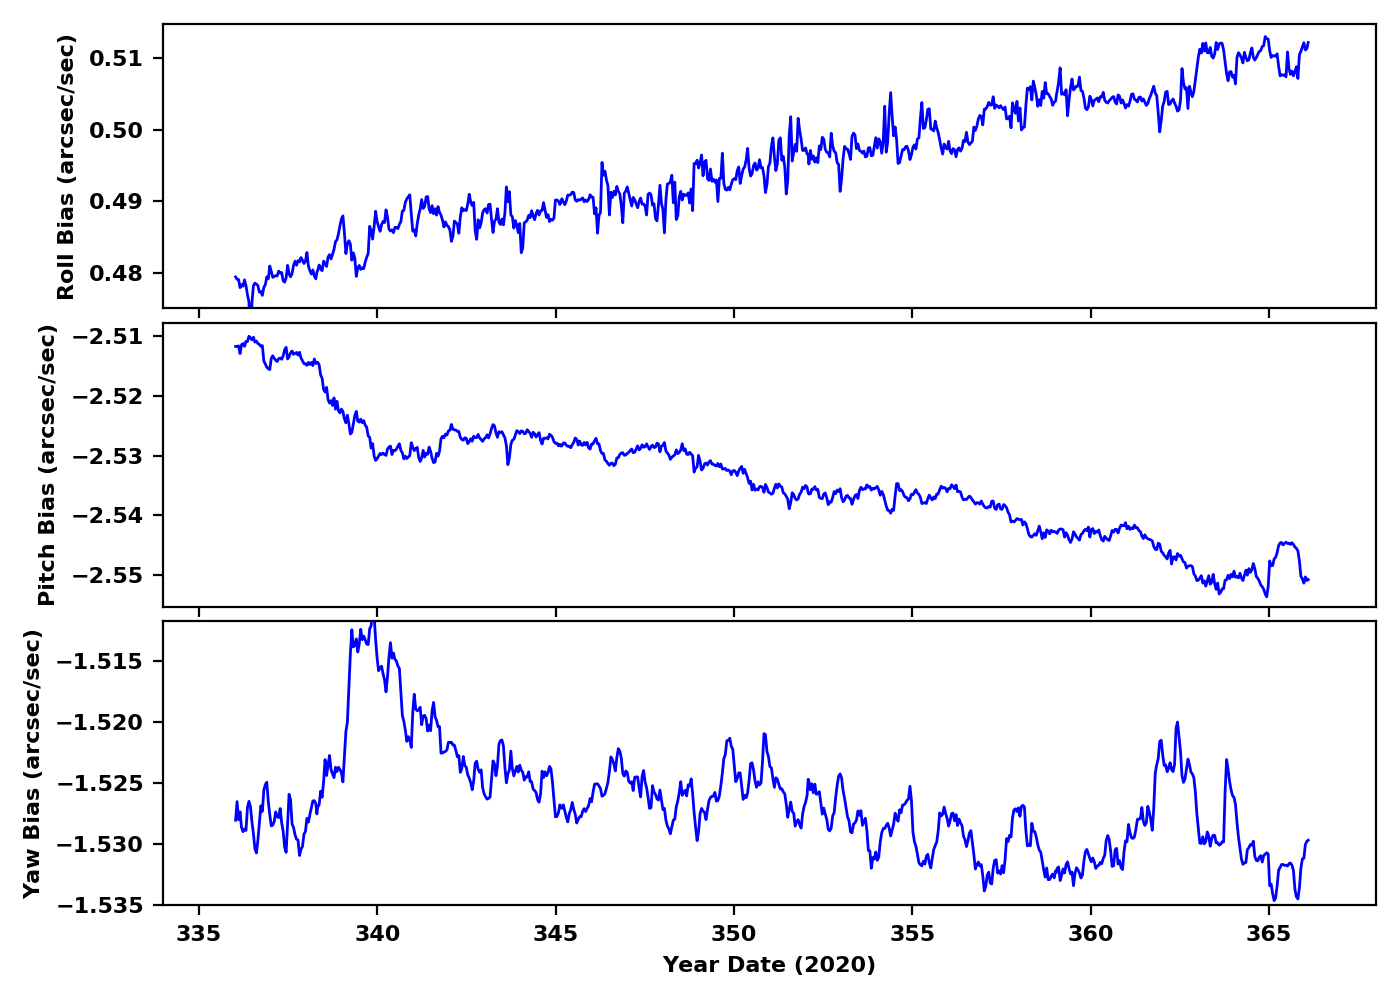
Gyro Bias Drift
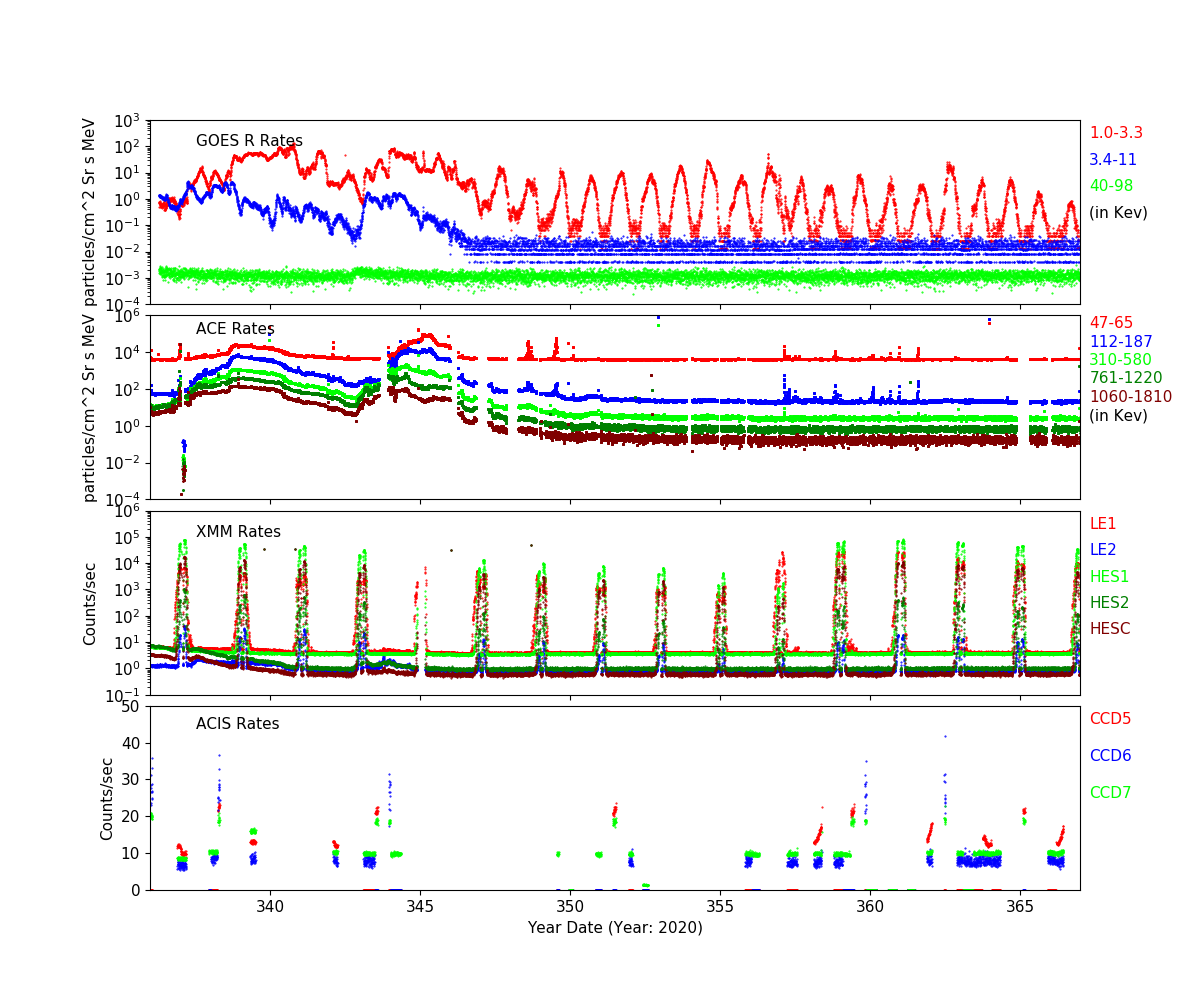
Radiation History
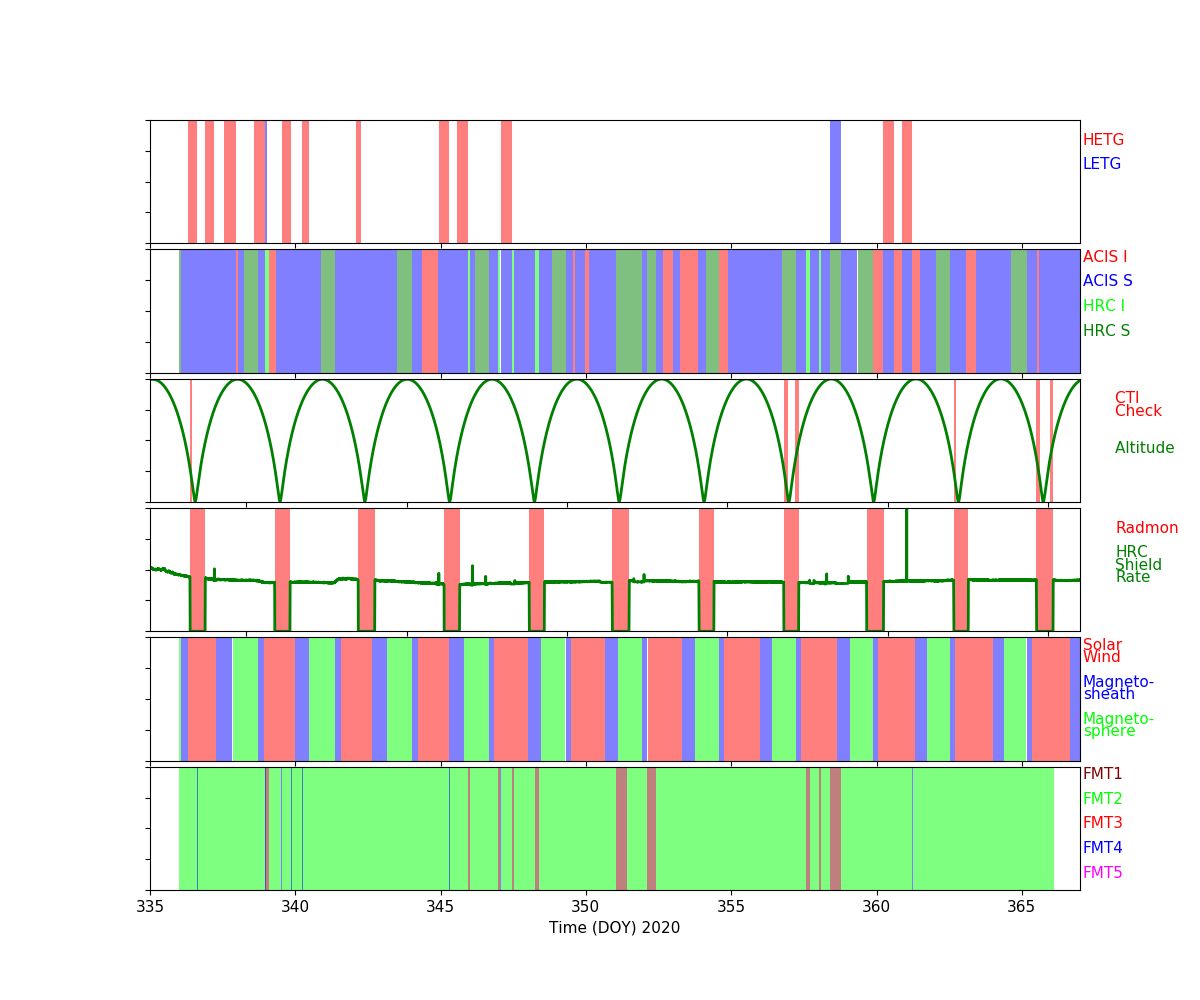
Radiation Count Rates of Dec 2020
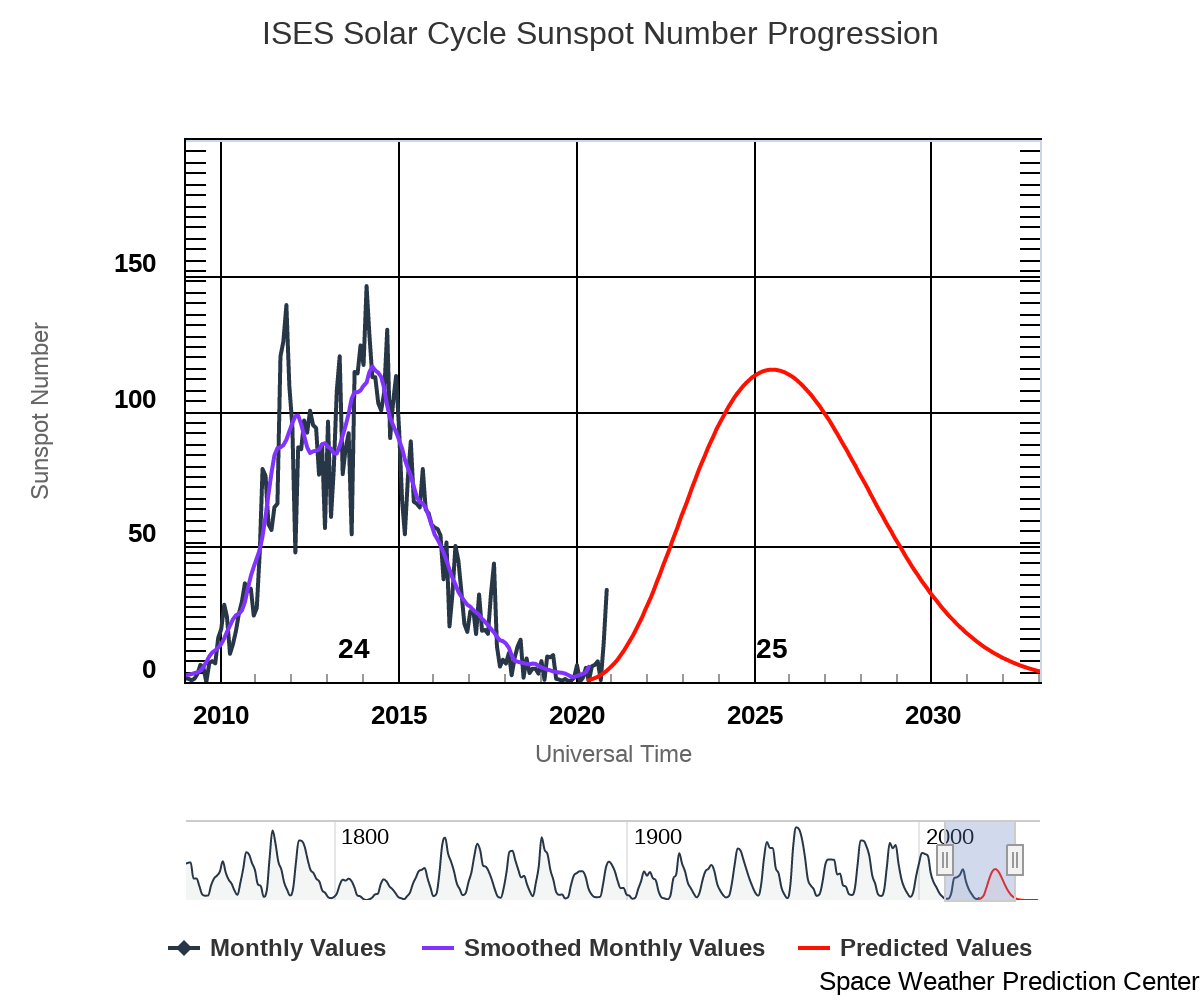
Sun Spot History (See:NOAA Page)
Trending
Critical Trends
| ACIS Temperatures - Daily Maximums | |||||||
|---|---|---|---|---|---|---|---|
| MSID | MEAN | RMS | DELTA/YR | DELTA/YR/YR | UNITS | DESCRIPTION | |
| 1pdeaat | 0.010 | 0.003 | (3.03+/-0.07)e2 | 2.94 +/- 2.28 | K | PSMC DEA PS A TEMP | |
| HRMA Computed Averages - Daily Maximums | |||||||
|---|---|---|---|---|---|---|---|
| MSID | MEAN | RMS | DELTA/YR | DELTA/YR/YR | UNITS | DESCRIPTION | |
| obaavg | 0.021 | 9.839e-04 | (2.98+/-0.02)e2 | -1.04 +/- 0.58 | TEMP | OBA/TFTE | |
| EPHIN Temperatures - Daily Maximums | |||||||
|---|---|---|---|---|---|---|---|
| MSID | MEAN | RMS | DELTA/YR | DELTA/YR/YR | UNITS | DESCRIPTION | |
| teio | 0.098 | 0.012 | (3.18+/-0.28)e2 | -4.06 +/- 4.33 | K | EPHIN ELECTRONICS HOUSING TEMP | |
| tephin | 0.051 | 0.004 | (3.30+/-0.09)e2 | 0.93 +/- 2.94 | K | EPHIN SENSOR HOUSING TEMP | |
| S/C Main Temperatures - Daily Maximums | |||||||
|---|---|---|---|---|---|---|---|
| MSID | MEAN | RMS | DELTA/YR | DELTA/YR/YR | UNITS | DESCRIPTION | |
| tcylfmzm | 0.145 | 0.008 | (3.11+/-0.20)e2 | -0.59 +/- 3.88 | K | CNT CYL TEMP:-Z SIDE UNDER LAE-1 | |
| tcylfmzp | 0.128 | 0.007 | (3.14+/-0.18)e2 | -1.22 +/- 3.49 | K | CNT CYL TEMP:-Z SIDE UNDER LAE-2 | |
| S/C Ancillary Temperatures - Daily Maximums | |||||||
|---|---|---|---|---|---|---|---|
| MSID | MEAN | RMS | DELTA/YR | DELTA/YR/YR | UNITS | DESCRIPTION | |
| tfssbkt1 | 0.134 | 0.014 | (3.36+/-0.31)e2 | -4.54 +/- 4.85 | K | FSS BRAC | |
| tfssbkt2 | 0.130 | 0.016 | (3.32+/-0.35)e2 | -4.49 +/- 5.30 | K | FSS BRAC | |
| tsctsf1 | 0.046 | 0.002 | (3.17+/-0.05)e2 | -0.51 +/- 1.80 | K | SC-TS FITTING -1 TEMP | |
| tsctsf6 | 0.048 | 0.002 | (3.16+/-0.05)e2 | -0.36 +/- 1.85 | K | SC-TS FITTING -6 TEMP | |
| MUPS - Daily Maximums | |||||||
|---|---|---|---|---|---|---|---|
| MSID | MEAN | RMS | DELTA/YR | DELTA/YR/YR | UNITS | DESCRIPTION | |
| pm1thv1t | 0.032 | 0.007 | (3.48+/-0.16)e2 | -0.38 +/- 4.05 | K | MUPS 1 THRUSTER VALVE 01 TEMP | |
| pm2thv1t | 0.005 | 0.018 | (3.26+/-0.40)e2 | -9.69 +/- 10.05 | K | MUPS 2 THRUSTER VALVE 01 TEMP | |
| pm1thv2t | 0.027 | 0.007 | (3.50+/-0.15)e2 | -0.59 +/- 4.18 | K | MUPS 1 THRUSTER VALVE 02 TEMP | |
| pm2thv2t | -0.017 | 0.020 | (3.21+/-0.44)e2 | -3.22 +/- 10.94 | K | MUPS 2 THRUSTER VALVE 02 TEMP | |
| pline02t | 0.050 | 0.006 | (3.29+/-0.14)e2 | -2.24 +/- 3.62 | K | PROP LINE TEMP 02 | |
| pline03t | 0.063 | 0.007 | (3.25+/-0.17)e2 | -1.81 +/- 3.41 | K | PROP LINE TEMP 03 | |
| pline04t | 0.059 | 0.006 | (3.12+/-0.13)e2 | -4.77 +/- 3.21 | K | PROP LINE TEMP 04 | |
Quarterly Trends
- HRMA Struts
| Previous Quarter | |||||||
| MSID | MEAN | RMS | DELTA/YR | DELTA/YR/YR | UNITS | DESCRIPTION | |
| 4rt584t | 0.013 | 6.038e-04 | (3.00+/-0.01)e2 | 0.33 +/- 0.39 | K | RT 584 - STRUT TEMP | |
|---|---|---|---|---|---|---|---|
| 4rt585t | 0.014 | 6.290e-04 | (3.00+/-0.02)e2 | 0.35 +/- 0.39 | K | RT 585 - STRUT TEMP | |
| 4rt586t | 0.010 | 4.612e-04 | (2.97+/-0.01)e2 | 0.18 +/- 0.30 | K | RT 586 - STRUT TEMP | |
| 4rt587t | 0.007 | 3.268e-04 | (2.91+/-0.01)e2 | 0.09 +/- 0.20 | K | RT 587 - STRUT TEMP | |
| 4rt597t | 0.019 | 0.001 | (3.06+/-0.03)e2 | 0.39 +/- 0.97 | K | RT 597 - TFTE TEMP | |
| 4rt598t | 0.022 | 0.001 | (3.05+/-0.03)e2 | 0.41 +/- 0.95 | K | RT 598 - TFTE TEMP | |
- OB Forward Bulkhead
| Previous Quarter | |||||||
| MSID | MEAN | RMS | DELTA/YR | DELTA/YR/YR | UNITS | DESCRIPTION | |
| 4rt705t | 0.018 | 6.373e-04 | (2.91+/-0.02)e2 | 0.15 +/- 0.45 | K | RT 705 - OB BUL | |
|---|---|---|---|---|---|---|---|
| 4rt706t | 0.019 | 6.683e-04 | (2.90+/-0.02)e2 | 0.06 +/- 0.46 | K | RT 706 - OB BUL | |
| 4rt707t | 0.018 | 6.417e-04 | (2.93+/-0.02)e2 | 0.08 +/- 0.46 | K | RT 707 - OB BULKHEAD TEMP | |
| 4rt708t | 0.023 | 7.744e-04 | (2.97+/-0.02)e2 | 0.14 +/- 0.54 | K | RT 708 - OB BULKHEAD TEMP | |
| 4rt709t | 0.024 | 8.388e-04 | (2.99+/-0.02)e2 | 0.35 +/- 0.58 | K | RT 709 - OB BULKHEAD TEMP | |
| 4rt710t | 0.024 | 8.760e-04 | (3.00+/-0.02)e2 | 0.51 +/- 0.63 | K | RT 710 - OB BULKHEAD TEMP | |
- HRMA Thermal
- HRMA Thermal
| Previous Quarter | |||||||
| MSID | MEAN | RMS | DELTA/YR | DELTA/YR/YR | UNITS | DESCRIPTION | |
| 4rt568t | 0.013 | 7.747e-04 | (2.98+/-0.02)e2 | 0.18 +/- 0.51 | K | RT 568 - HRMA TEMP | |
|---|---|---|---|---|---|---|---|
| 4rt569t | 0.004 | 1.909e-04 | (2.96+/-0.00)e2 | 0.14 +/- 0.10 | K | RT 569 - HRMA TEMP | |
| 4rt570t | 0.001 | 9.994e-05 | (2.95+/-0.00)e2 | 0.08 +/- 0.04 | K | RT 570 - HRMA TEMP | |
| 4rt575t | 0.015 | 9.746e-04 | (3.02+/-0.02)e2 | 0.39 +/- 0.71 | K | RT 575 - OB CONE TEMP | |
| 4rt576t | 0.012 | 7.040e-04 | (2.94+/-0.02)e2 | 0.17 +/- 0.50 | K | RT 576 - OB CONE TEMP | |
| 4rt578t | 0.016 | 0.001 | (3.01+/-0.03)e2 | -0.01 +/- 0.85 | K | RT 578 - OB CONE TEMP | |
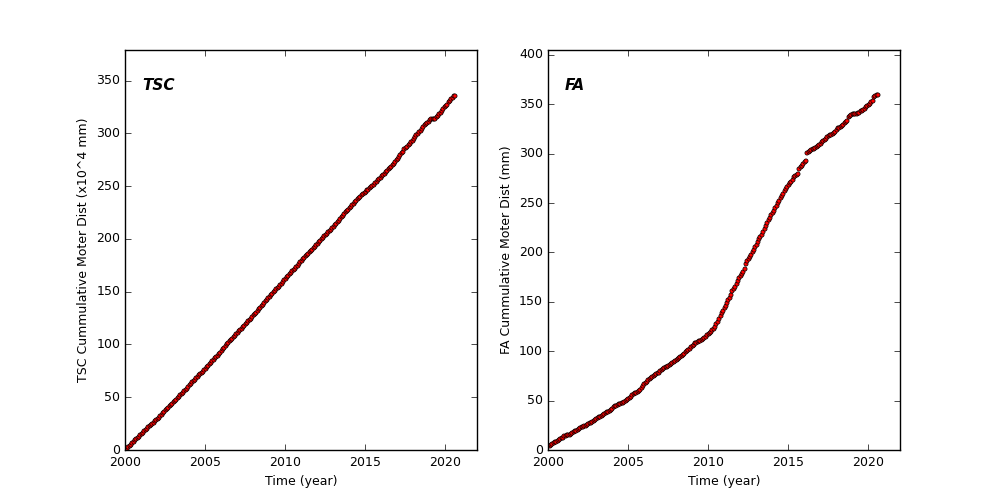
Spacecraft Motions
TSC and FA Cummulative Moter Distance
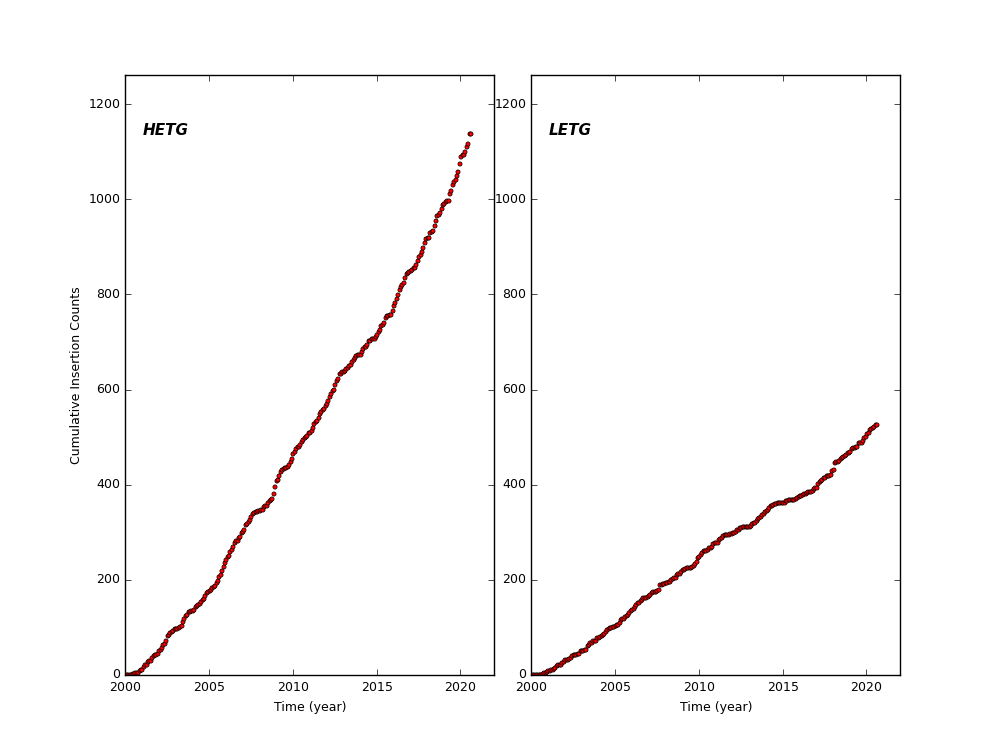
HETG and LETG Cummulative Insertion Counts
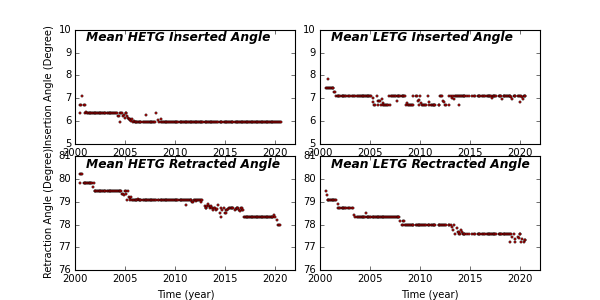
HETG/LETG Insertion/Retraction Angle
Reaction Wheel Rotations