ACIS
ACIS DOSE Registered-Photon-Map
The steps we took to compute the dose map are;
- Level 1 Event files for a specified month are obtained from archive.
- Image data including I2, I3, S2, S3 CCDs are extracted from all event files.
- All the extracted image data were merged to create a month long exposure map for the month.
- The exposure map is opened with ds9, and check a distribution of count rates against energy. From this, estimate the upper threshold value. Any events beyond this upper threshold are assumed erroneous events such as bad pixels.
- Using this upper threshold, the data is filtered, and create a cleaned exposure map for the month.
- The exposure map from each month from the Sep 1999 is added up to create a cumulative exposure map for each month.
- Using fimgstatistic, we compute count rate statistics for each CCDs.
- For observations with high data drop rates (e.g., Crab nebula, Cas A), we corrected the observations by adding events.
Please check more detail plots at Telemetered Photon Dose Trend page.
)
)
)
Statistics:
# IMAGE     NPIX     MEAN        RMS        MIN     MAX
ACIS_oct21 6004901       6.511         8.080           0.0      938


I2 node 0  262654	7.358010	3.355546	0.0	 77.0
I2 node 1  262654	7.833799	4.256484	0.0	929.0
I2 node 2  262654	9.379950	4.305087	0.0	 92.0
I2 node 3  262654	9.726827	4.583022	0.0	376.0

I3 node 0  262654	9.316097	4.187776	0.0	 97.0
I3 node 1  262654	8.987964	4.080253	0.0	140.0
I3 node 2  262654	8.000493	3.618829	0.0	 76.0
I3 node 3  262654	7.763041	3.446347	0.0	119.0

S2 node 0  262654	5.865636	2.844881	0.0	 73.0
S2 node 1  262654	5.707831	2.861494	0.0	154.0
S2 node 2  262654	5.946113	3.448310	0.0	938.0
S2 node 3  262654	6.252390	3.130470	0.0	352.0

S3 node 0  262654	10.886918	4.023373	0.0	 59.0
S3 node 1  262654	12.532228	4.677347	0.0	130.0
S3 node 2  262654	12.277830	3.926029	0.0	 61.0
S3 node 3  262654	10.998043	3.685833	0.0	 47.0
)
)
)
Statistics:
 IMAGE     NPIX      MEAN        RMS           MIN      MAX
ACIS_total   6004901       2523.981         3246.142           0.0   139533


I2 node 0  262654	2181.990074	438.121319	465.0	13069.0
I2 node 1  262654	2294.660609	621.717097	482.0	123698.0
I2 node 2  262654	2322.768759	492.703344	501.0	13575.0
I2 node 3  262654	2328.907732	602.034056	474.0	28803.0

I3 node 0  262654	2501.870174	615.408580	461.0	13543.0
I3 node 1  262654	2578.773059	1726.068713	499.0	55696.0
I3 node 2  262654	2292.894084	429.635686	469.0	13621.0
I3 node 3  262654	2284.931408	461.531937	436.0	34380.0

S2 node 0  262654	2940.948602	476.440070	1600.0	22279.0
S2 node 1  262654	3117.623930	707.337012	1784.0	16900.0
S2 node 2  262654	3450.684325	712.854738	2202.0	29159.0
S2 node 3  262654	3413.335017	567.743104	1940.0	69439.0

S3 node 0  262654	5243.679454	2890.122072	2278.0	53410.0
S3 node 1  262654	6435.342822	2350.026504	0.0	38221.0
S3 node 2  262654	5174.636692	1336.845996	2338.0	27113.0
S3 node 3  262654	4044.323160	751.506620	2445.0	26352.0
)
|
)
|
)
|
)
|
| Jul 2021 | Apr 2021 | Jan 2021 | Oct 2020 |
|---|
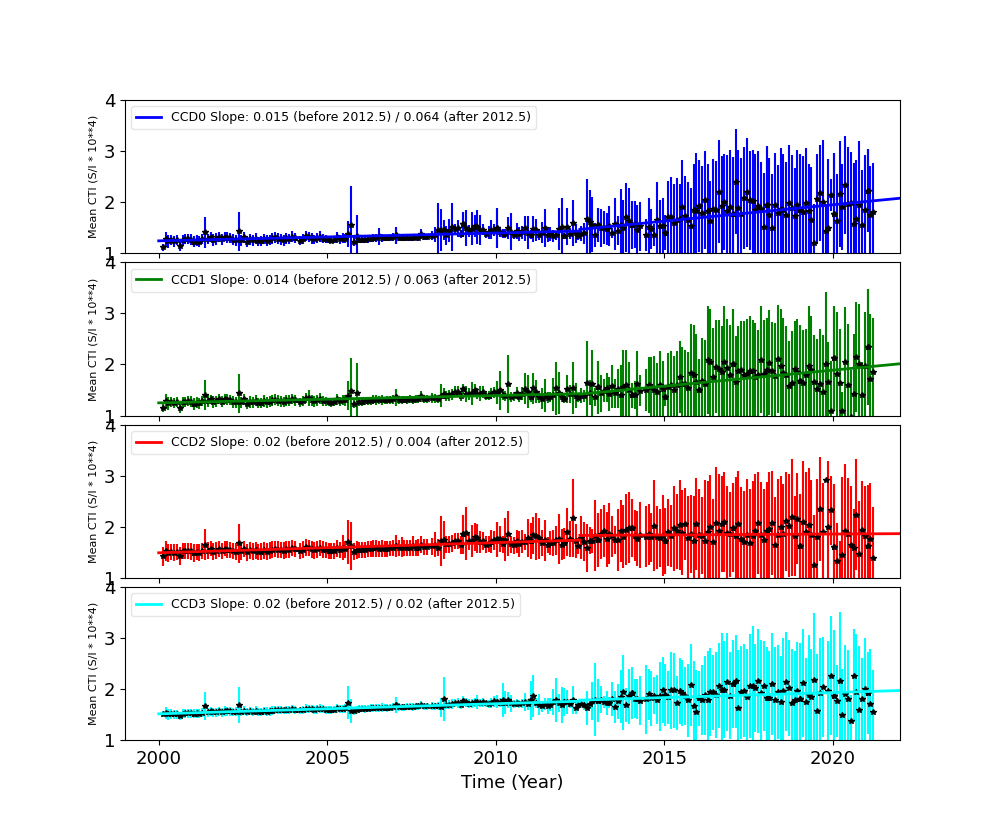
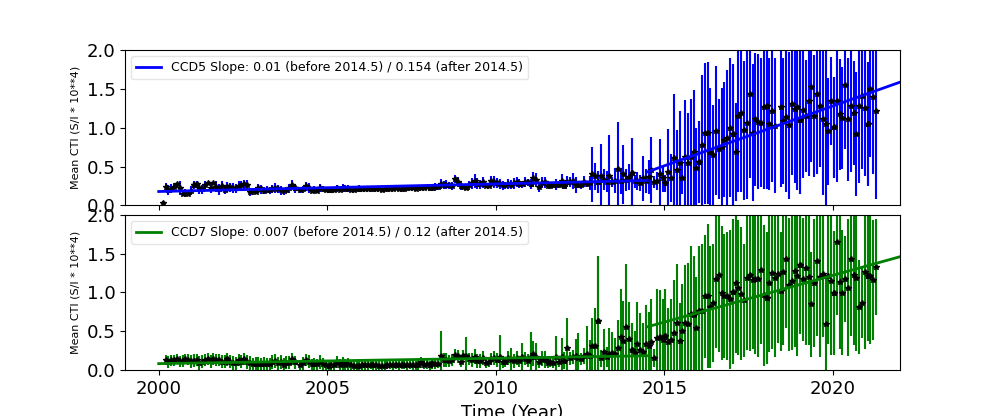
The Mean Detrended CTI
We report CTIs with a refined data definition. CTIs were computed for the temperature dependency corrected data. Please see CTI page for detailed explanation. CTI's are computed for Mn K alpha, and defined as slope/intercept x10^4 of row # vs ADU. Data file: here
Imaging CCDs
Spectral CCDs
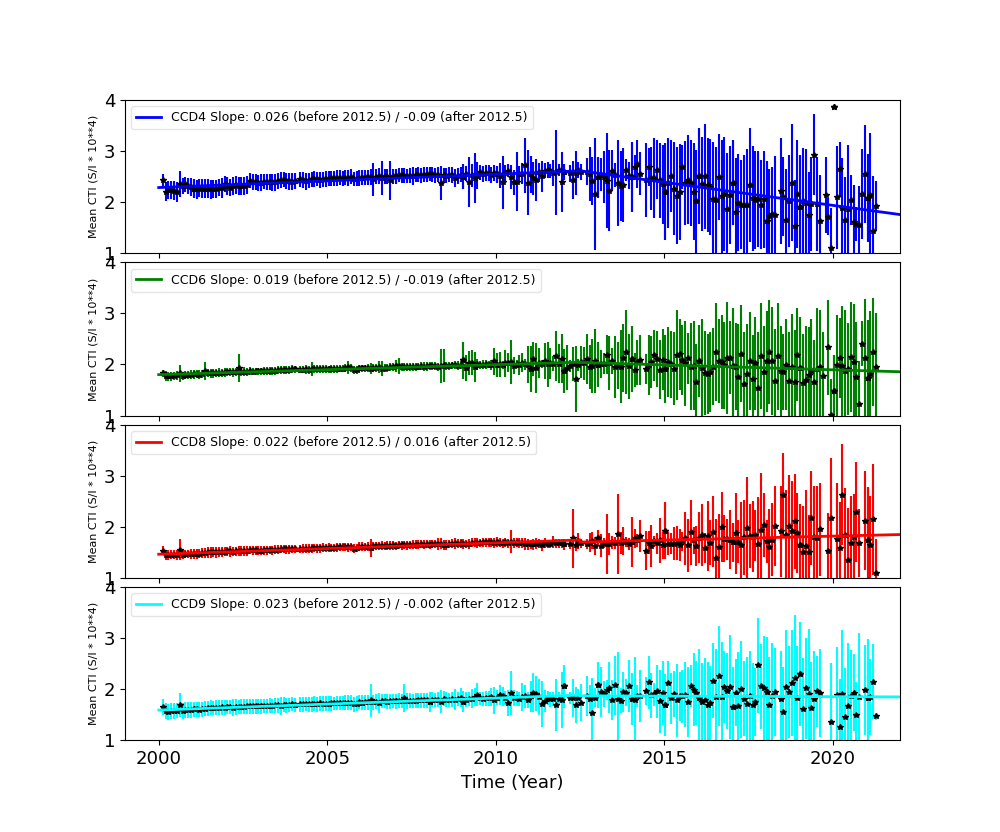
Backside CCDs
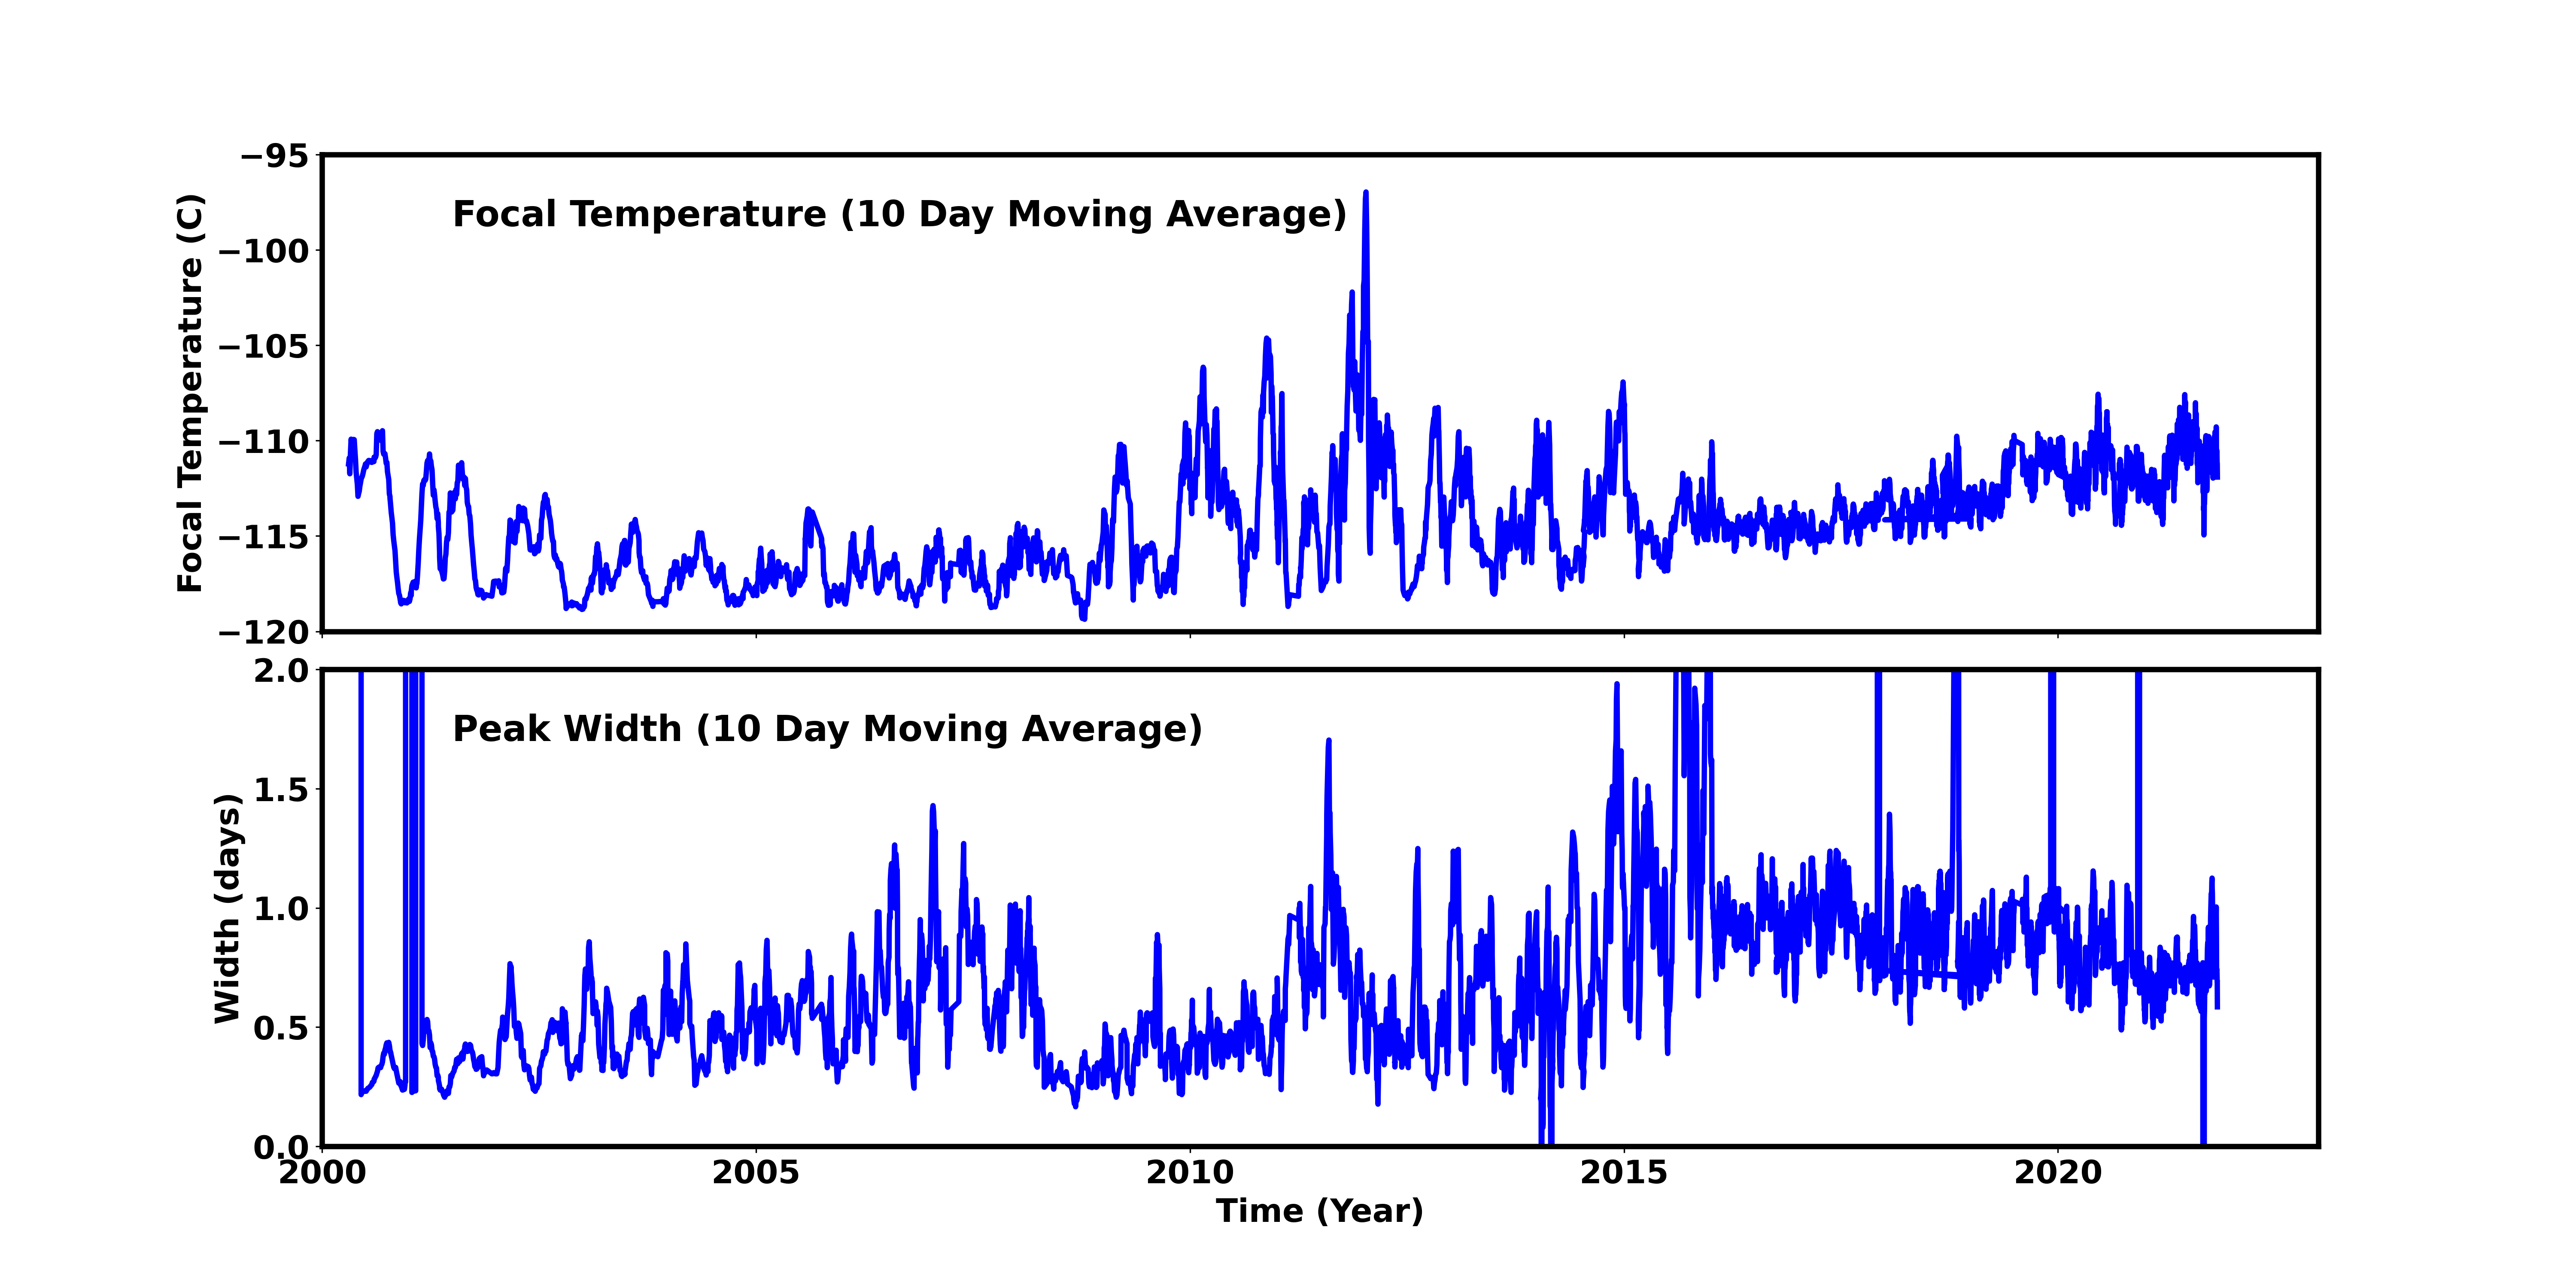
Focal Plane Temperature
Oct 2021 Focal Temperature
| The Mean (max) FPT: | |
|---|---|
| -111.03 | +/- 4.77 C |
| Mean Width: | |
| 0.86 | +/- 0.49 days |
Averaged Focal Plane Temperature
We are using 10 period moving averages to show trends of peak temperatures and peak widths. Note, the gaps in the width plot are due to missing/corrupted data.
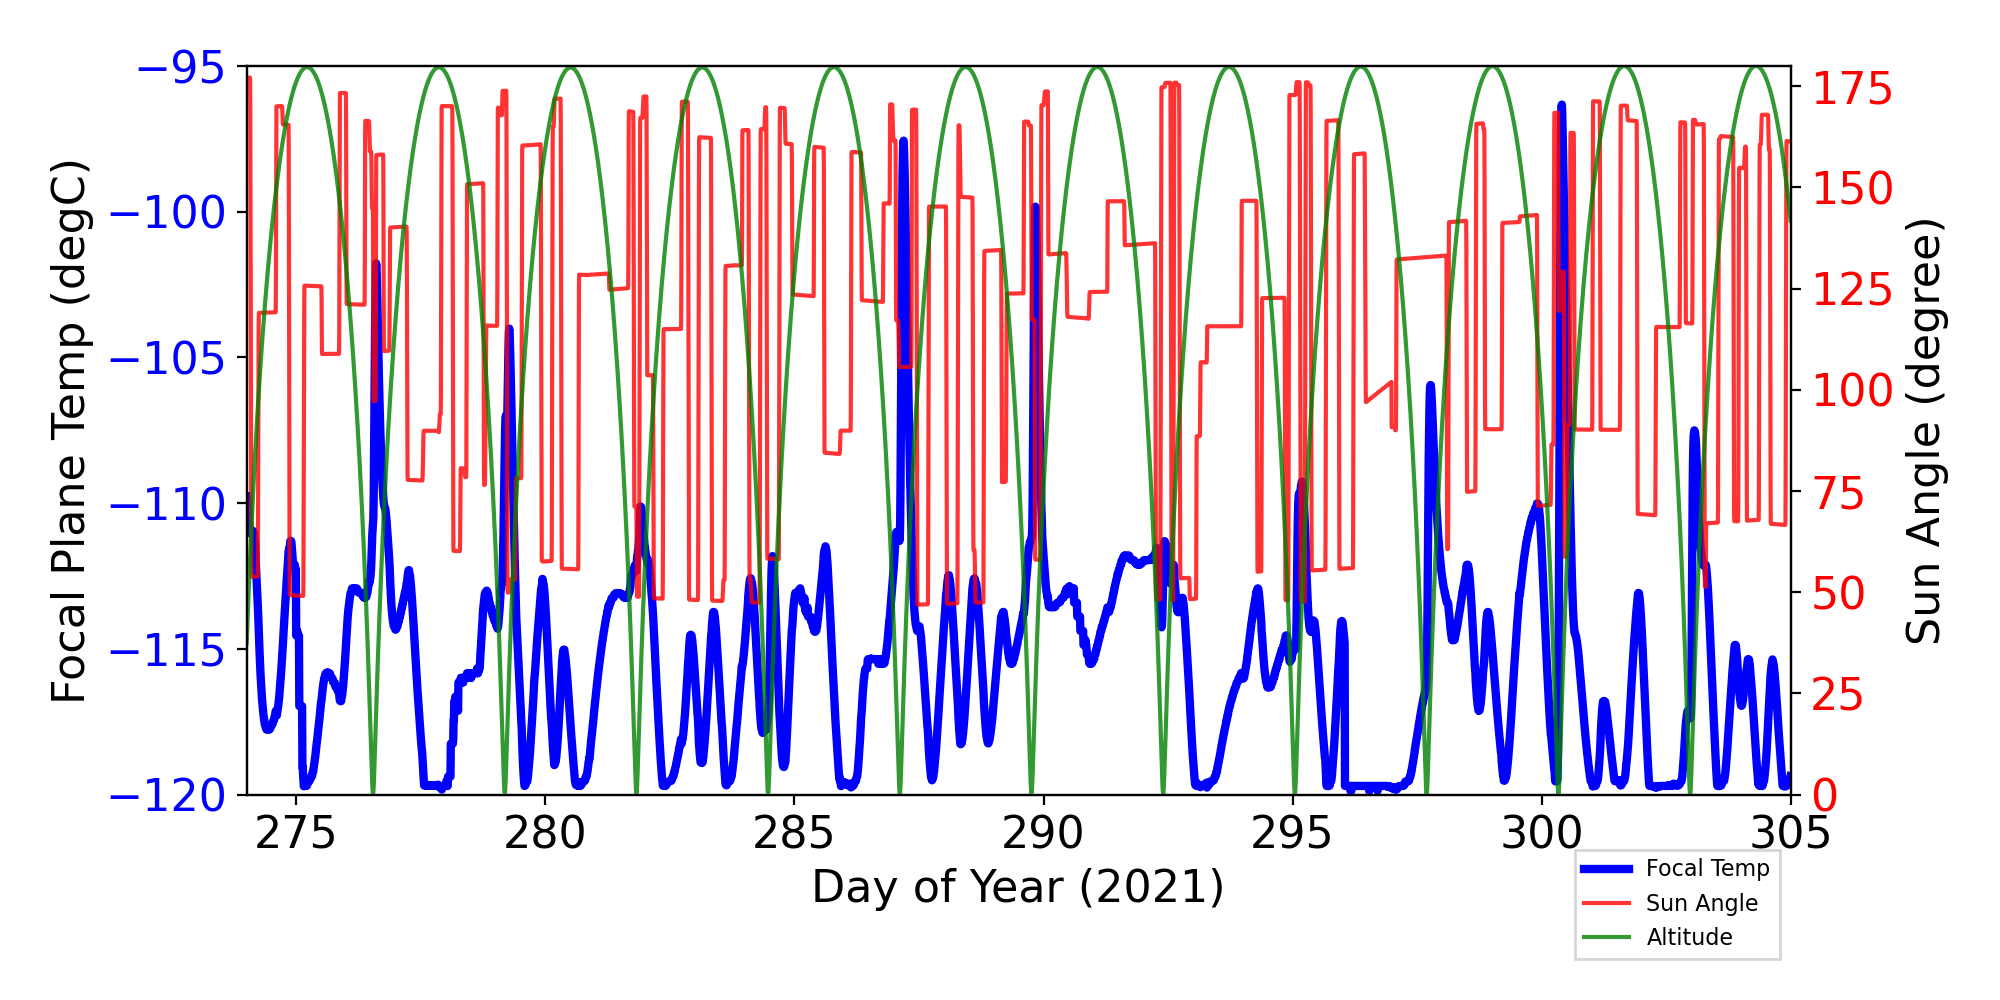
Focal Plane Temperature, Sun Angle and Altitude
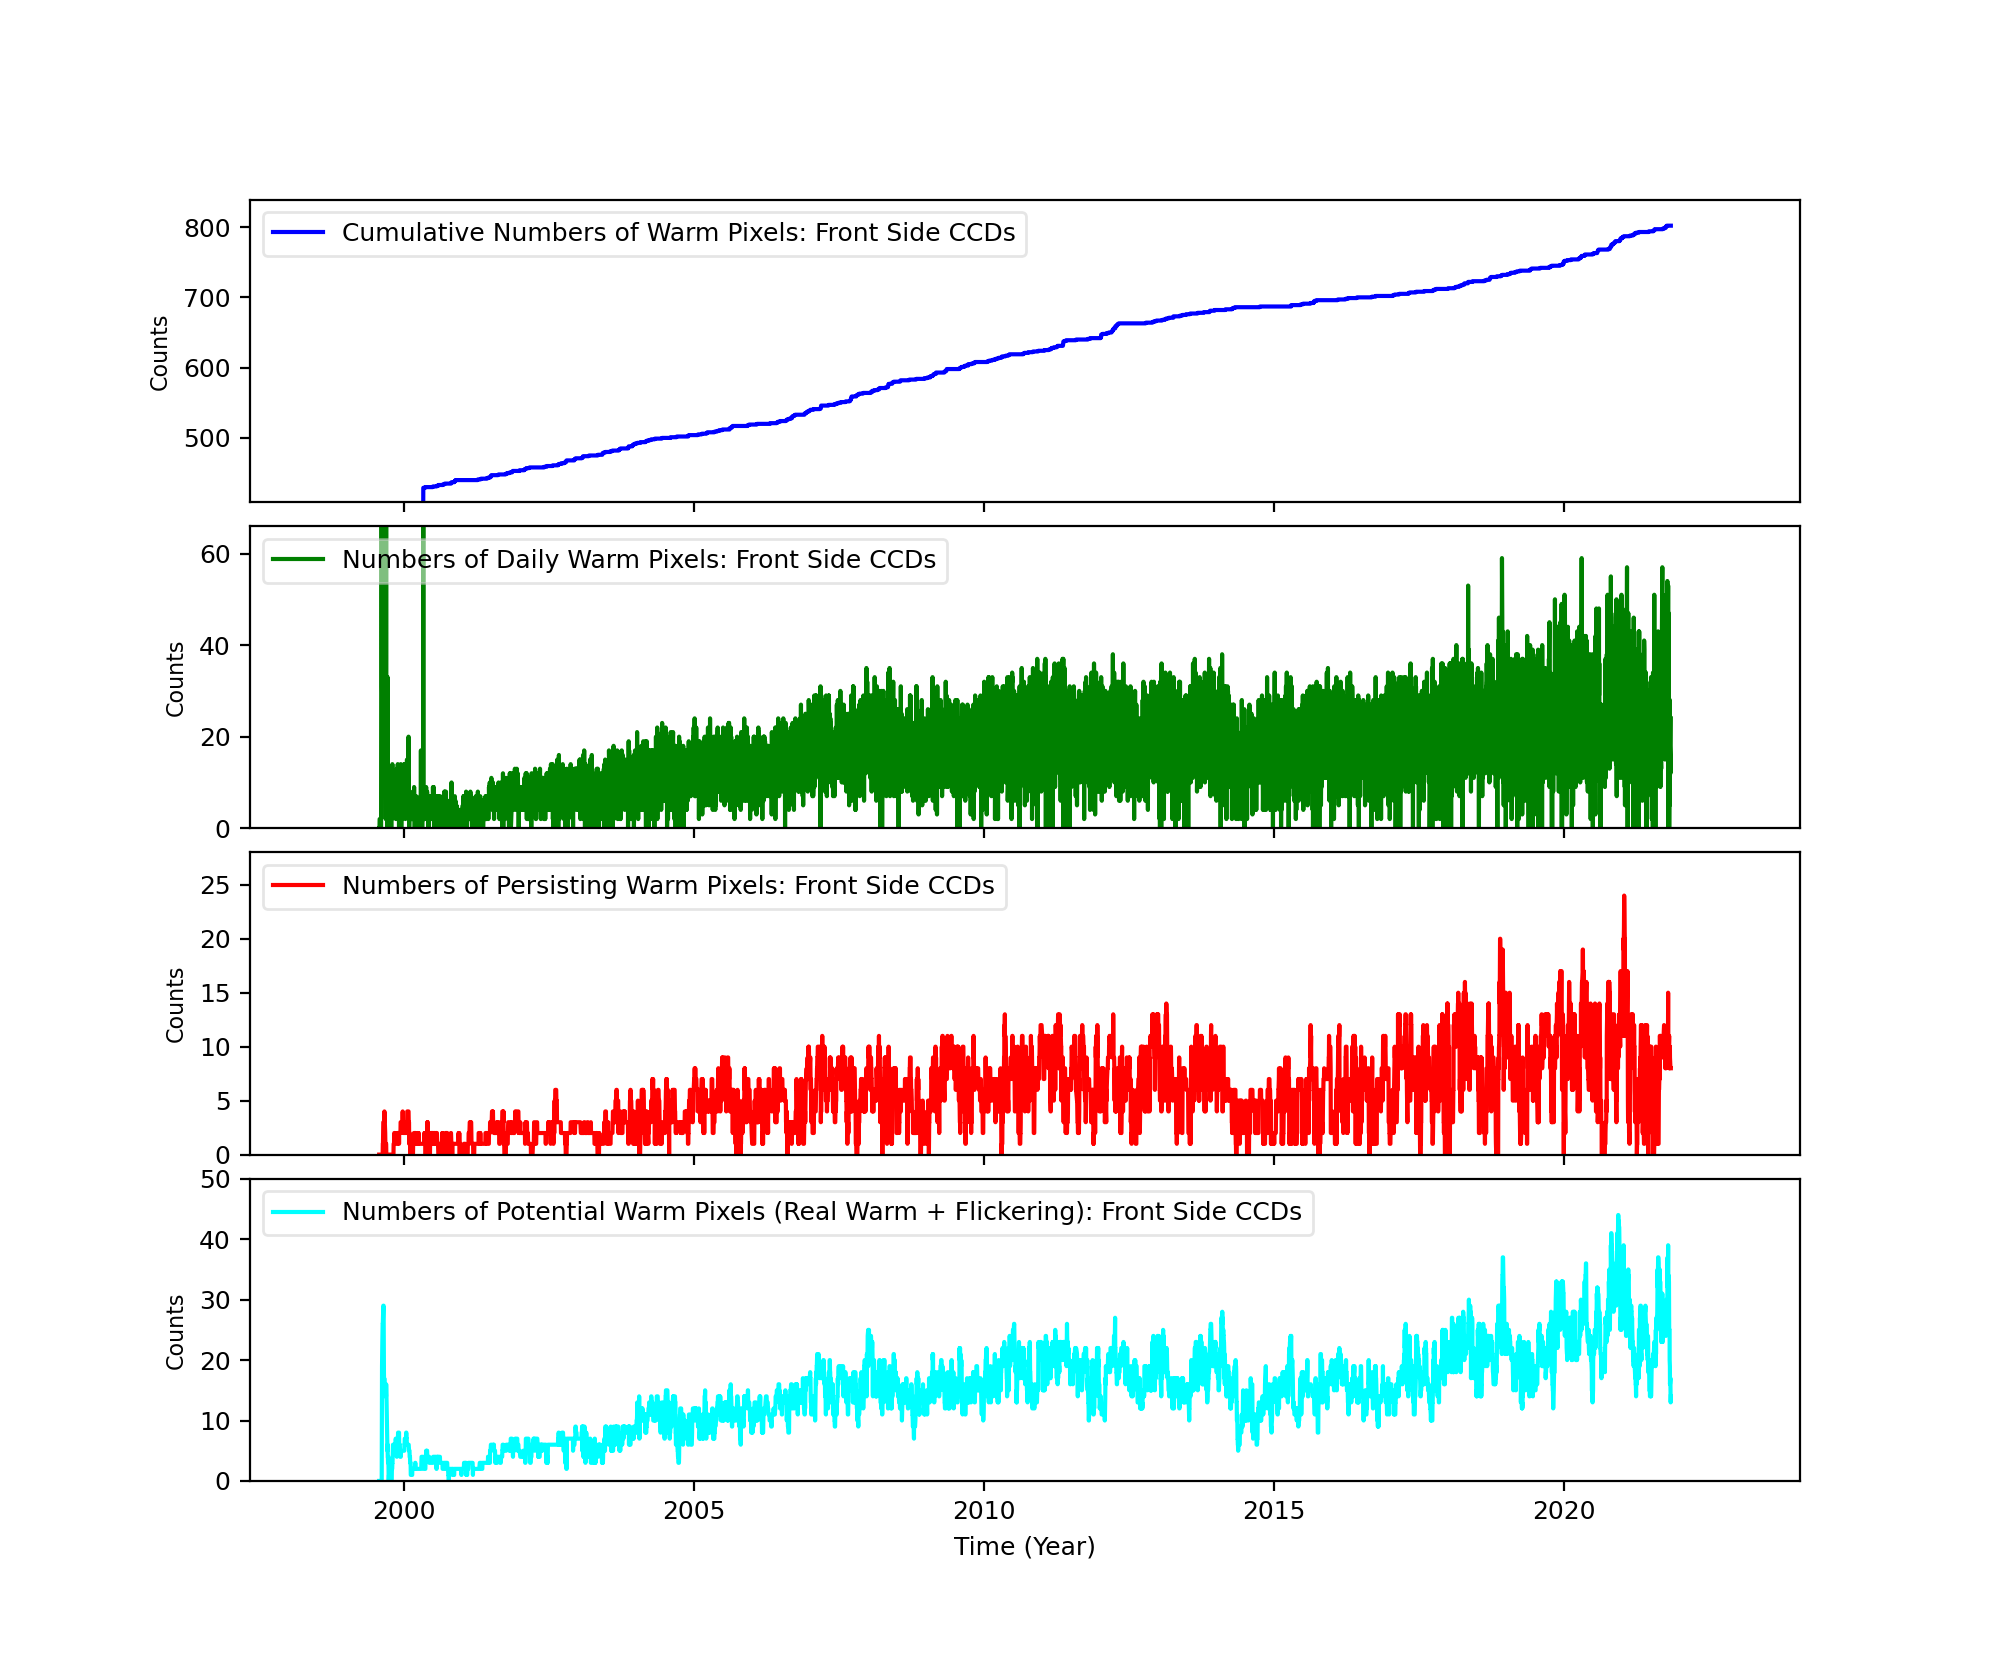
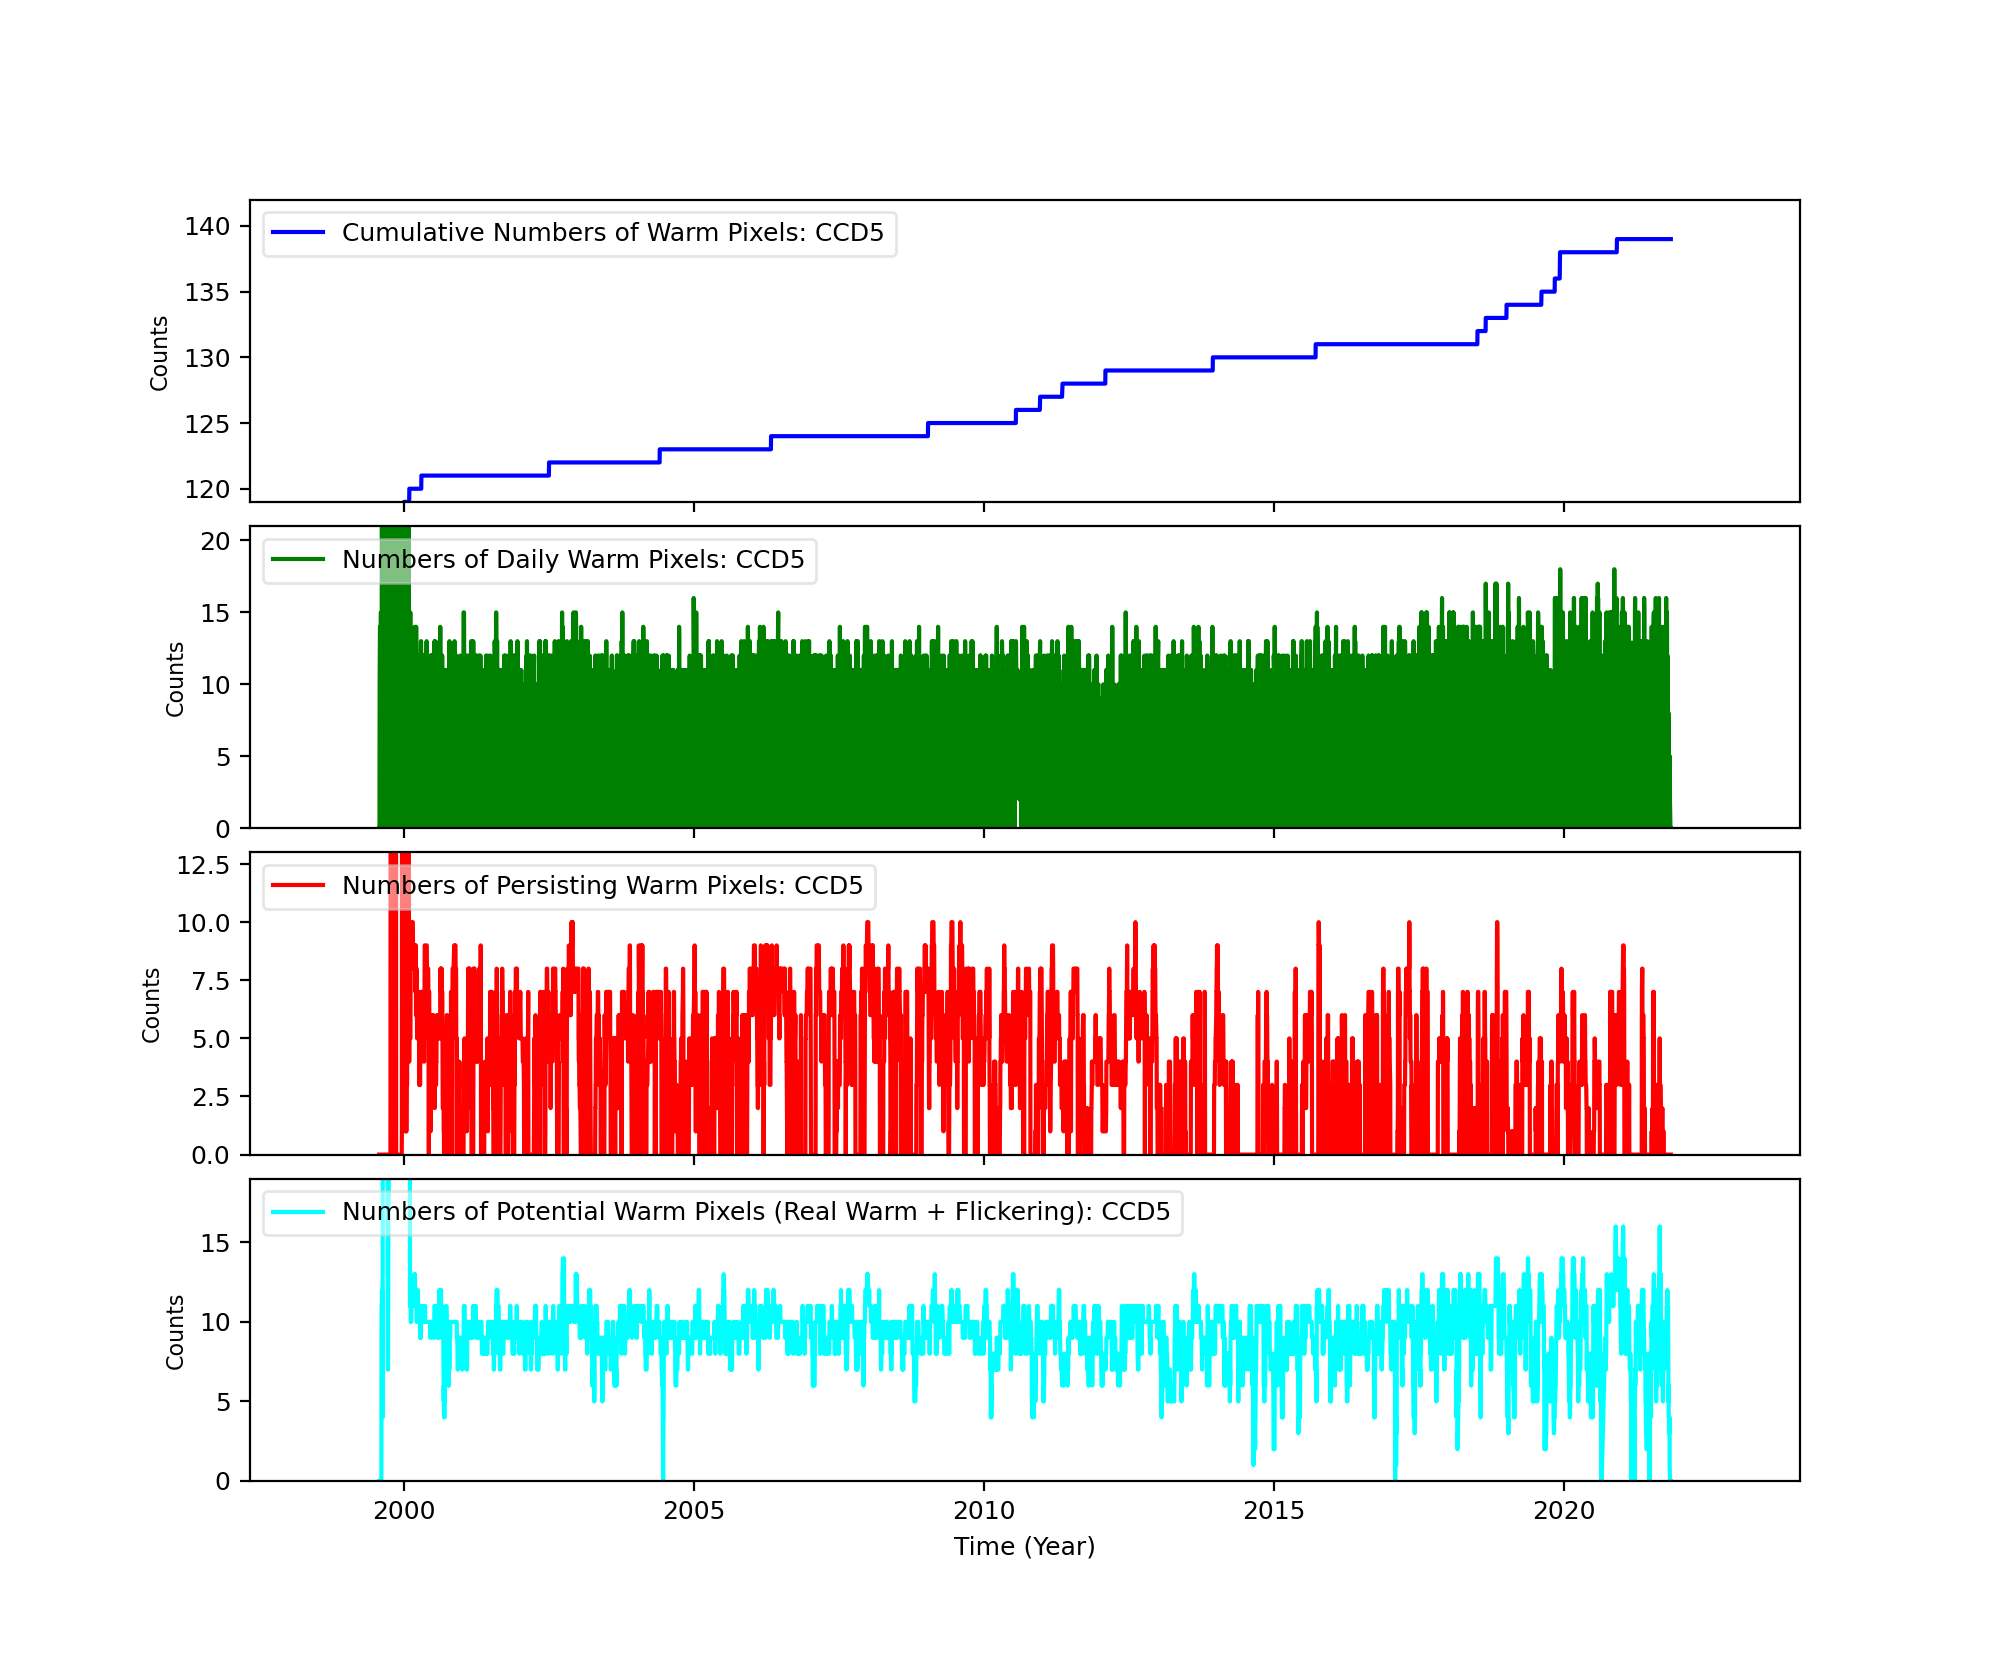
Bad Pixels
The plots below were generated with a new warm pixel finding script. Please see Acis Bad Pixel Page for details.
Front Side CCDs
Back Side CCD (CCD5)
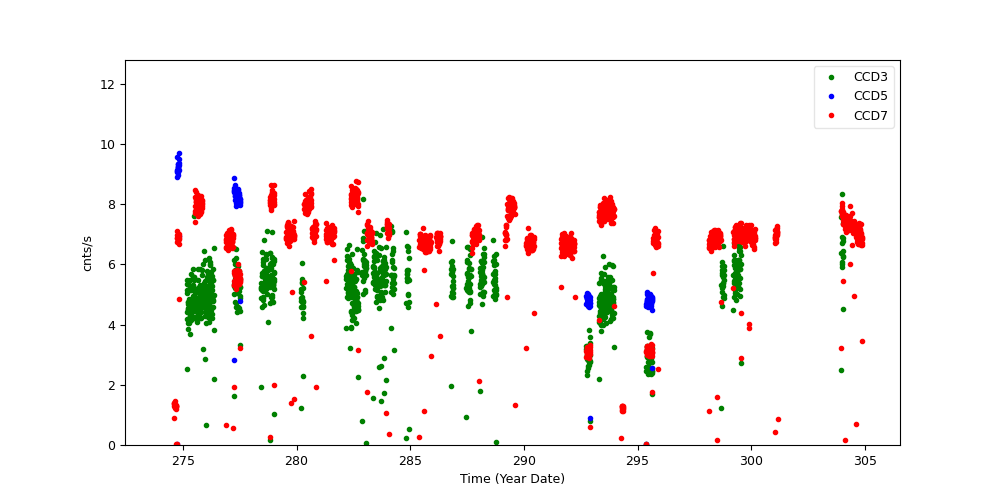
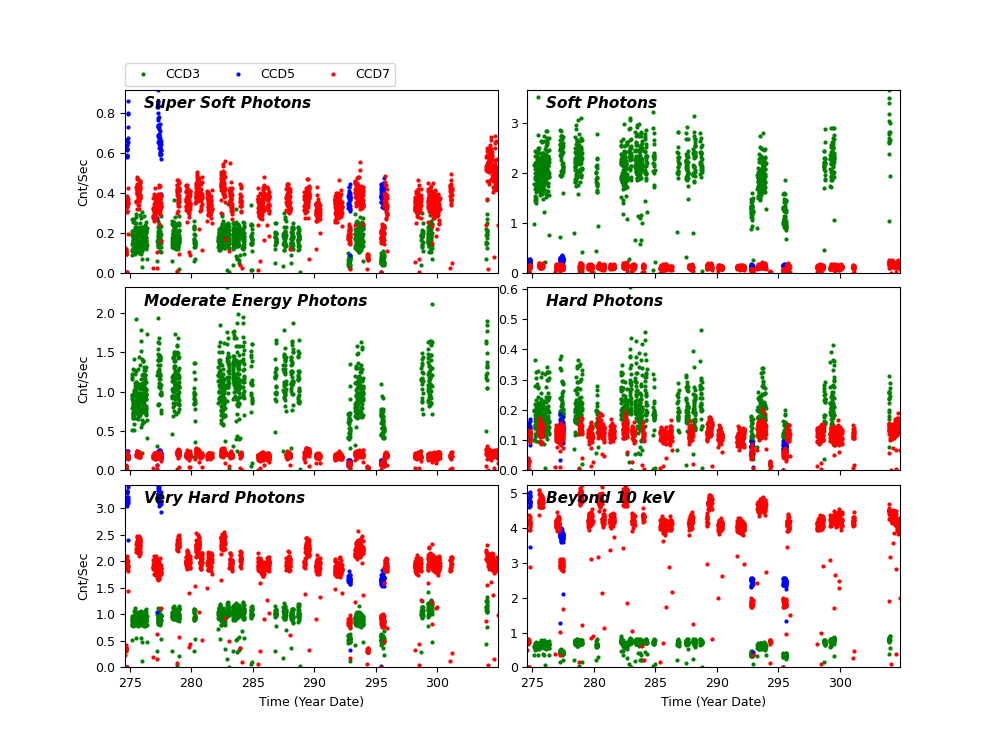
Science Instrument Background Rates
| Name | Low (keV) | High(KeV) | Description |
|---|---|---|---|
| SSoft | 0.00 | 0.50 | Super soft photons |
| Soft | 0.50 | 1.00 | Soft photons |
| Med | 1.00 | 3.00 | Moderate energy photons |
| Hard | 3.00 | 5.00 | Hard Photons |
| Harder | 5.00 | 10.00 | Very Hard photons |
| Hardest | 10.00 | Beyond 10 keV |
HRC
DOSE of Central 4K Pore-Pairs
Please refer to Maximum Dose Trends for more details.
)
|
|---|
IMAGE                NPIX      MEAN    STDDEV      MIN       MAX
HRCI_10_2021.fits  16777216	0.167 	0.413 	0.000 	7.000
)
IMAGE                       NPIX      MEAN    STDDEV      MIN       MAX
HRCI_08_1999_10_2021.fits  16777216	7.598 	6.552 	0.000 	314.000
)
|
|---|
IMAGE                NPIX      MEAN    STDDEV      MIN       MAX
HRCS_10_2021.fits  16777216	0.012 	0.113 	0.000 	4.000
)
IMAGE                       NPIX      MEAN    STDDEV      MIN       MAX
HRCS_08_1999_10_2021.fits  16777216	20.669 	36.617 	0.000 	1766.000
|
|
Max dose trend plots corrected for events that "pile-up"
in the center of the taps due to bad position information.
|
)
|
)
|
)
|
)
|
| Jul 2021 | Apr 2021 | Jan 2021 | Oct 2020 |
|---|
)
|
)
|
)
|
)
|
| Jul 2021 | Apr 2021 | Jan 2021 | Oct 2020 |
|---|
Gratings
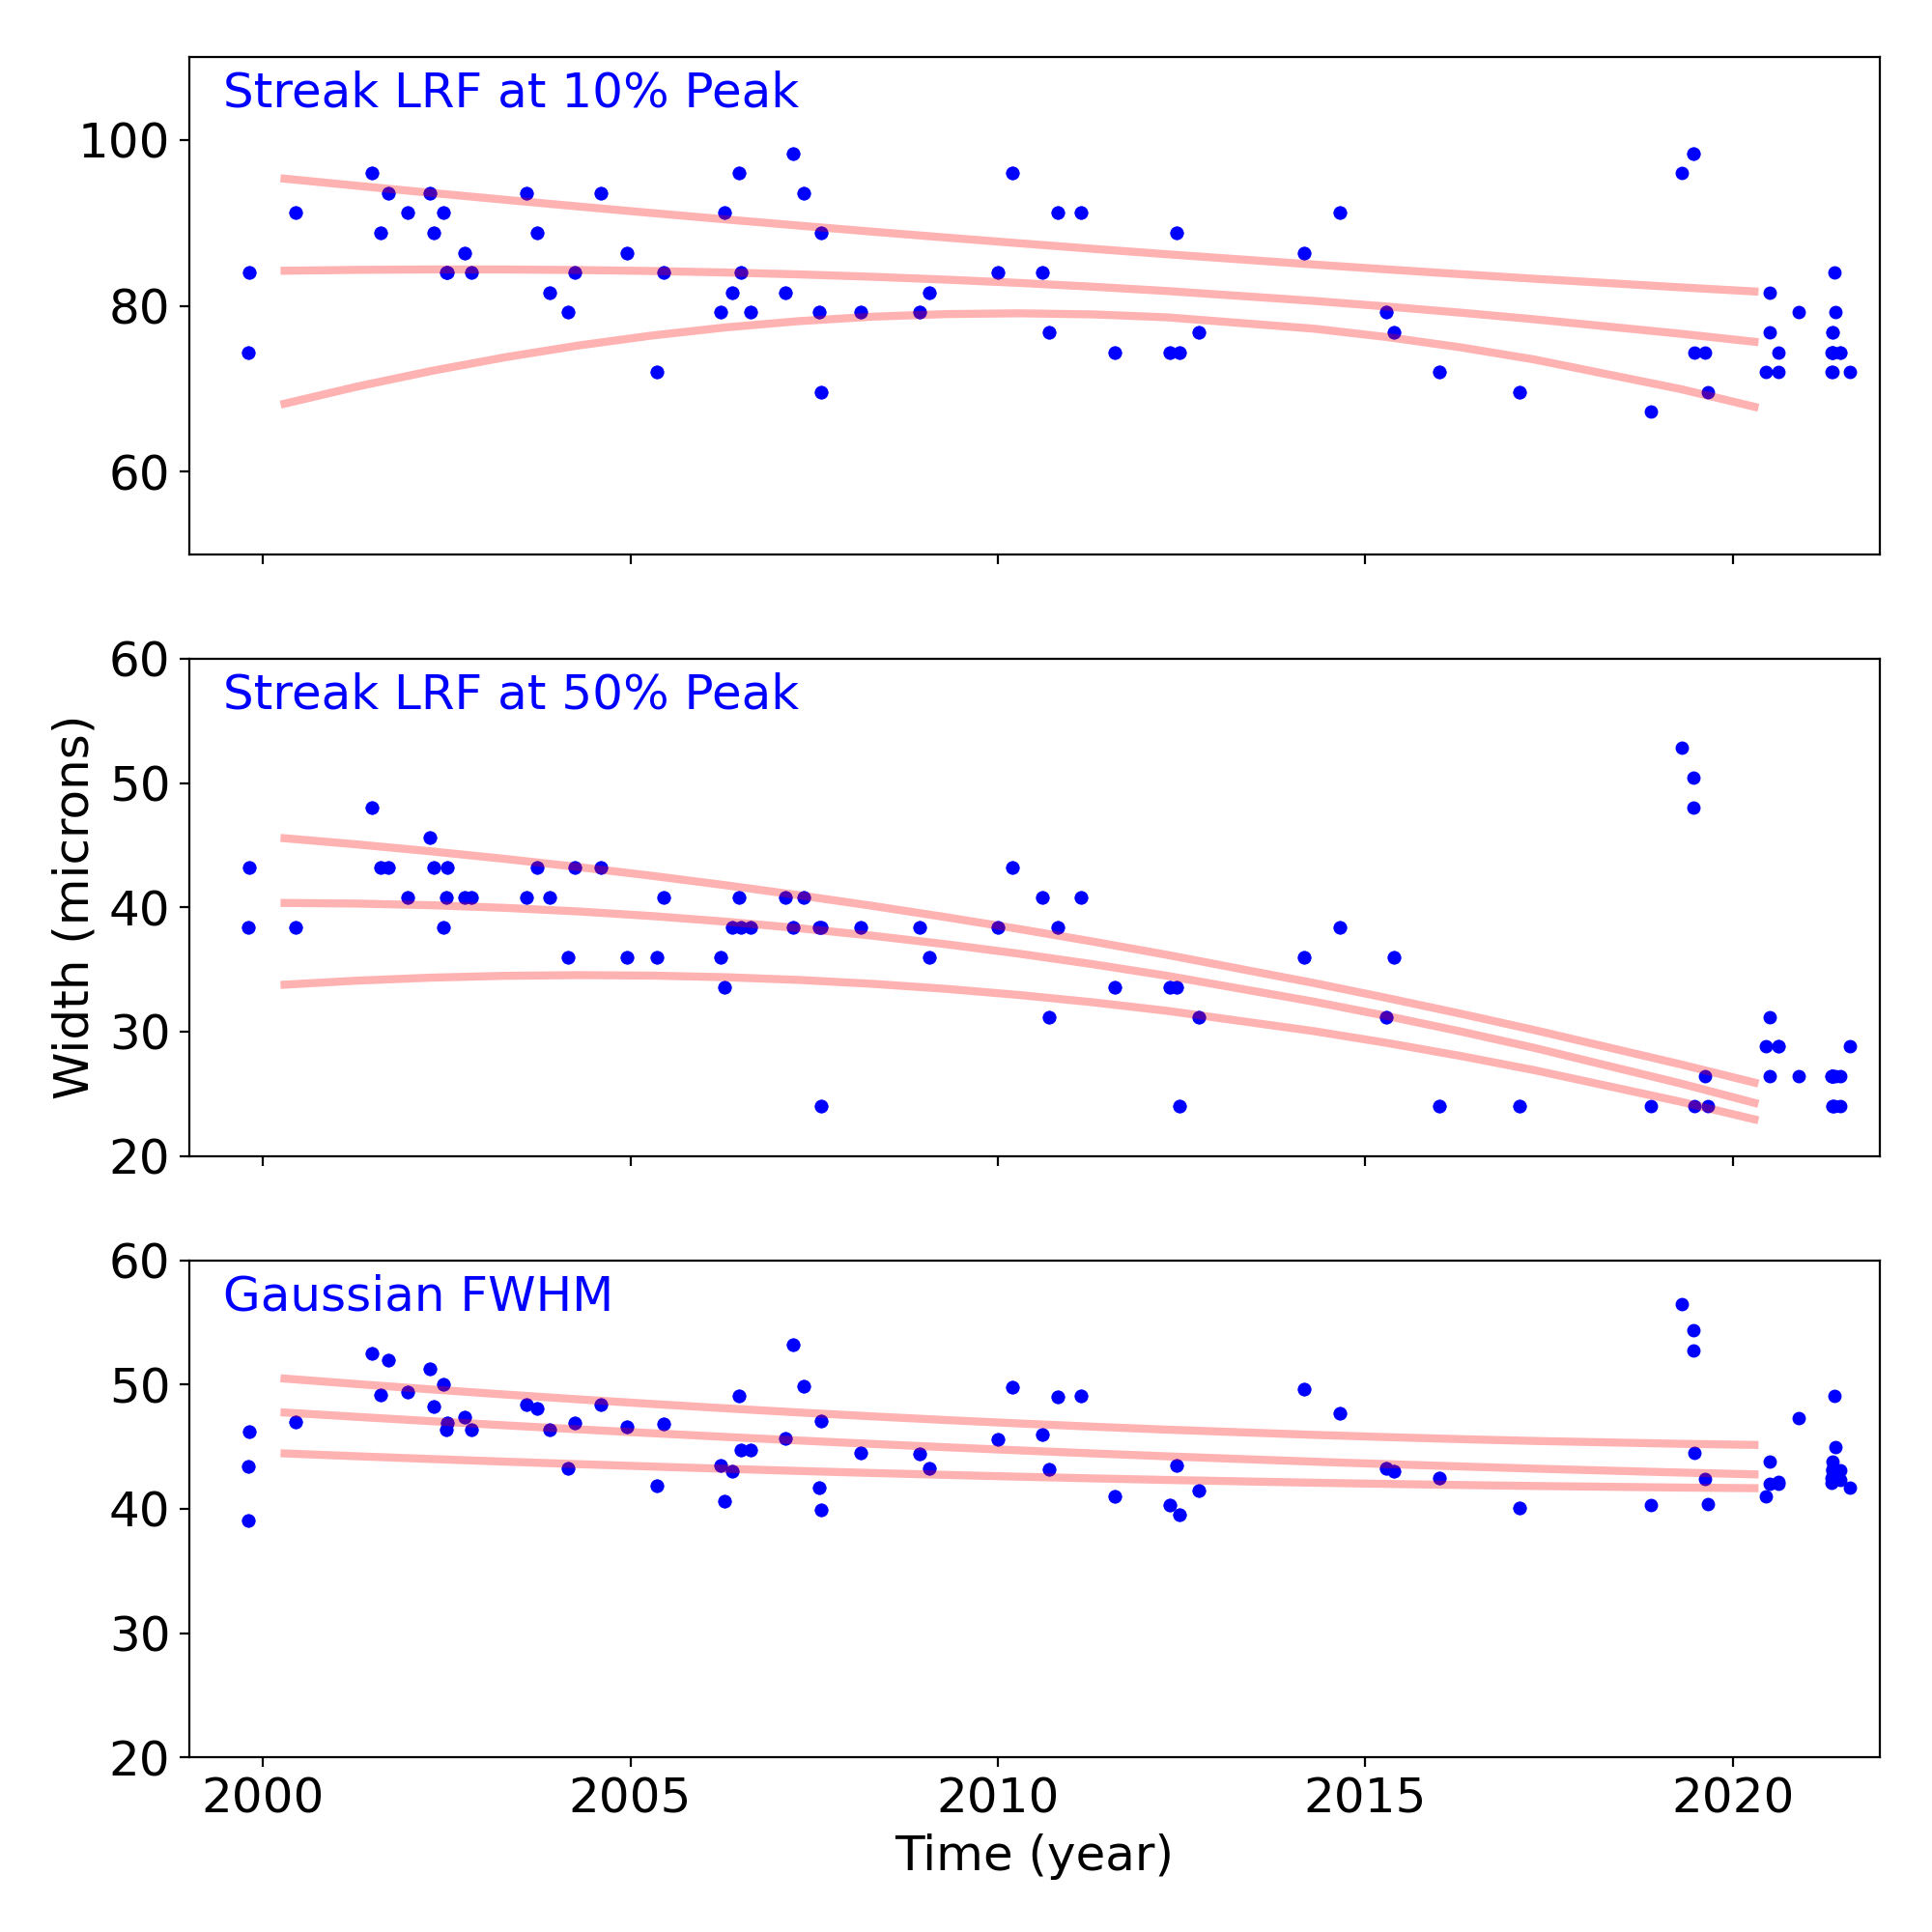
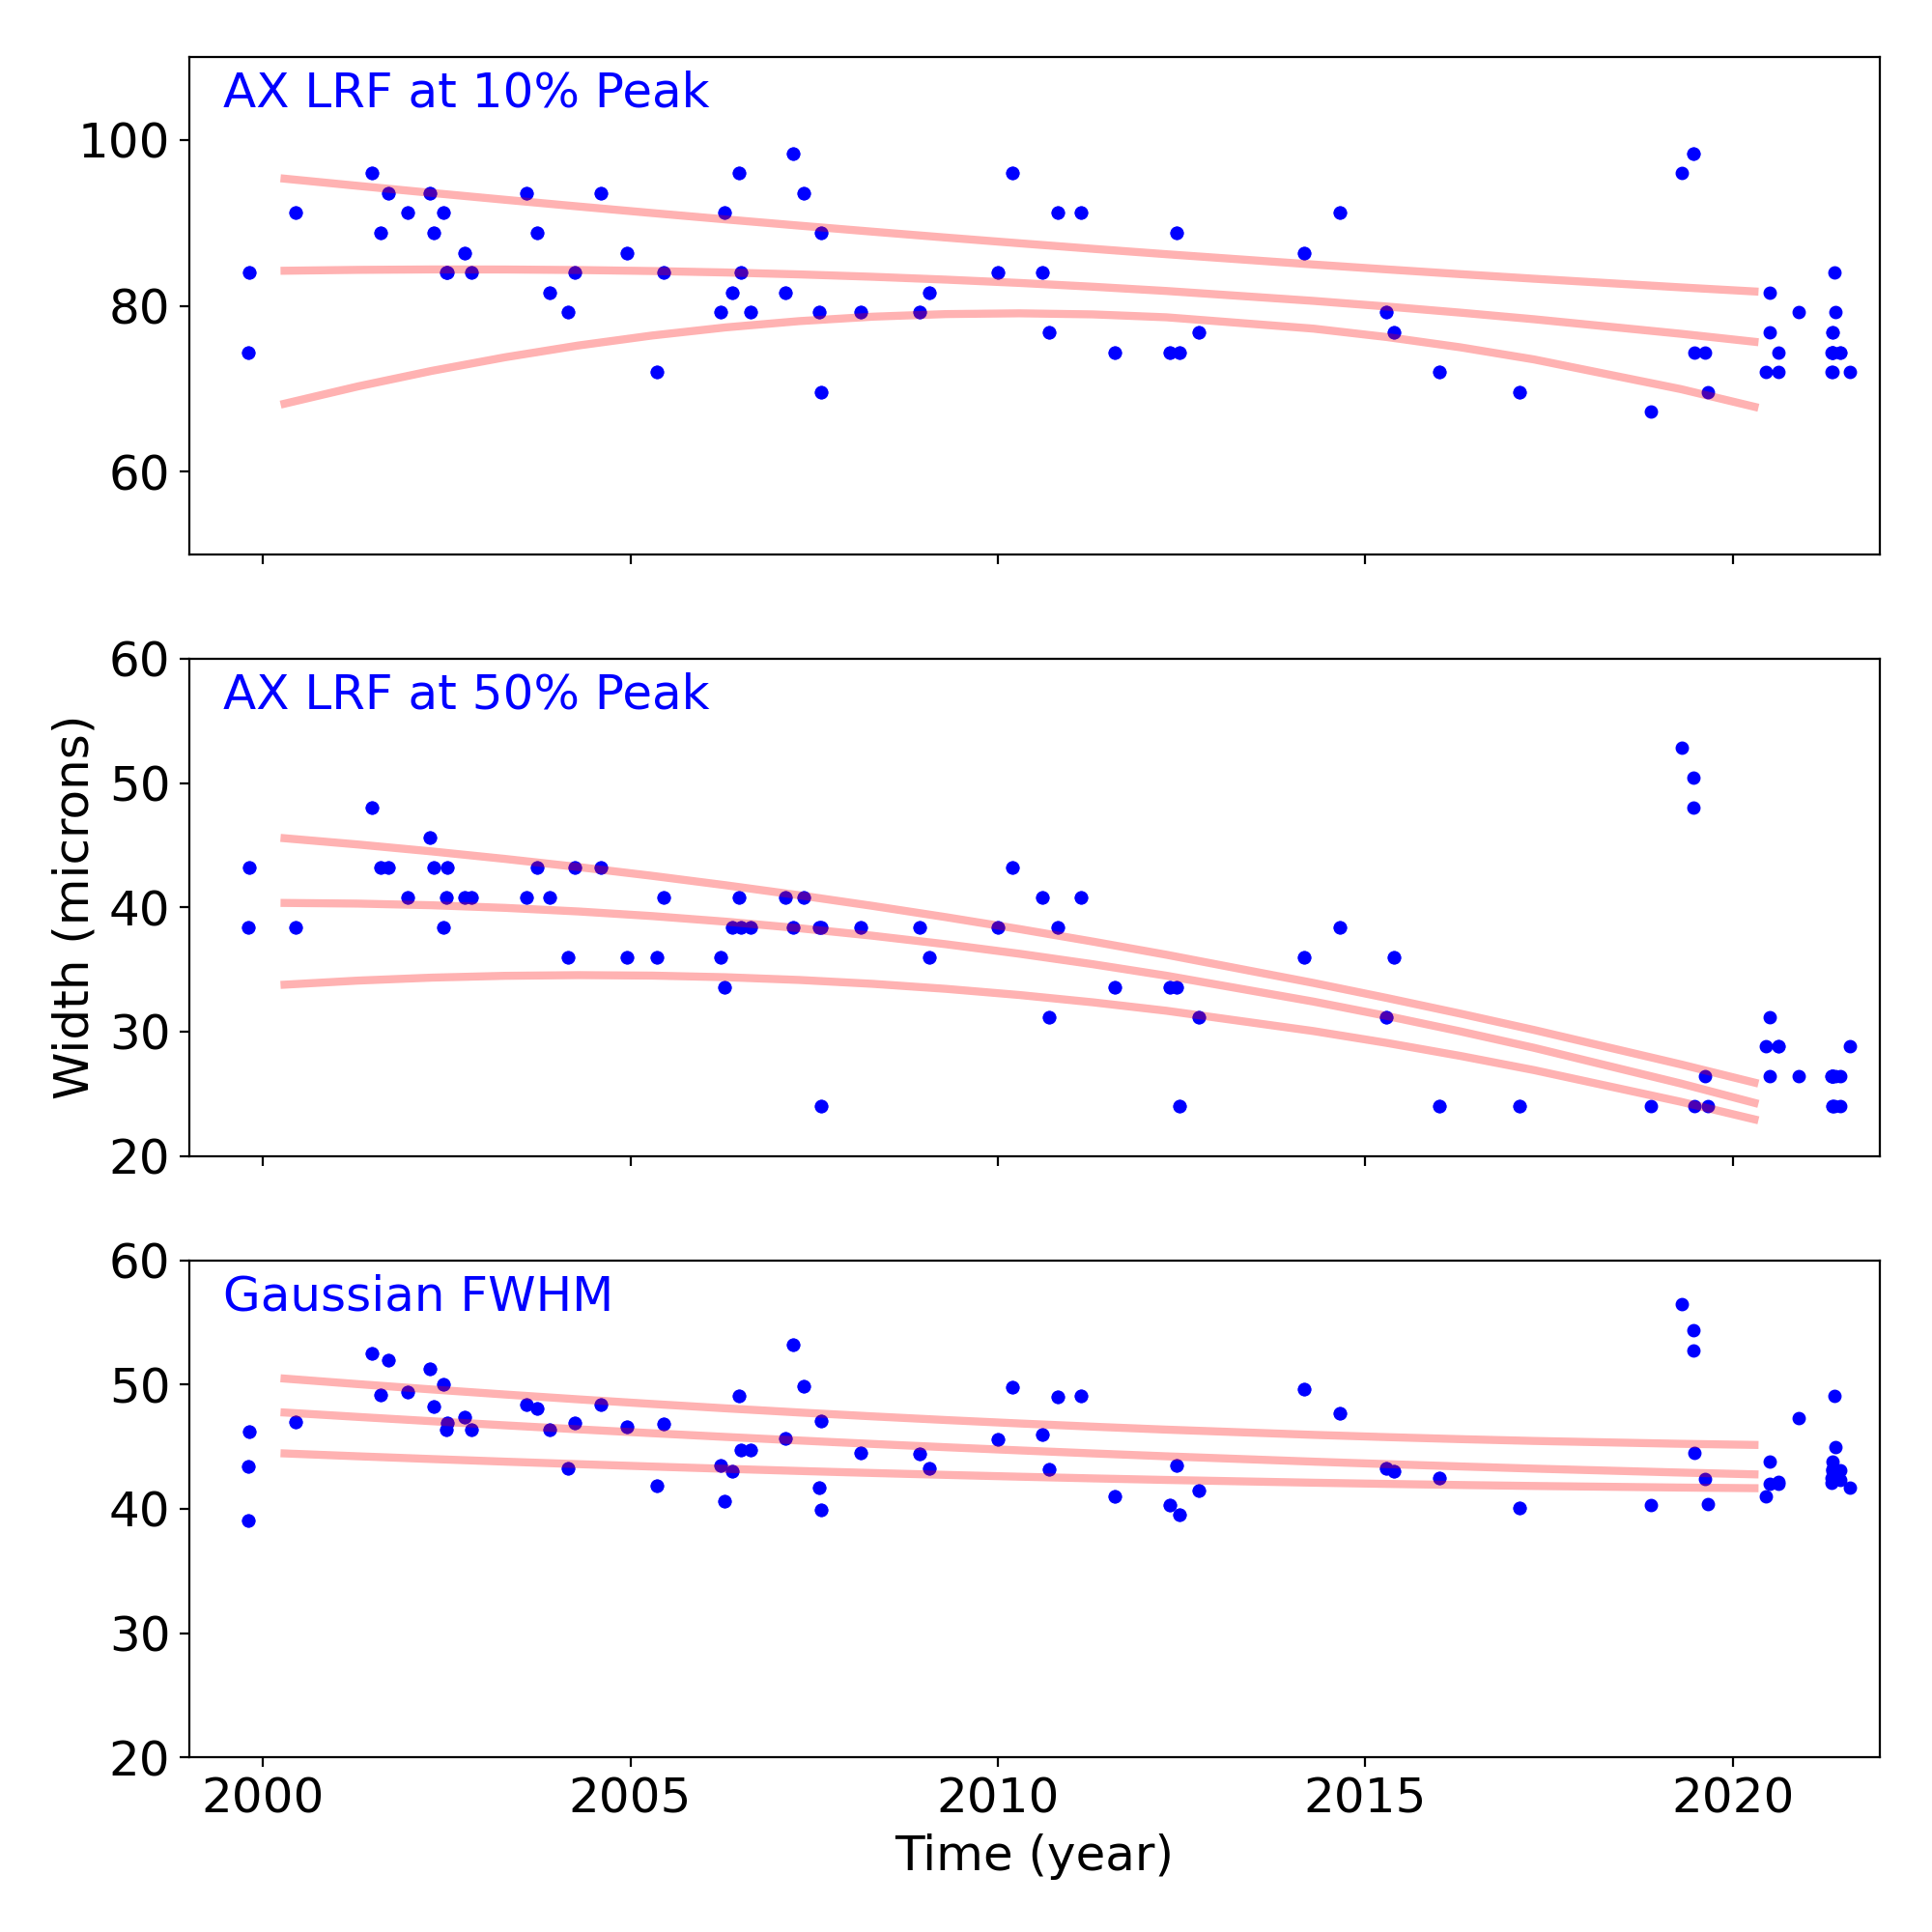
Grating Trends/Focus
We plot the width of the zero order streak of ACIS/HETG observations and the width of the zero order image for HRC/LETG observations of point sources. No significant defocusing trend is seen at this time. See Gratings Trends pages.
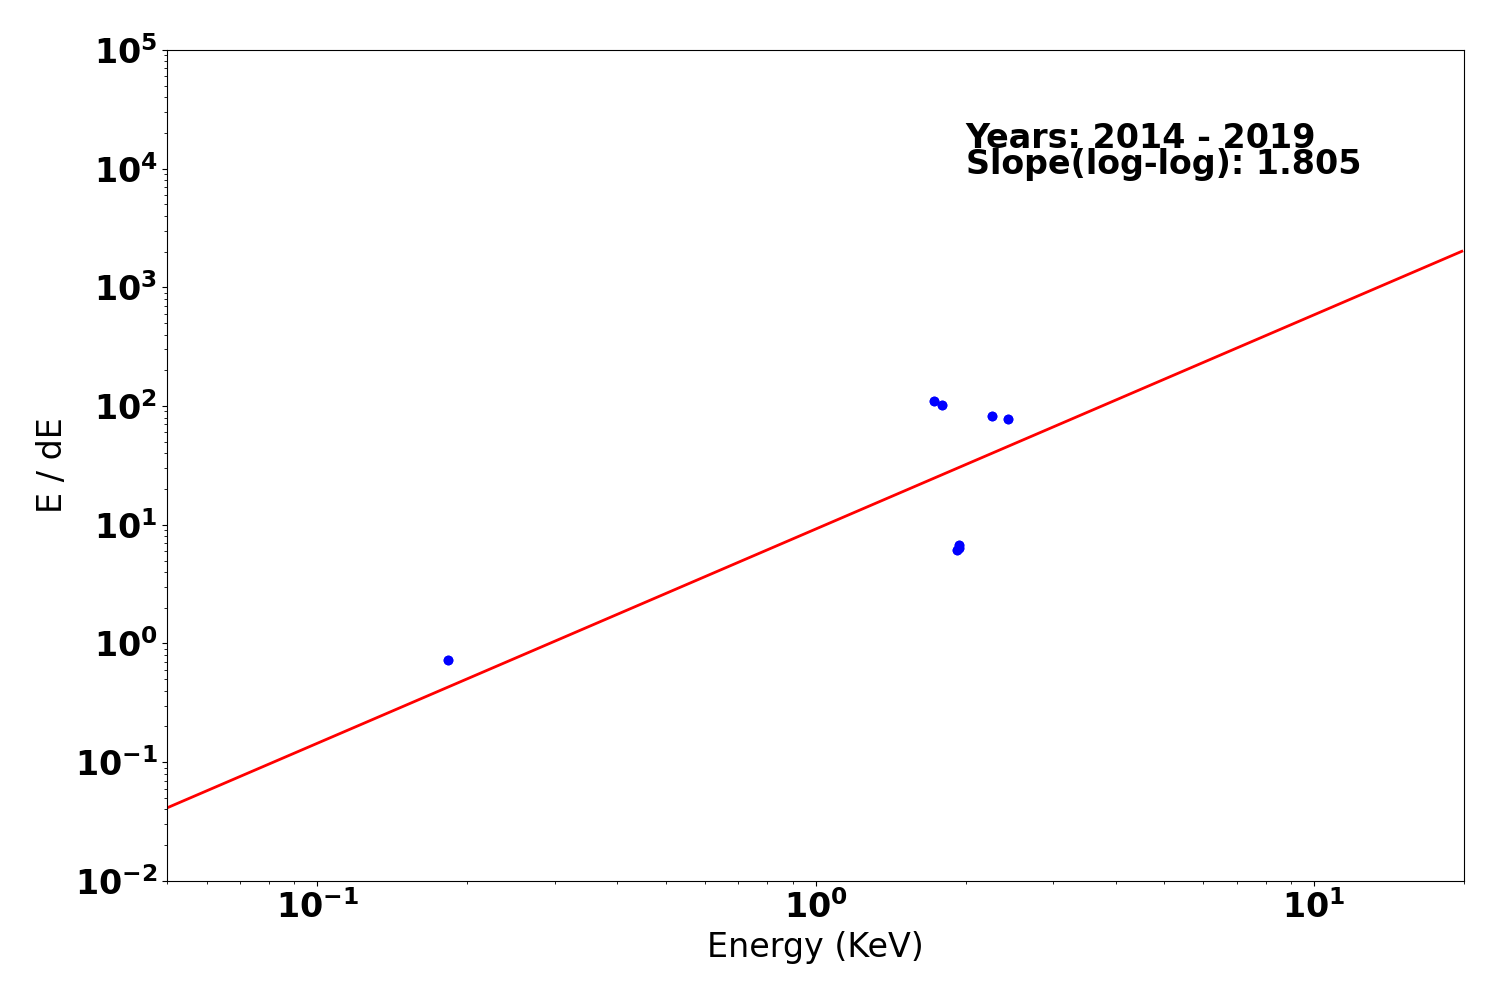
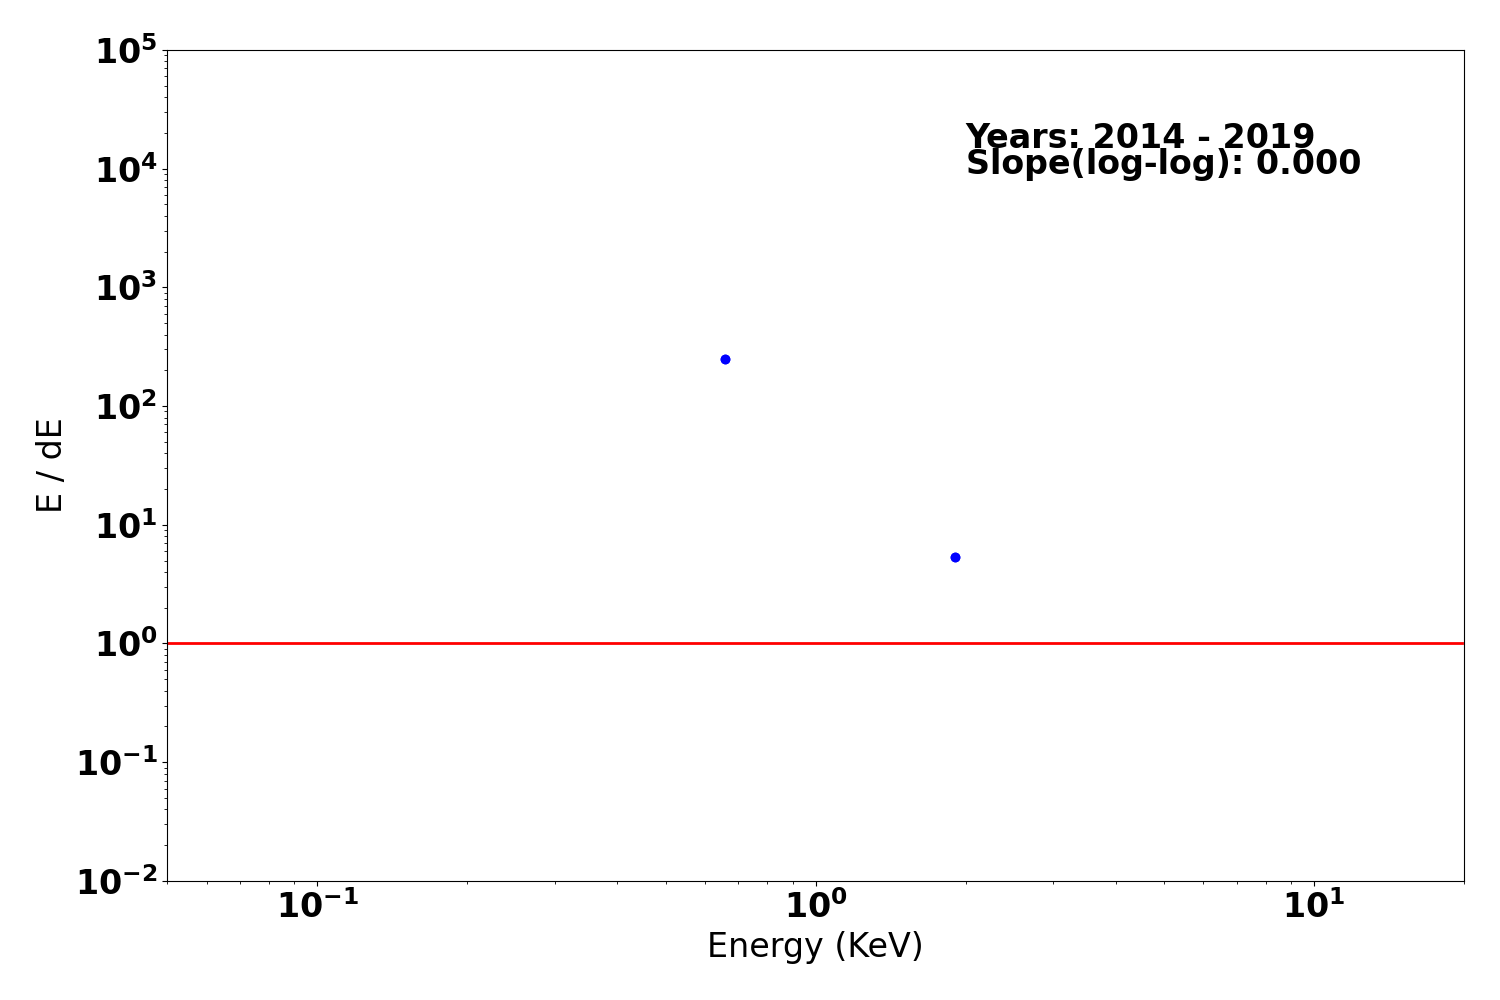
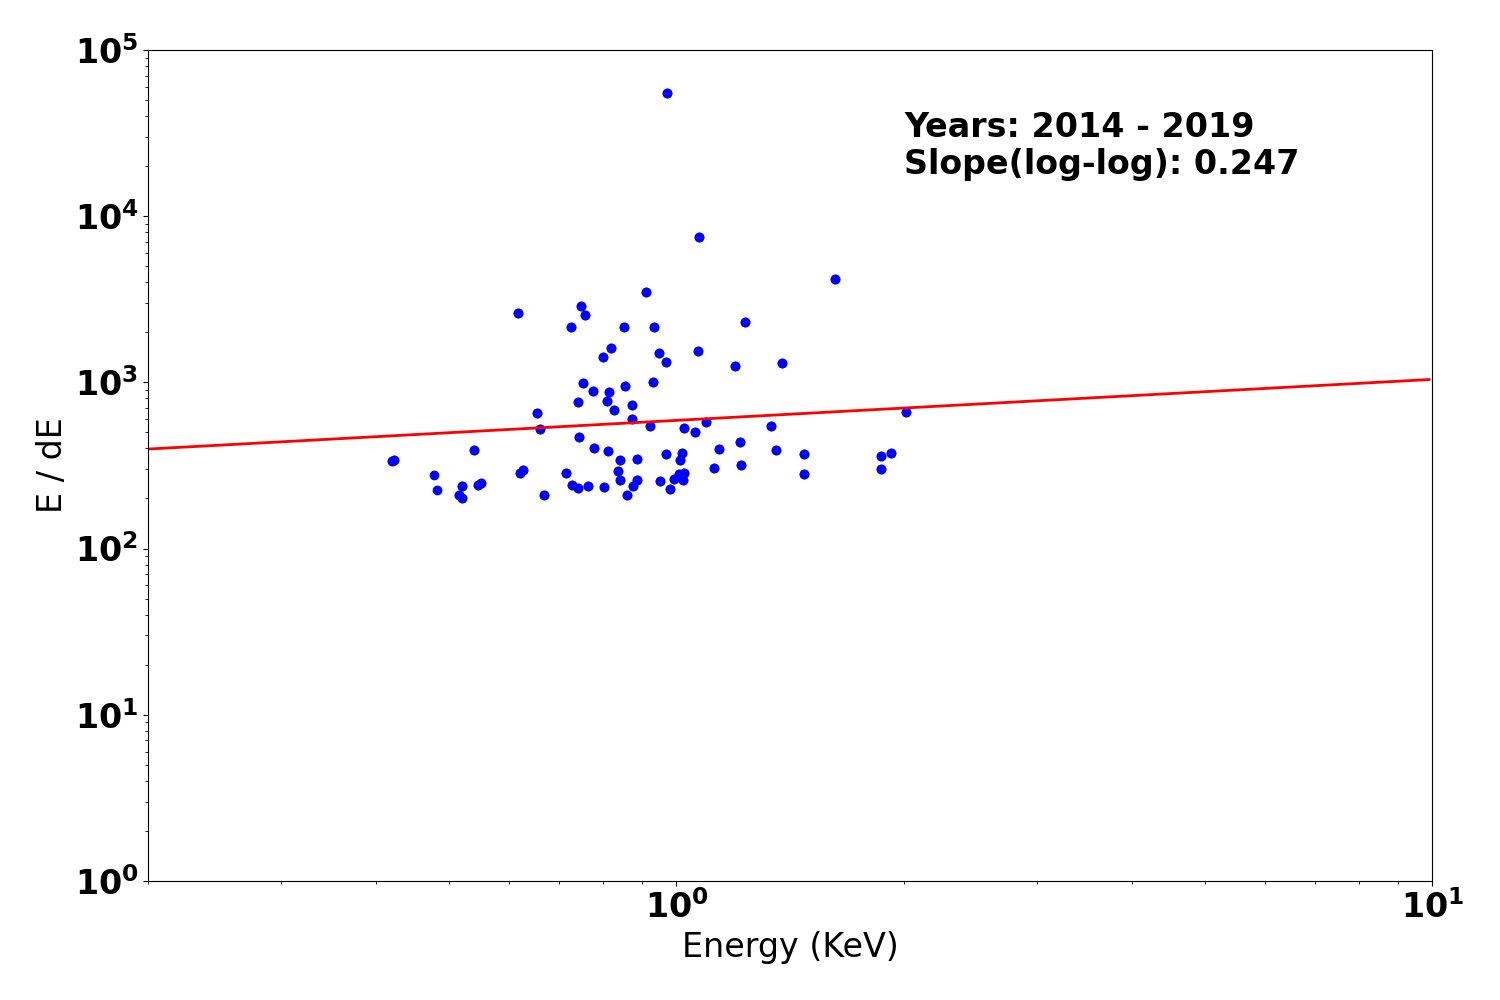
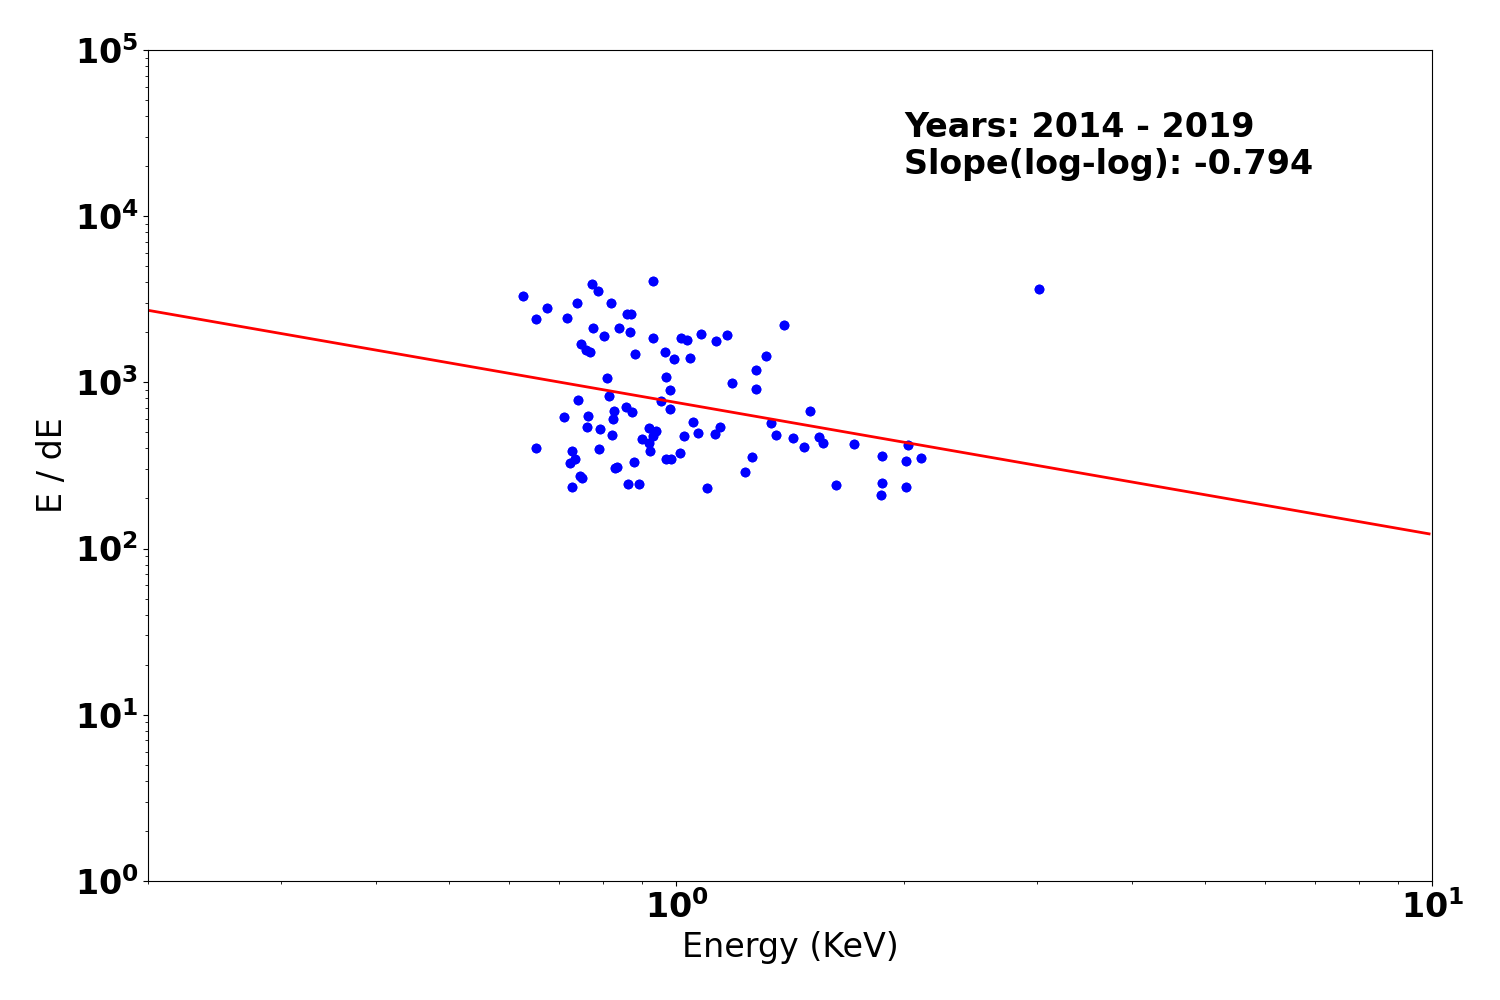
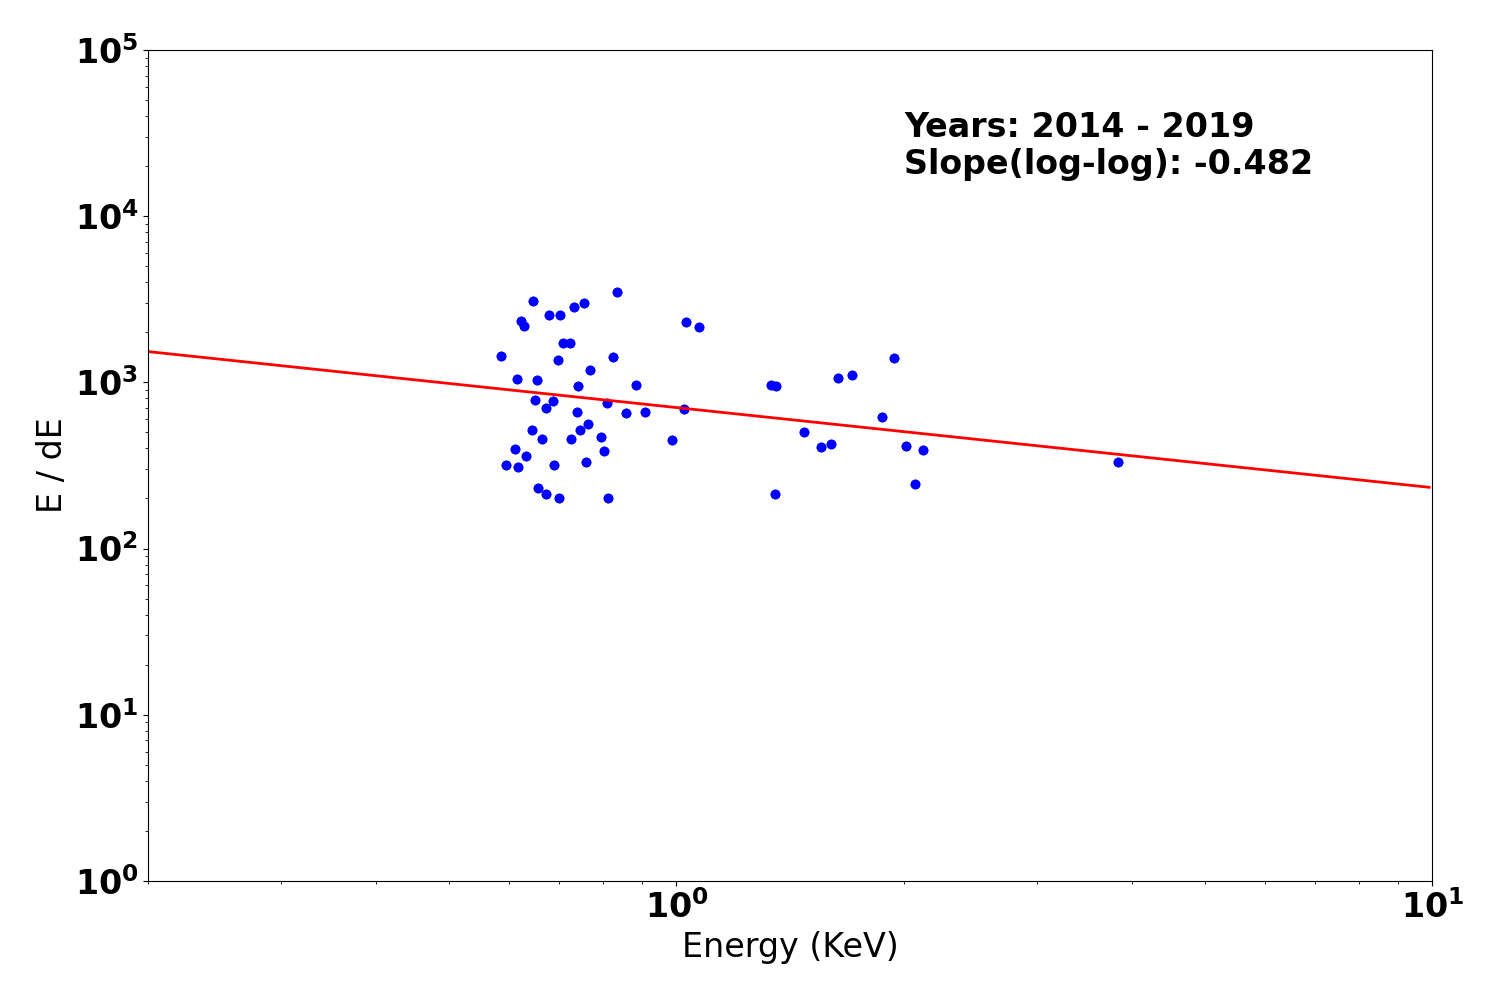
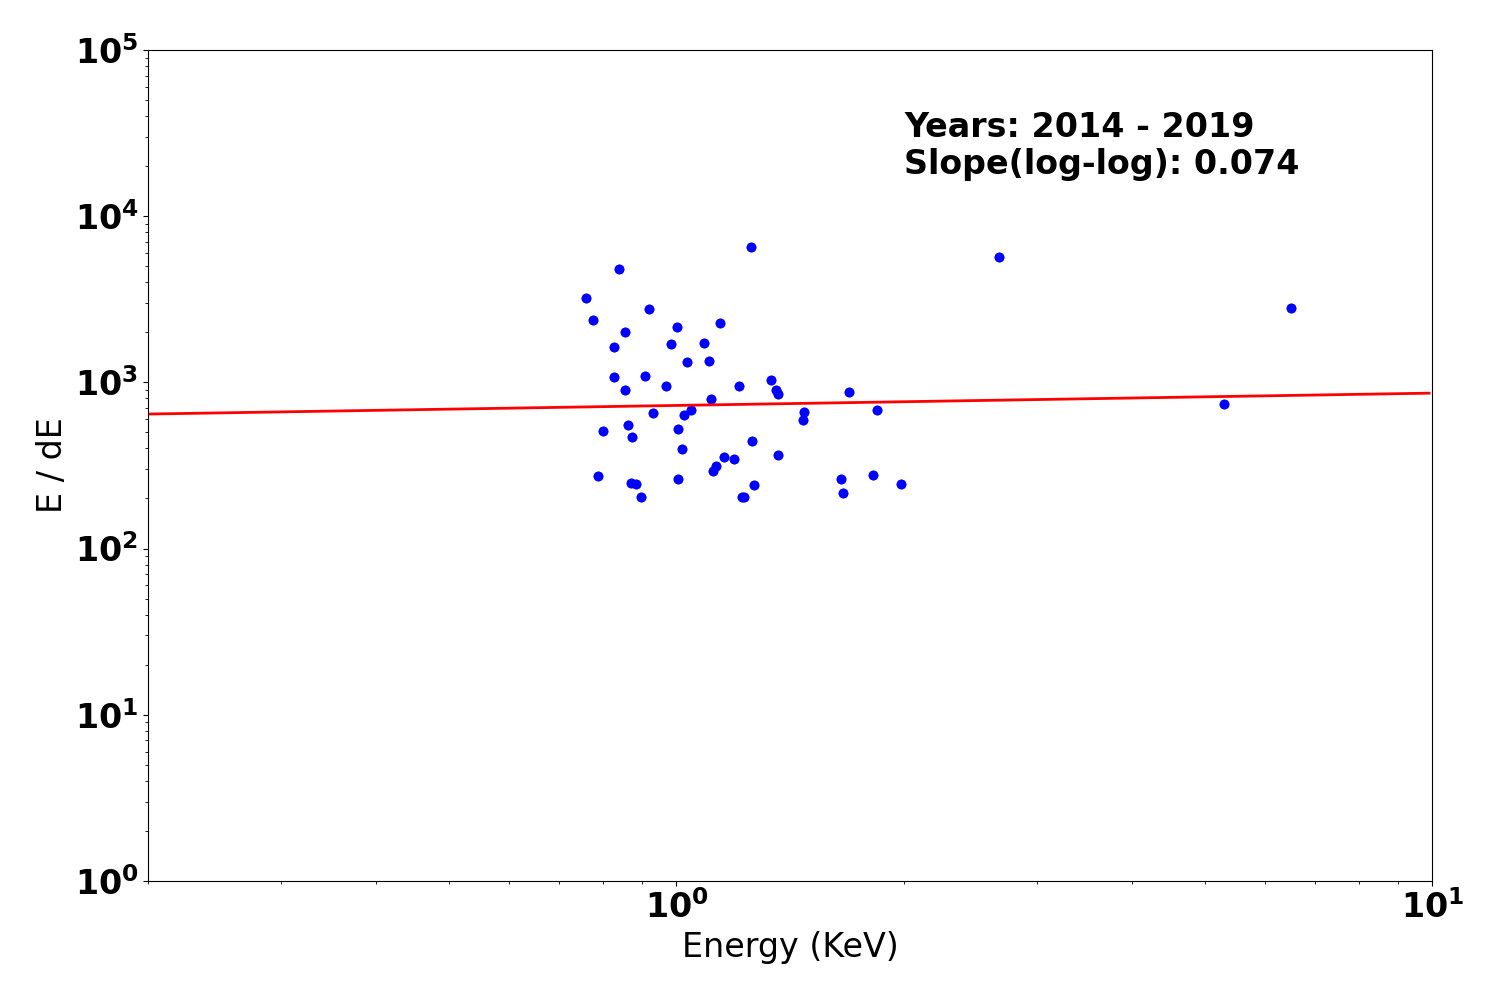
Gratings Resolving Power
We plot E/dE vs. E for fits to detected lines with fwhm_error/fwhm less than 0.15 for the plus and minus arms of HEG, MEG, and LEG. Also shown are conservative (dotted line) and optimistic (dashed line) pre-launch resolving power expectations.
We have selected only calibration observations of Capella, HR1099, and Sigma Gem. See MIT technotes for a parallel analysis.
| Year 2014 - | |
|---|---|
| Letg minus side | Letg plus side |
 |
 |
| Metg minus side | Metg plus side |
 |
 |
| Hetg minus side | Hetg plus side |
 |
 |
PCAD
ACA Trending
| ACIS |
)
|
)
|
)
|
|
|---|---|---|---|---|
)
|
)
|
)
| ||
| HRCI |
)
|
)
|
)
|
)
|
| HRCI |
)
|
)
|
)
|
)
|
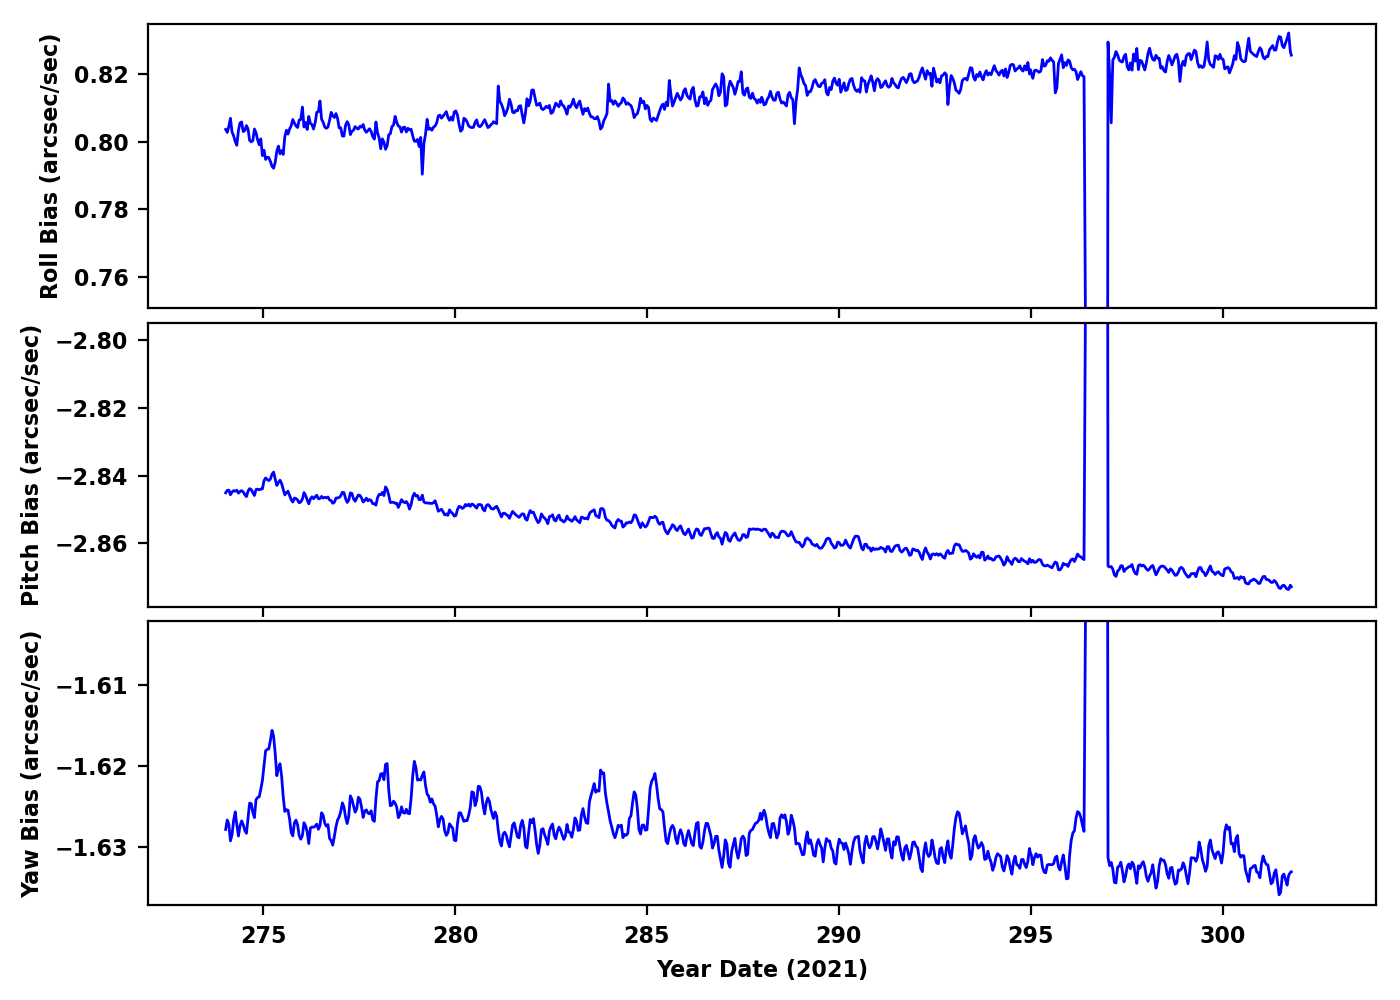
Gyro Bias Drift
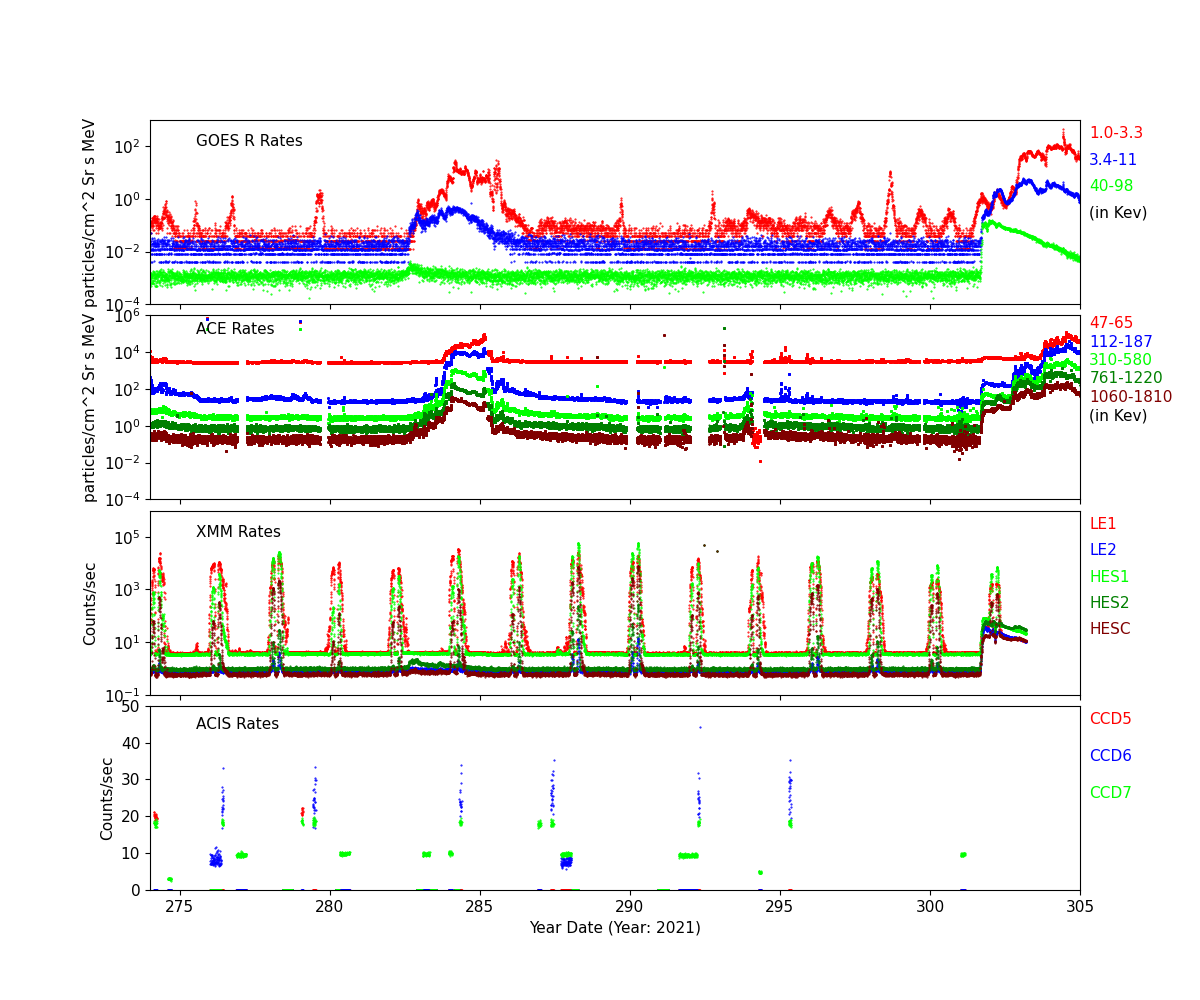
Radiation History
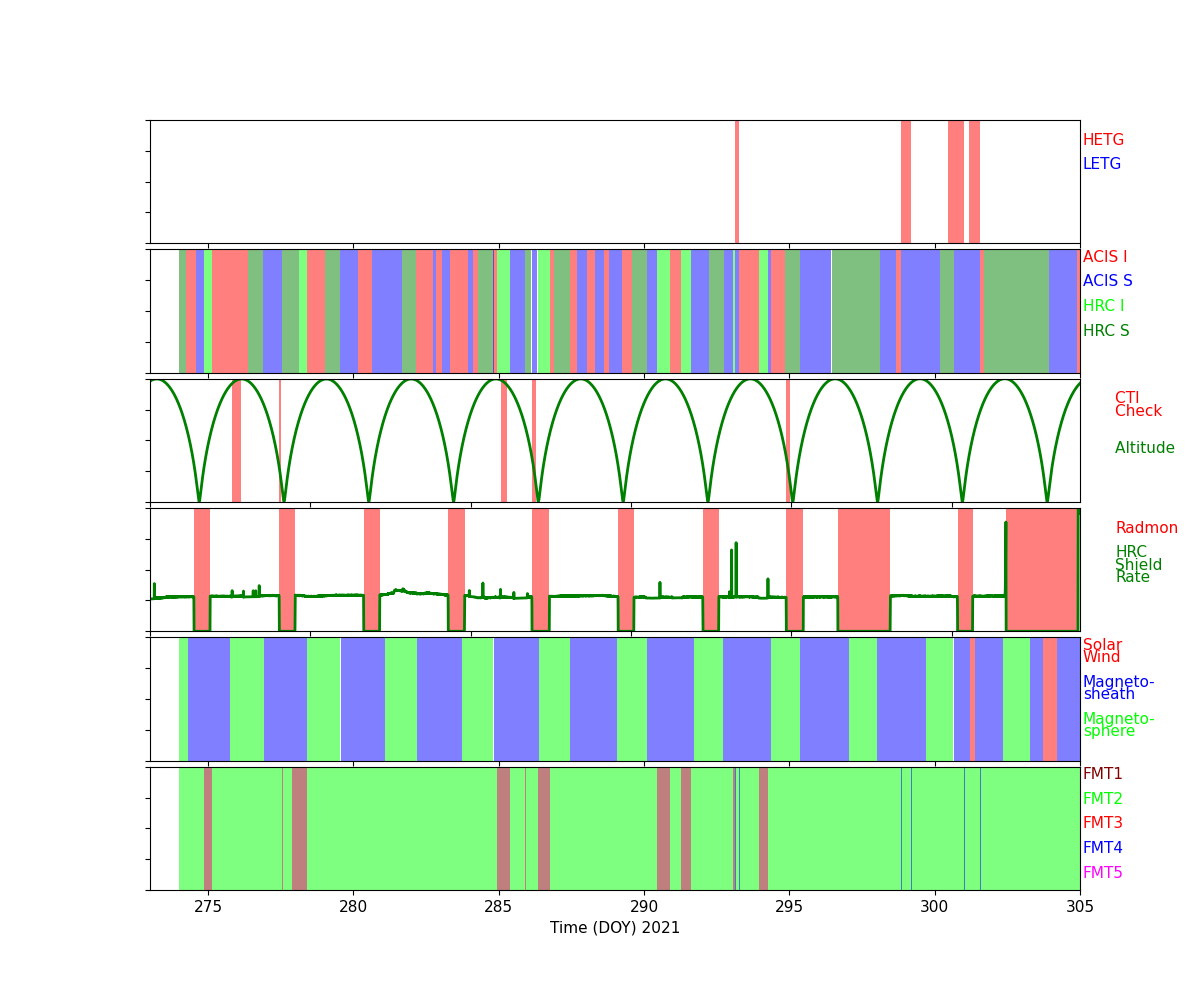
Radiation Count Rates of Oct 2021
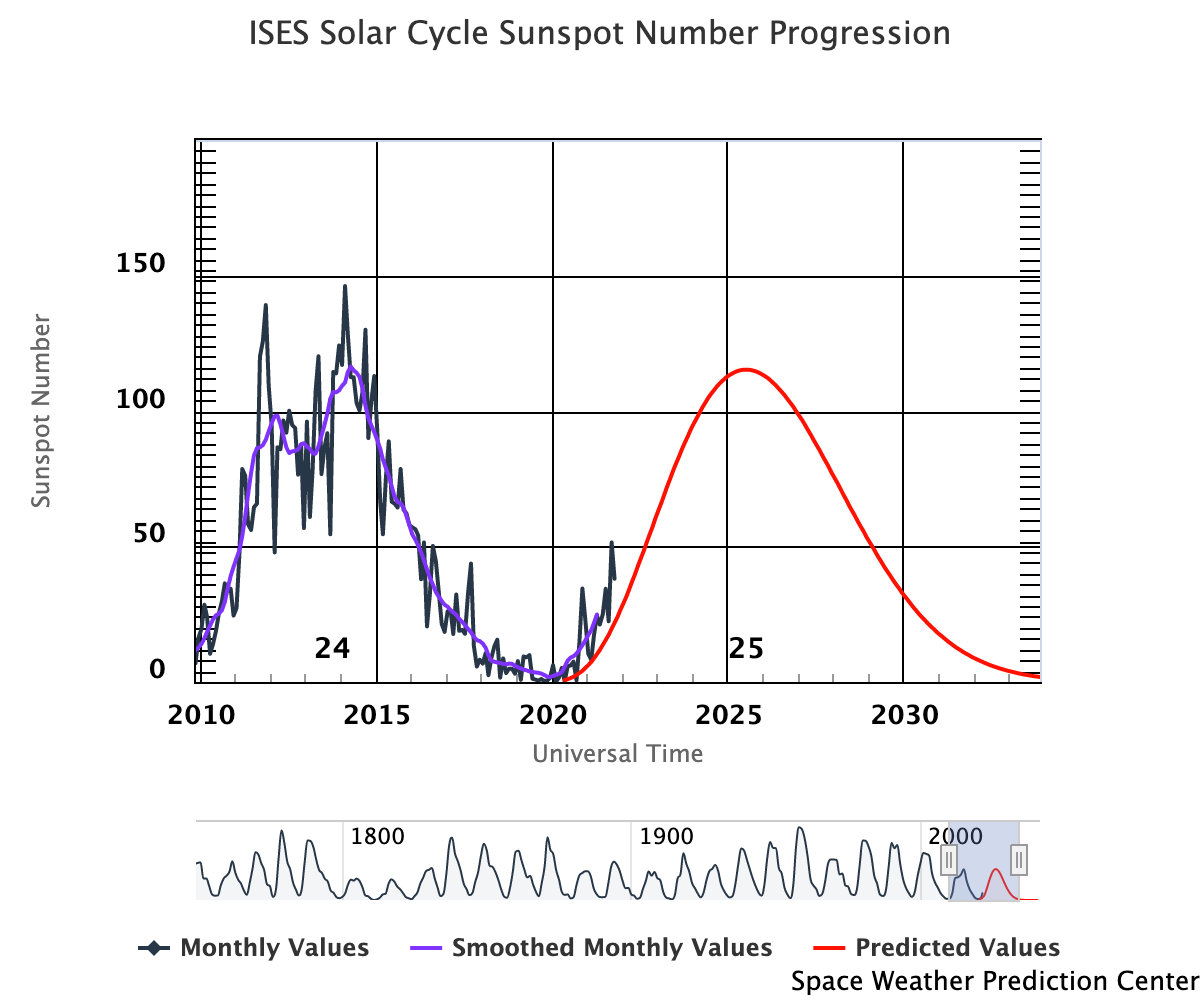
Sun Spot History (See:NOAA Page)
SIM
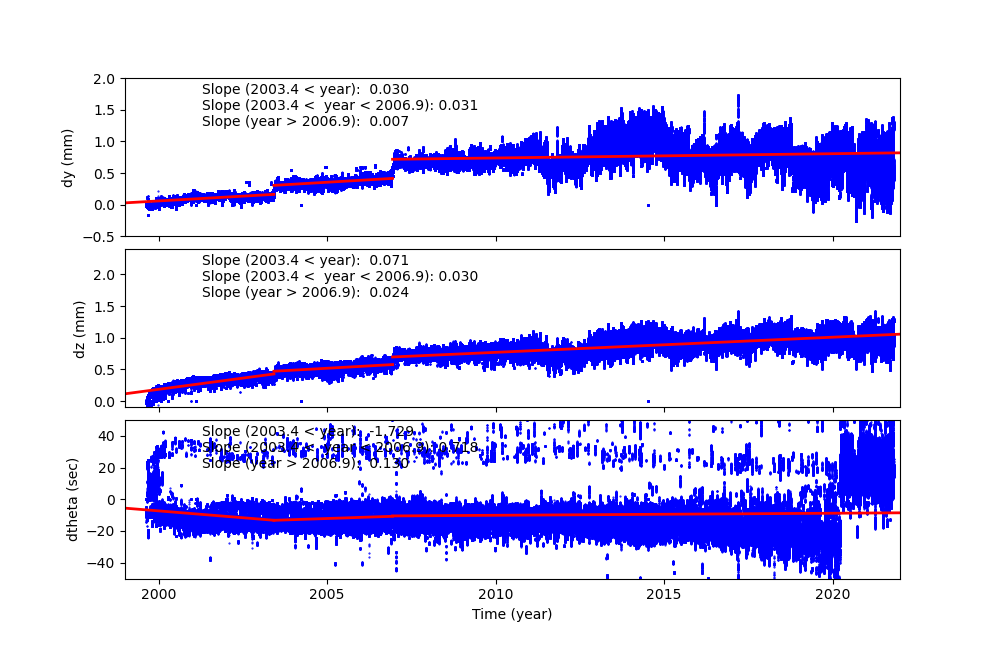
SIM Shift and Twist
SIM Shift and Twist Trend The following plots show trends of SIM shifts (dy and dz) and twist (dtheta). All quantities are directly taken from pcaf*_asol1.fits files. The units are mm for dy and dz, and degree for dtheta. We fit three lines separated before and after (Days of Mission)= 1400 (May 21, 2003), 2700 (Dec 11, 2006), and 4400 (Aug 07, 2011). The unit of slopes are mm per day or degree per day.
The sudden shift around DOM = 1400, 2700 and 4400 are due to fid light drift (see a memo by Aldcroft fiducial light drift). On the dtheta plot, two tracks are clearly observed. The track around 0.01 is due to HRC-I, and all others are clustered around -0.002. For more detail, please see SIM Shift and Twist Trend page
Trending
Quarterly Trends
- EPS Batteries
| Previous Quarter | |||||||
| MSID | MEAN | RMS | DELTA/YR | DELTA/YR/YR | UNITS | DESCRIPTION | |
| eb2ci | off | 7.995e-05 | 2.197e-05 | 0.34 +/- 0.05 | 0.01 +/- 0.00 | AMP | BATT 2 CHARGE CURRENT | on | 9.548e-04 | 9.034e-04 | 0.34 +/- 0.05 | (0.00+/-0.00)e0 |
|---|---|---|---|---|---|---|---|
| eb2di | off | 4.132e-05 | 3.166e-05 | 0.01 +/- 0.07 | -(4.08+/-5.74)e-4 | AMP | BATT 2 DISCHARGE CURRENT | on | -0.003 | 0.022 | 0.28 +/- 1.15 | (0.00+/-0.00)e0 |
| eb2v | off | 9.104e-04 | 2.223e-05 | 32.44 +/- 0.06 | -0.01 +/- 0.00 | V | BATT 2 VOLTAGE | on | 0.006 | 0.011 | 32.20 +/- 0.56 | (0.00+/-0.00)e0 |
| ecnv1v | 8.063e-06 | 2.272e-06 | 14.89 +/- 0.01 | -0.00 +/- 0.00 | V | CONV 1 +15V OUTPUT | |
| ecnv2v | 3.339e-05 | 3.613e-06 | 14.84 +/- 0.01 | -0.00 +/- 0.00 | V | CONV 2 +15V OUTPUT | |
| ecnv3v | -1.178e-05 | 1.556e-06 | 15.29 +/- 0.00 | -(1.39+/-3.55)e-4 | V | CONV 3 +15V OUTPUT | |
- Spacecraft Electronics
| Previous Quarter | |||||||
| MSID | MEAN | RMS | DELTA/YR | DELTA/YR/YR | UNITS | DESCRIPTION | |
| elbi | -0.001 | 6.607e-04 | 53.58 +/- 1.55 | 0.17 +/- 0.28 | AMP | LOAD BUS CURRENT | |
|---|---|---|---|---|---|---|---|
| elbv | off | -0.005 | 4.892e-05 | 28.54 +/- 0.24 | (6.99+/-162.60)e-4 | V | LOAD BUS VOLTAGE | on | 0.005 | 0.004 | 28.71 +/- 0.22 | (0.00+/-0.00)e0 |
- OBA Heater
| Previous Quarter | |||||||
| MSID | MEAN | RMS | DELTA/YR | DELTA/YR/YR | UNITS | DESCRIPTION | |
| oobthr04 | 0.009 | 5.965e-04 | (3.01+/-0.01)e2 | 0.47 +/- 0.45 | K | RT 27: HRMA STRUT | |
|---|---|---|---|---|---|---|---|
| oobthr12 | 0.010 | 9.214e-04 | (2.99+/-0.02)e2 | 1.03 +/- 0.70 | K | RT 35: OBA CONE | |
| oobthr26 | 0.012 | 0.001 | (3.02+/-0.03)e2 | 2.26 +/- 0.98 | K | RT 48: OBA CONE | |
| oobthr38 | 3.685e-06 | 6.316e-06 | (2.83+/-0.00)e2 | 0.01 +/- 0.00 | K | RT 60: TFTE CONE | |
| oobthr44 | 0.011 | 9.639e-04 | (3.01+/-0.02)e2 | 1.26 +/- 0.77 | K | RT 66: TFTE COVER | |
| oobthr50 | 0.012 | 7.681e-04 | (2.96+/-0.02)e2 | 0.30 +/- 0.59 | K | RT 76: S/C STRUT | |
Spacecraft Motions
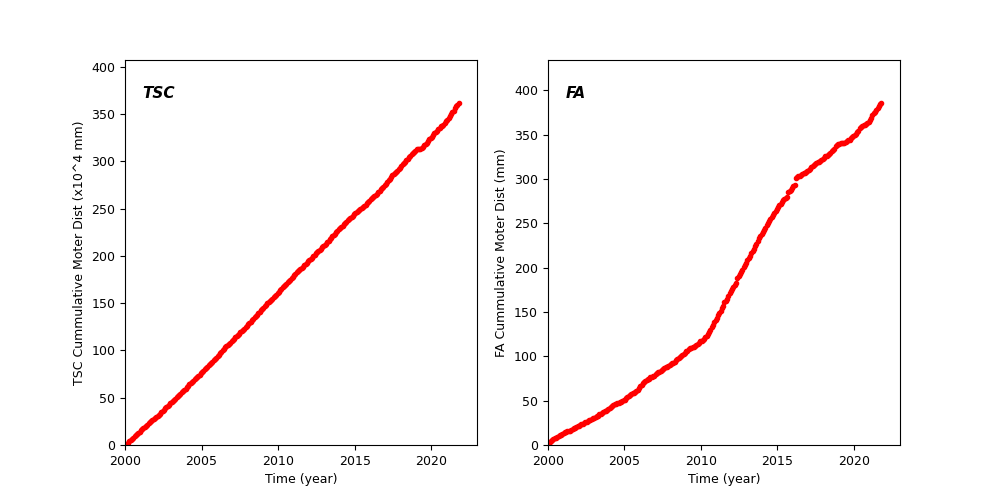
TSC and FA Cummulative Moter Distance
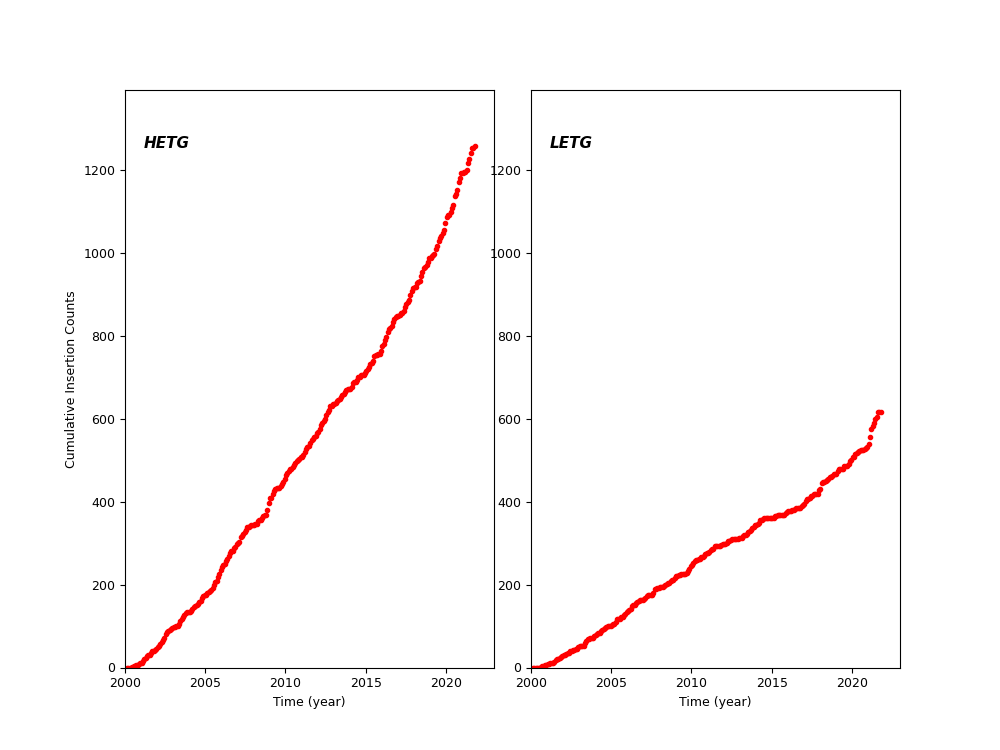
HETG and LETG Cummulative Insertion Counts
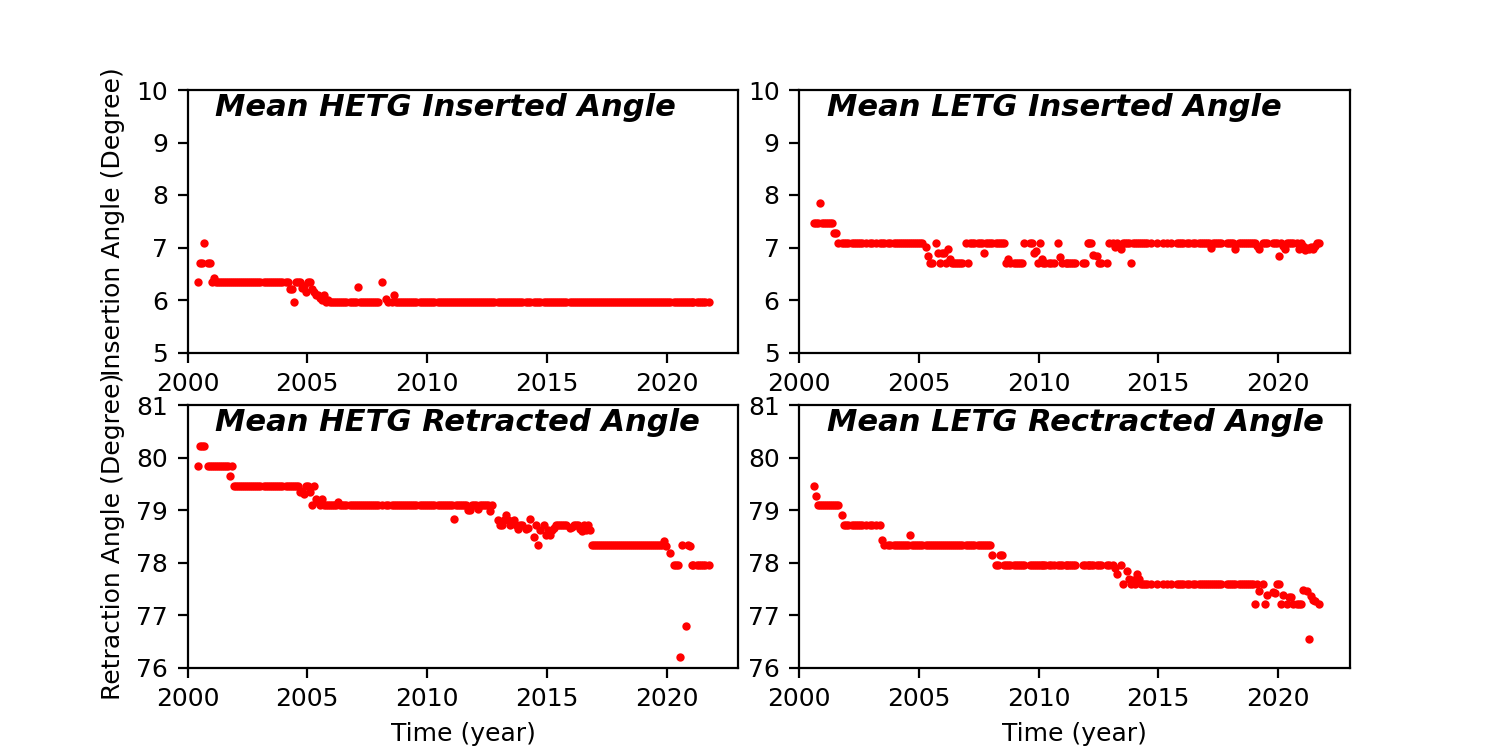
HETG/LETG Insertion/Retraction Angle
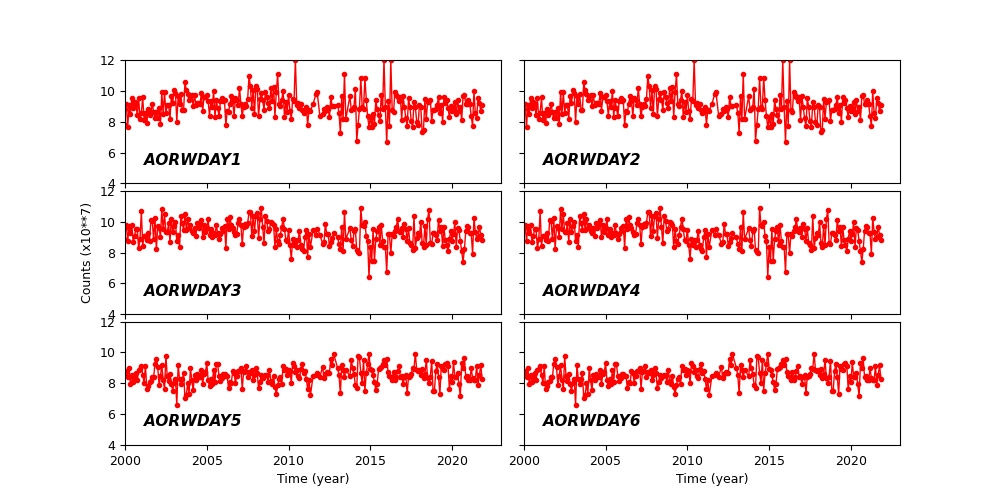
Reaction Wheel Rotations