ACIS
ACIS DOSE Registered-Photon-Map
The steps we took to compute the dose map are;
- Level 1 Event files for a specified month are obtained from archive.
- Image data including I2, I3, S2, S3 CCDs are extracted from all event files.
- All the extracted image data were merged to create a month long exposure map for the month.
- The exposure map is opened with ds9, and check a distribution of count rates against energy. From this, estimate the upper threshold value. Any events beyond this upper threshold are assumed erroneous events such as bad pixels.
- Using this upper threshold, the data is filtered, and create a cleaned exposure map for the month.
- The exposure map from each month from the Sep 1999 is added up to create a cumulative exposure map for each month.
- Using fimgstatistic, we compute count rate statistics for each CCDs.
- For observations with high data drop rates (e.g., Crab nebula, Cas A), we corrected the observations by adding events.
Please check more detail plots at Telemetered Photon Dose Trend page.
)
)
)
Statistics:
# IMAGE     NPIX     MEAN        RMS        MIN     MAX
ACIS_may22 6004901       7.112         10.307           0.0     3391


I2 node 0  262654	6.239546	2.990797	0.0	 73.0
I2 node 1  262654	7.216414	5.701761	0.0	2344.0
I2 node 2  262654	7.753192	4.170952	0.0	108.0
I2 node 3  262654	7.305062	3.834713	0.0	445.0

I3 node 0  262654	8.229336	4.093500	0.0	121.0
I3 node 1  262654	7.938624	6.720775	0.0	2700.0
I3 node 2  262654	6.980019	3.155523	0.0	 76.0
I3 node 3  262654	6.993376	6.586129	0.0	2524.0

S2 node 0  262654	9.808050	8.435130	0.0	888.0
S2 node 1  262654	10.798039	9.022876	0.0	879.0
S2 node 2  262654	10.626080	9.981645	0.0	2388.0
S2 node 3  262654	10.020190	8.813391	0.0	703.0

S3 node 0  262654	12.446906	9.430925	0.0	244.0
S3 node 1  262654	13.881256	10.577090	0.0	3391.0
S3 node 2  262654	13.116445	6.383154	0.0	214.0
S3 node 3  262654	11.555836	5.279157	0.0	224.0
)
)
)
Statistics:
 IMAGE     NPIX      MEAN        RMS           MIN      MAX
ACIS_total   6004901       2567.773         3293.241           0.0   141576


I2 node 0  262654	2224.003440	447.624432	477.0	13548.0
I2 node 1  262654	2339.969958	638.082735	493.0	132008.0
I2 node 2  262654	2368.493399	501.913815	512.0	14122.0
I2 node 3  262654	2373.779381	613.920135	481.0	28860.0

I3 node 0  262654	2552.618935	628.528699	479.0	13759.0
I3 node 1  262654	2633.671936	1734.771257	508.0	55818.0
I3 node 2  262654	2348.025751	441.078278	478.0	13986.0
I3 node 3  262654	2332.834940	471.664964	446.0	34785.0

S2 node 0  262654	2992.218436	485.157303	1623.0	22357.0
S2 node 1  262654	3171.830692	720.255956	1804.0	17161.0
S2 node 2  262654	3507.284628	721.379983	2223.0	30030.0
S2 node 3  262654	3468.501324	574.297722	1961.0	72148.0

S3 node 0  262654	5326.220021	2913.749826	2332.0	53878.0
S3 node 1  262654	6527.108547	2360.877346	0.0	45535.0
S3 node 2  262654	5257.950743	1339.298115	2413.0	27209.0
S3 node 3  262654	4116.168678	753.573961	2482.0	26438.0
)
|
)
|
)
|
)
|
| Feb 2022 | Nov 2021 | Aug 2021 | May 2021 |
|---|
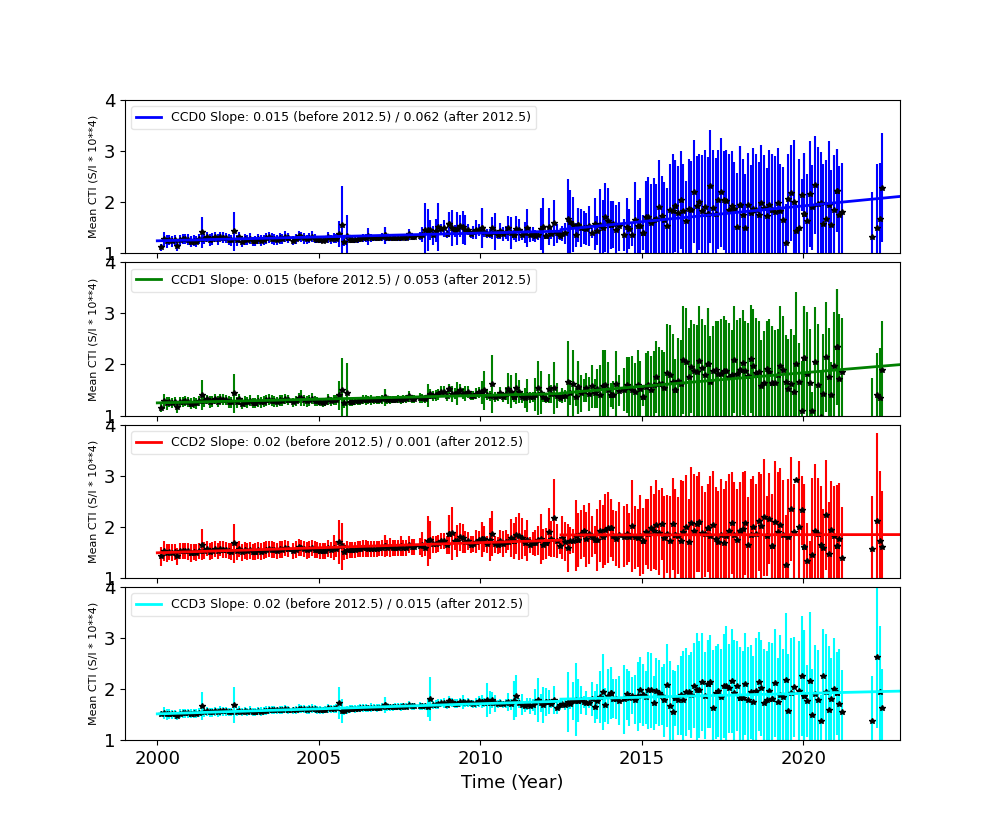
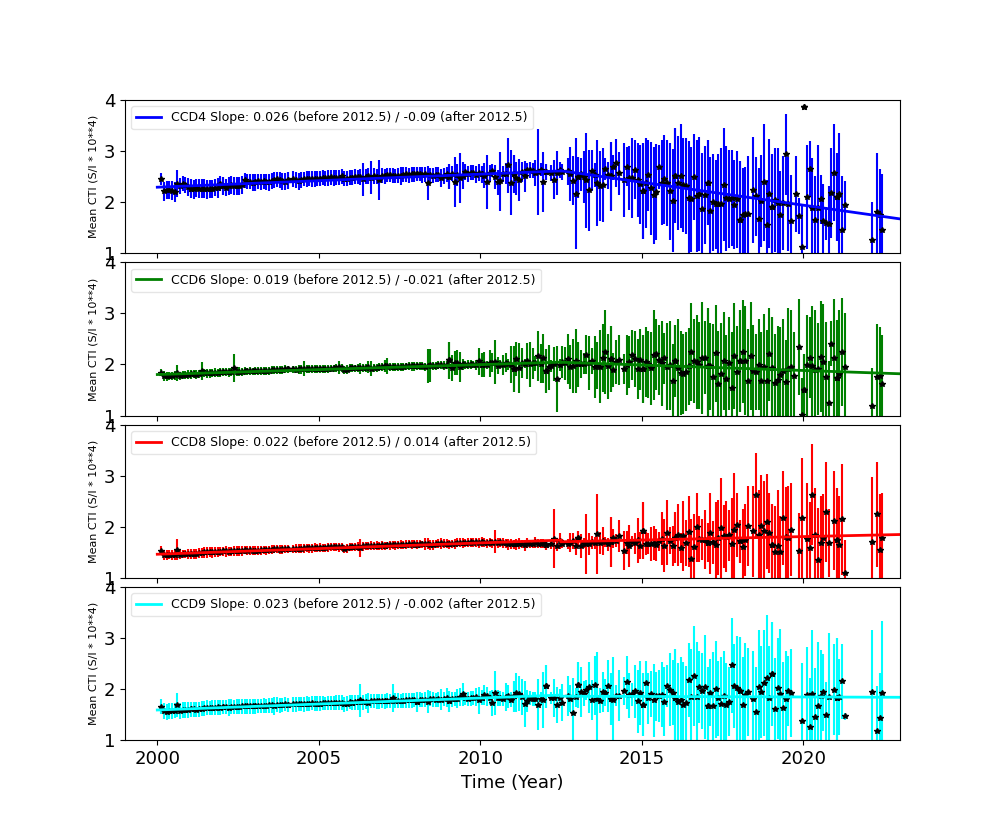
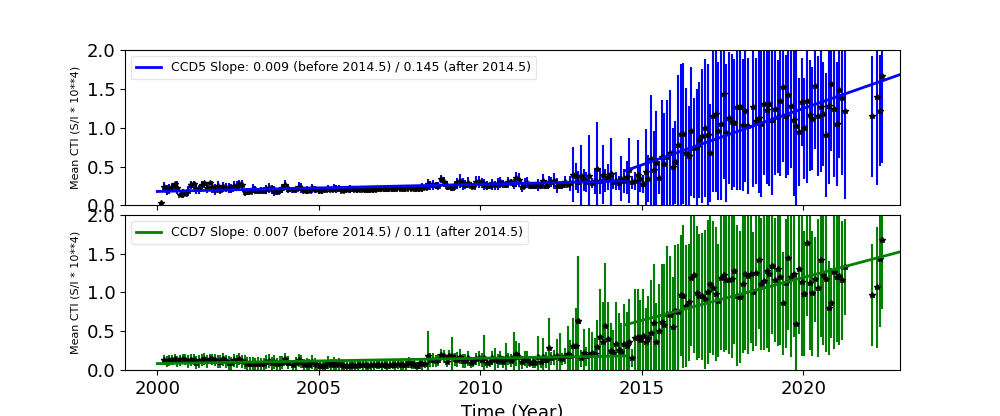
The Mean Detrended CTI
We report CTIs with a refined data definition. CTIs were computed for the temperature dependency corrected data. Please see CTI page for detailed explanation. CTI's are computed for Mn K alpha, and defined as slope/intercept x10^4 of row # vs ADU. Data file: here
Imaging CCDs
Spectral CCDs
Backside CCDs
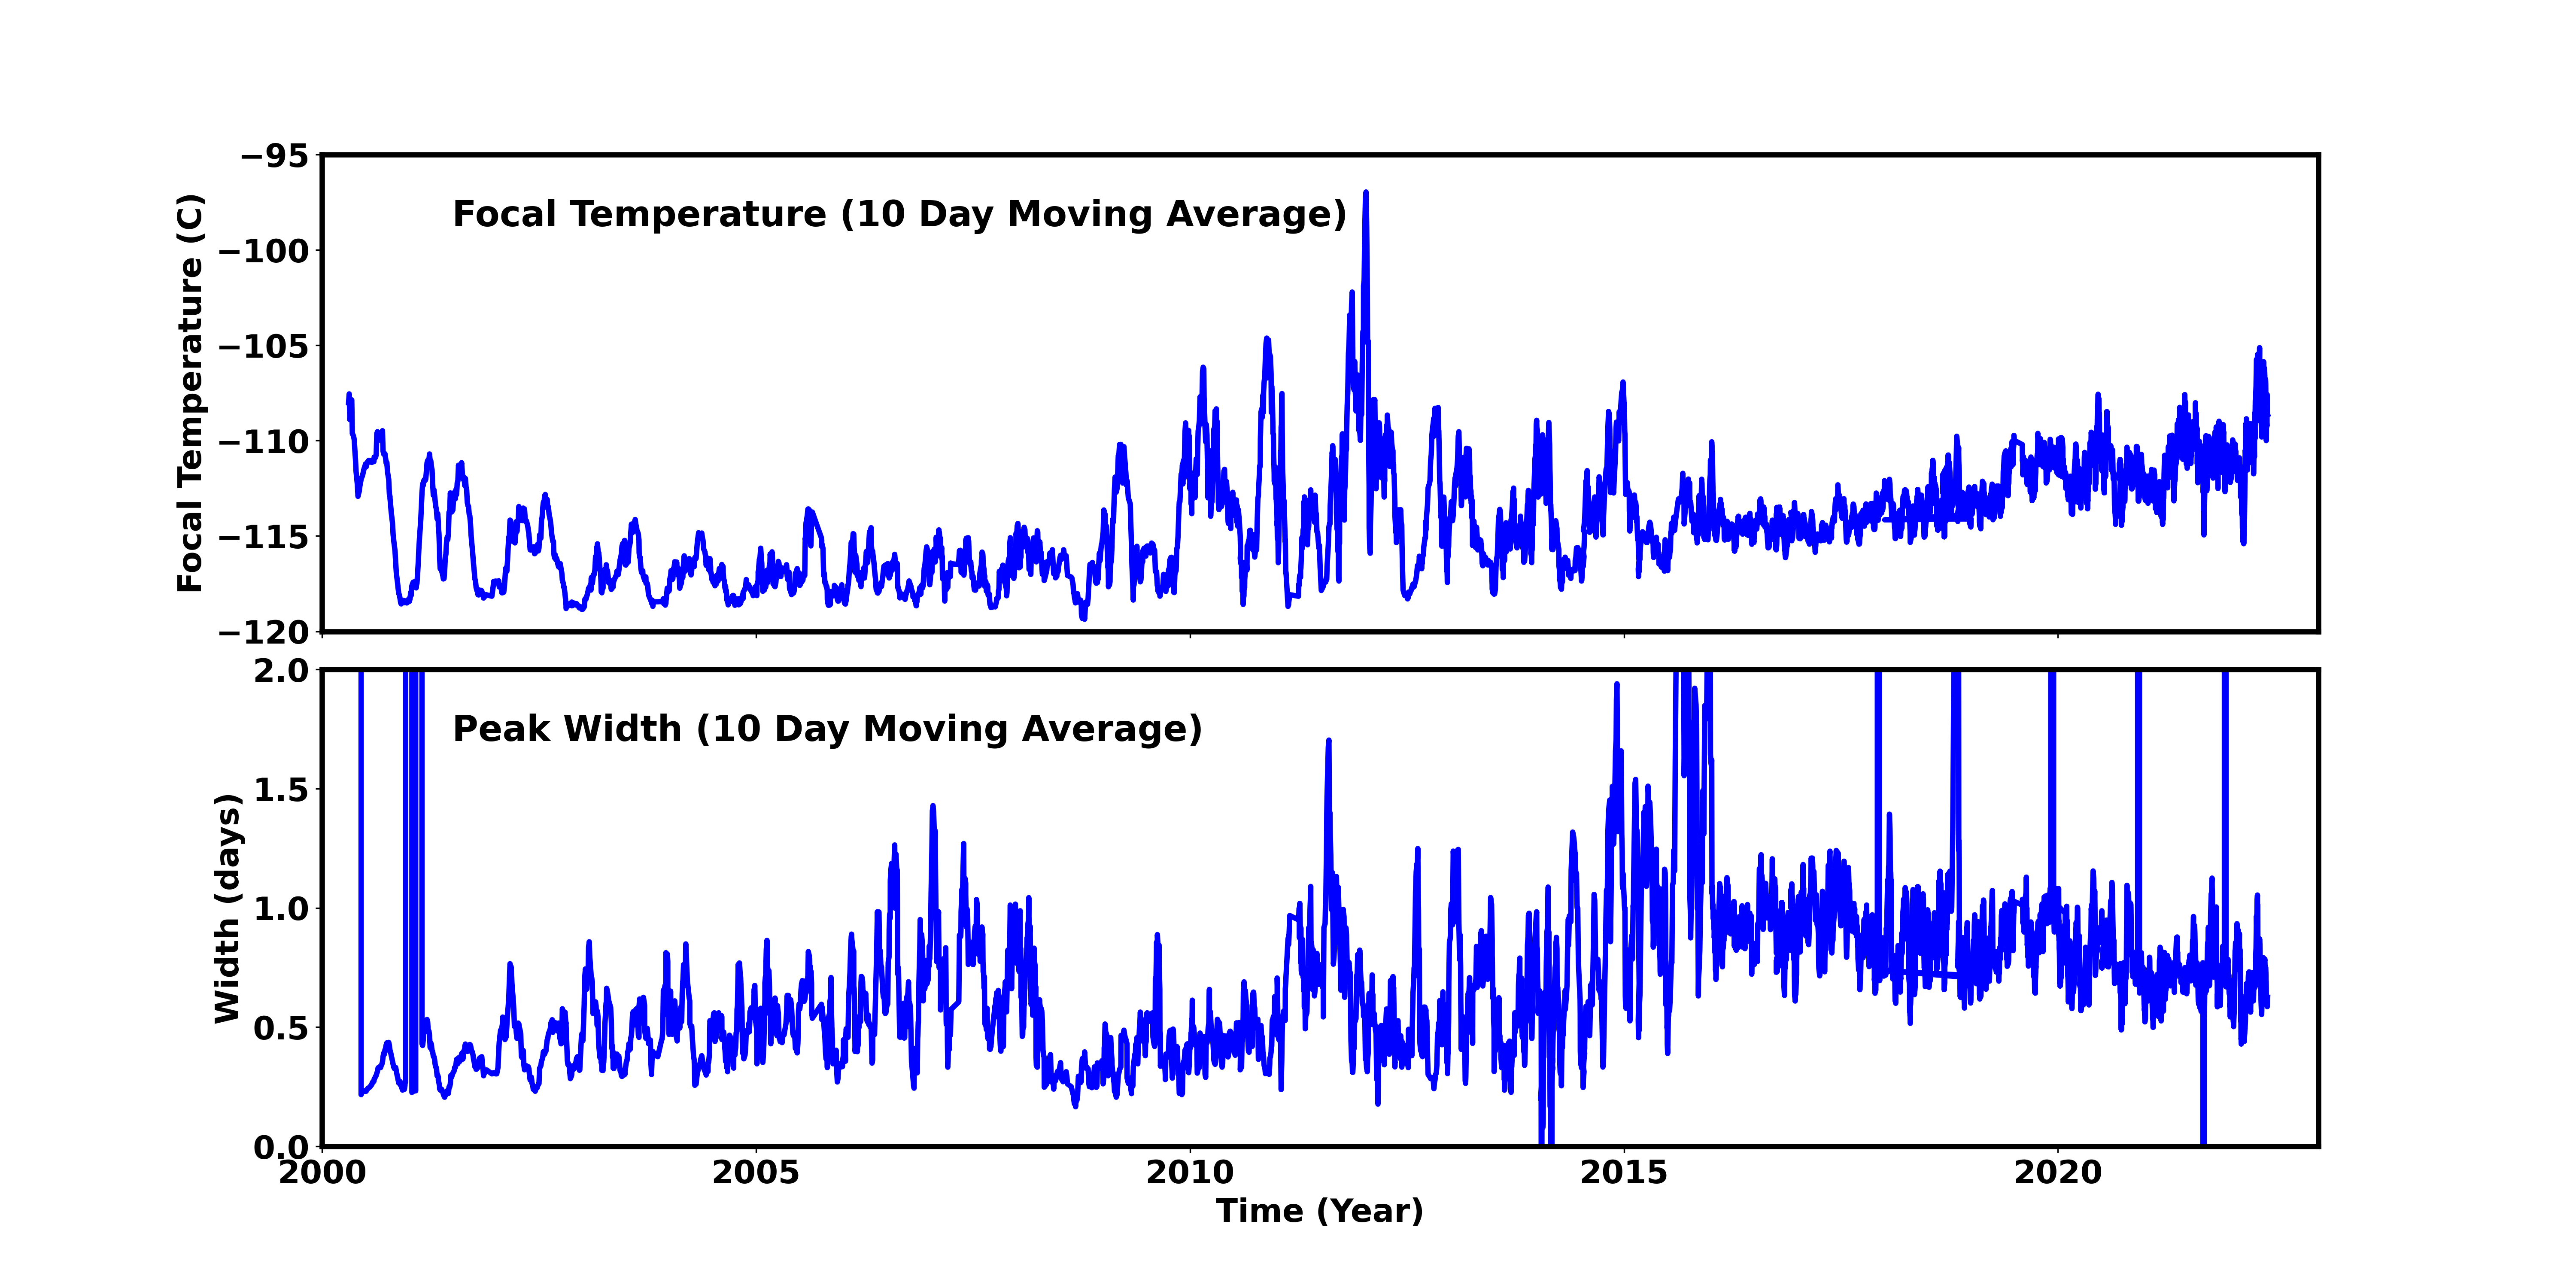
Focal Plane Temperature
May 2022 Focal Temperature
| The Mean (max) FPT: | |
|---|---|
| -108.05 | +/- 7.69 C |
| Mean Width: | |
| 0.67 | +/- 0.2 days |
Averaged Focal Plane Temperature
We are using 10 period moving averages to show trends of peak temperatures and peak widths. Note, the gaps in the width plot are due to missing/corrupted data.
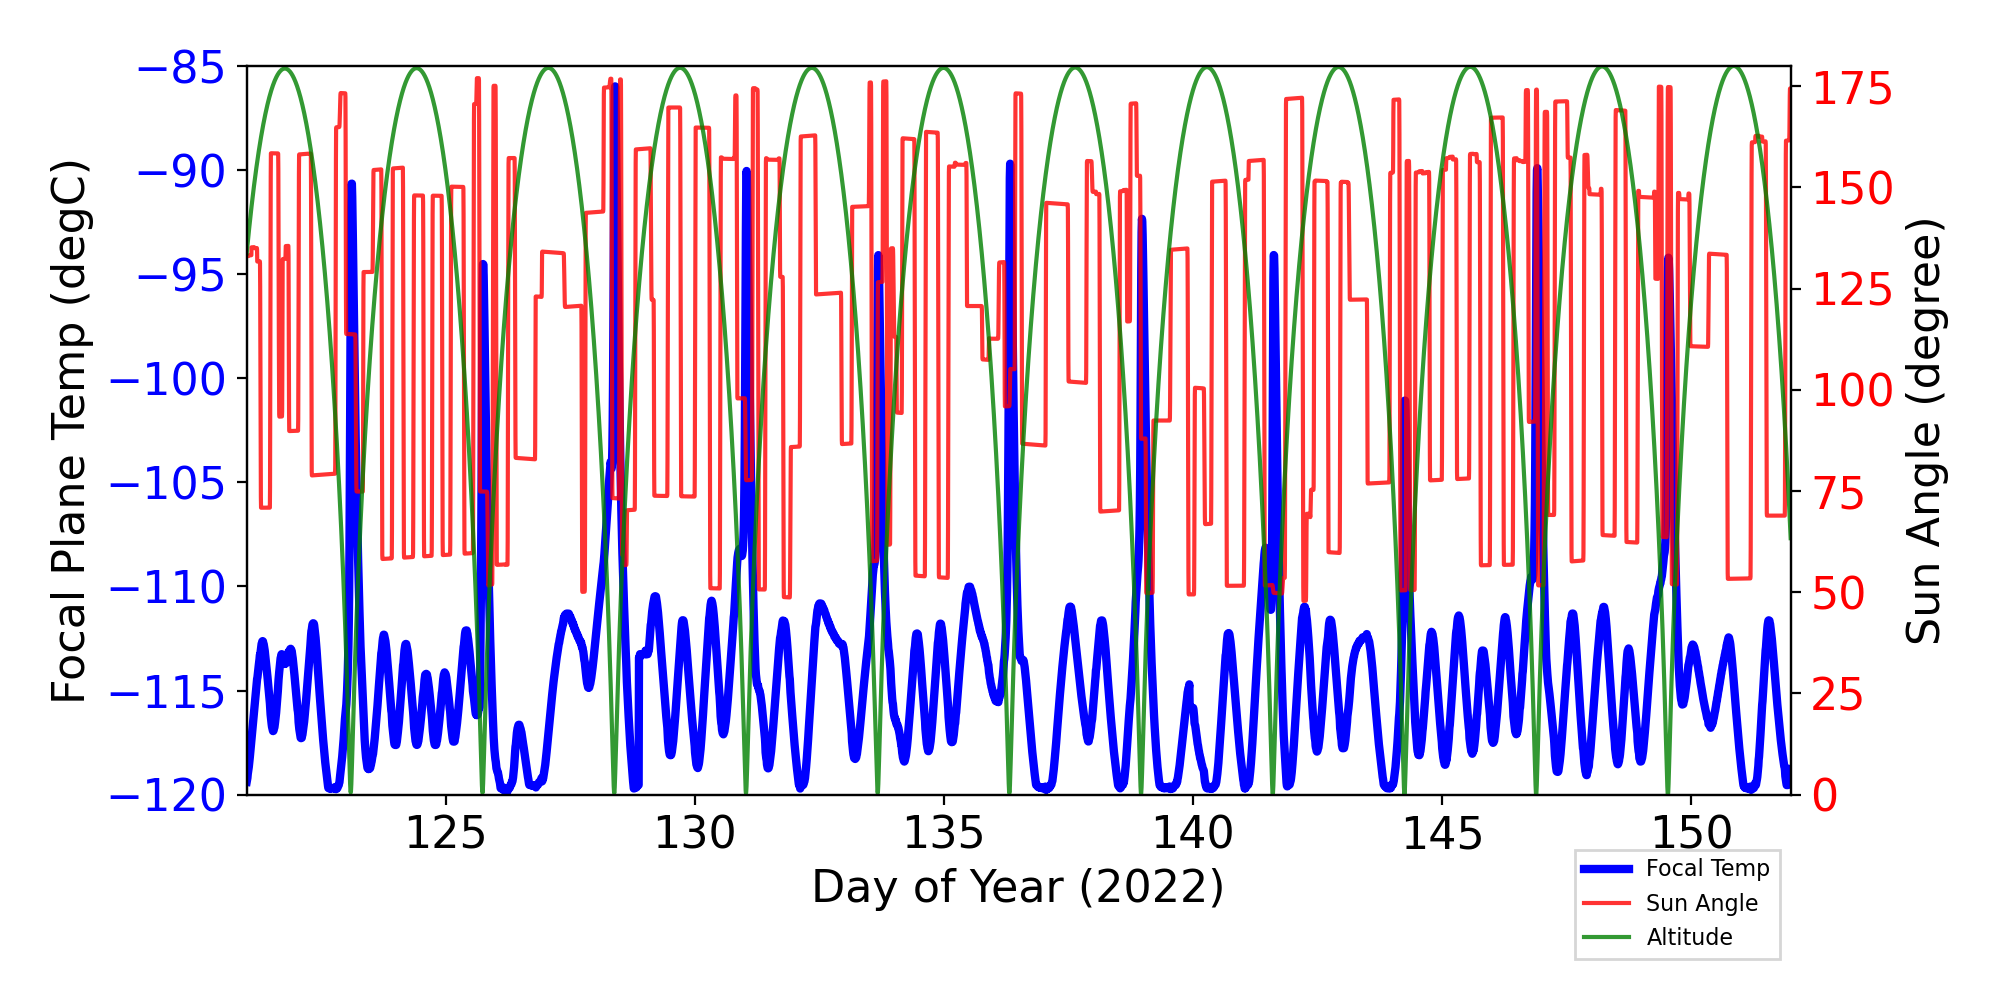
Focal Plane Temperature, Sun Angle and Altitude
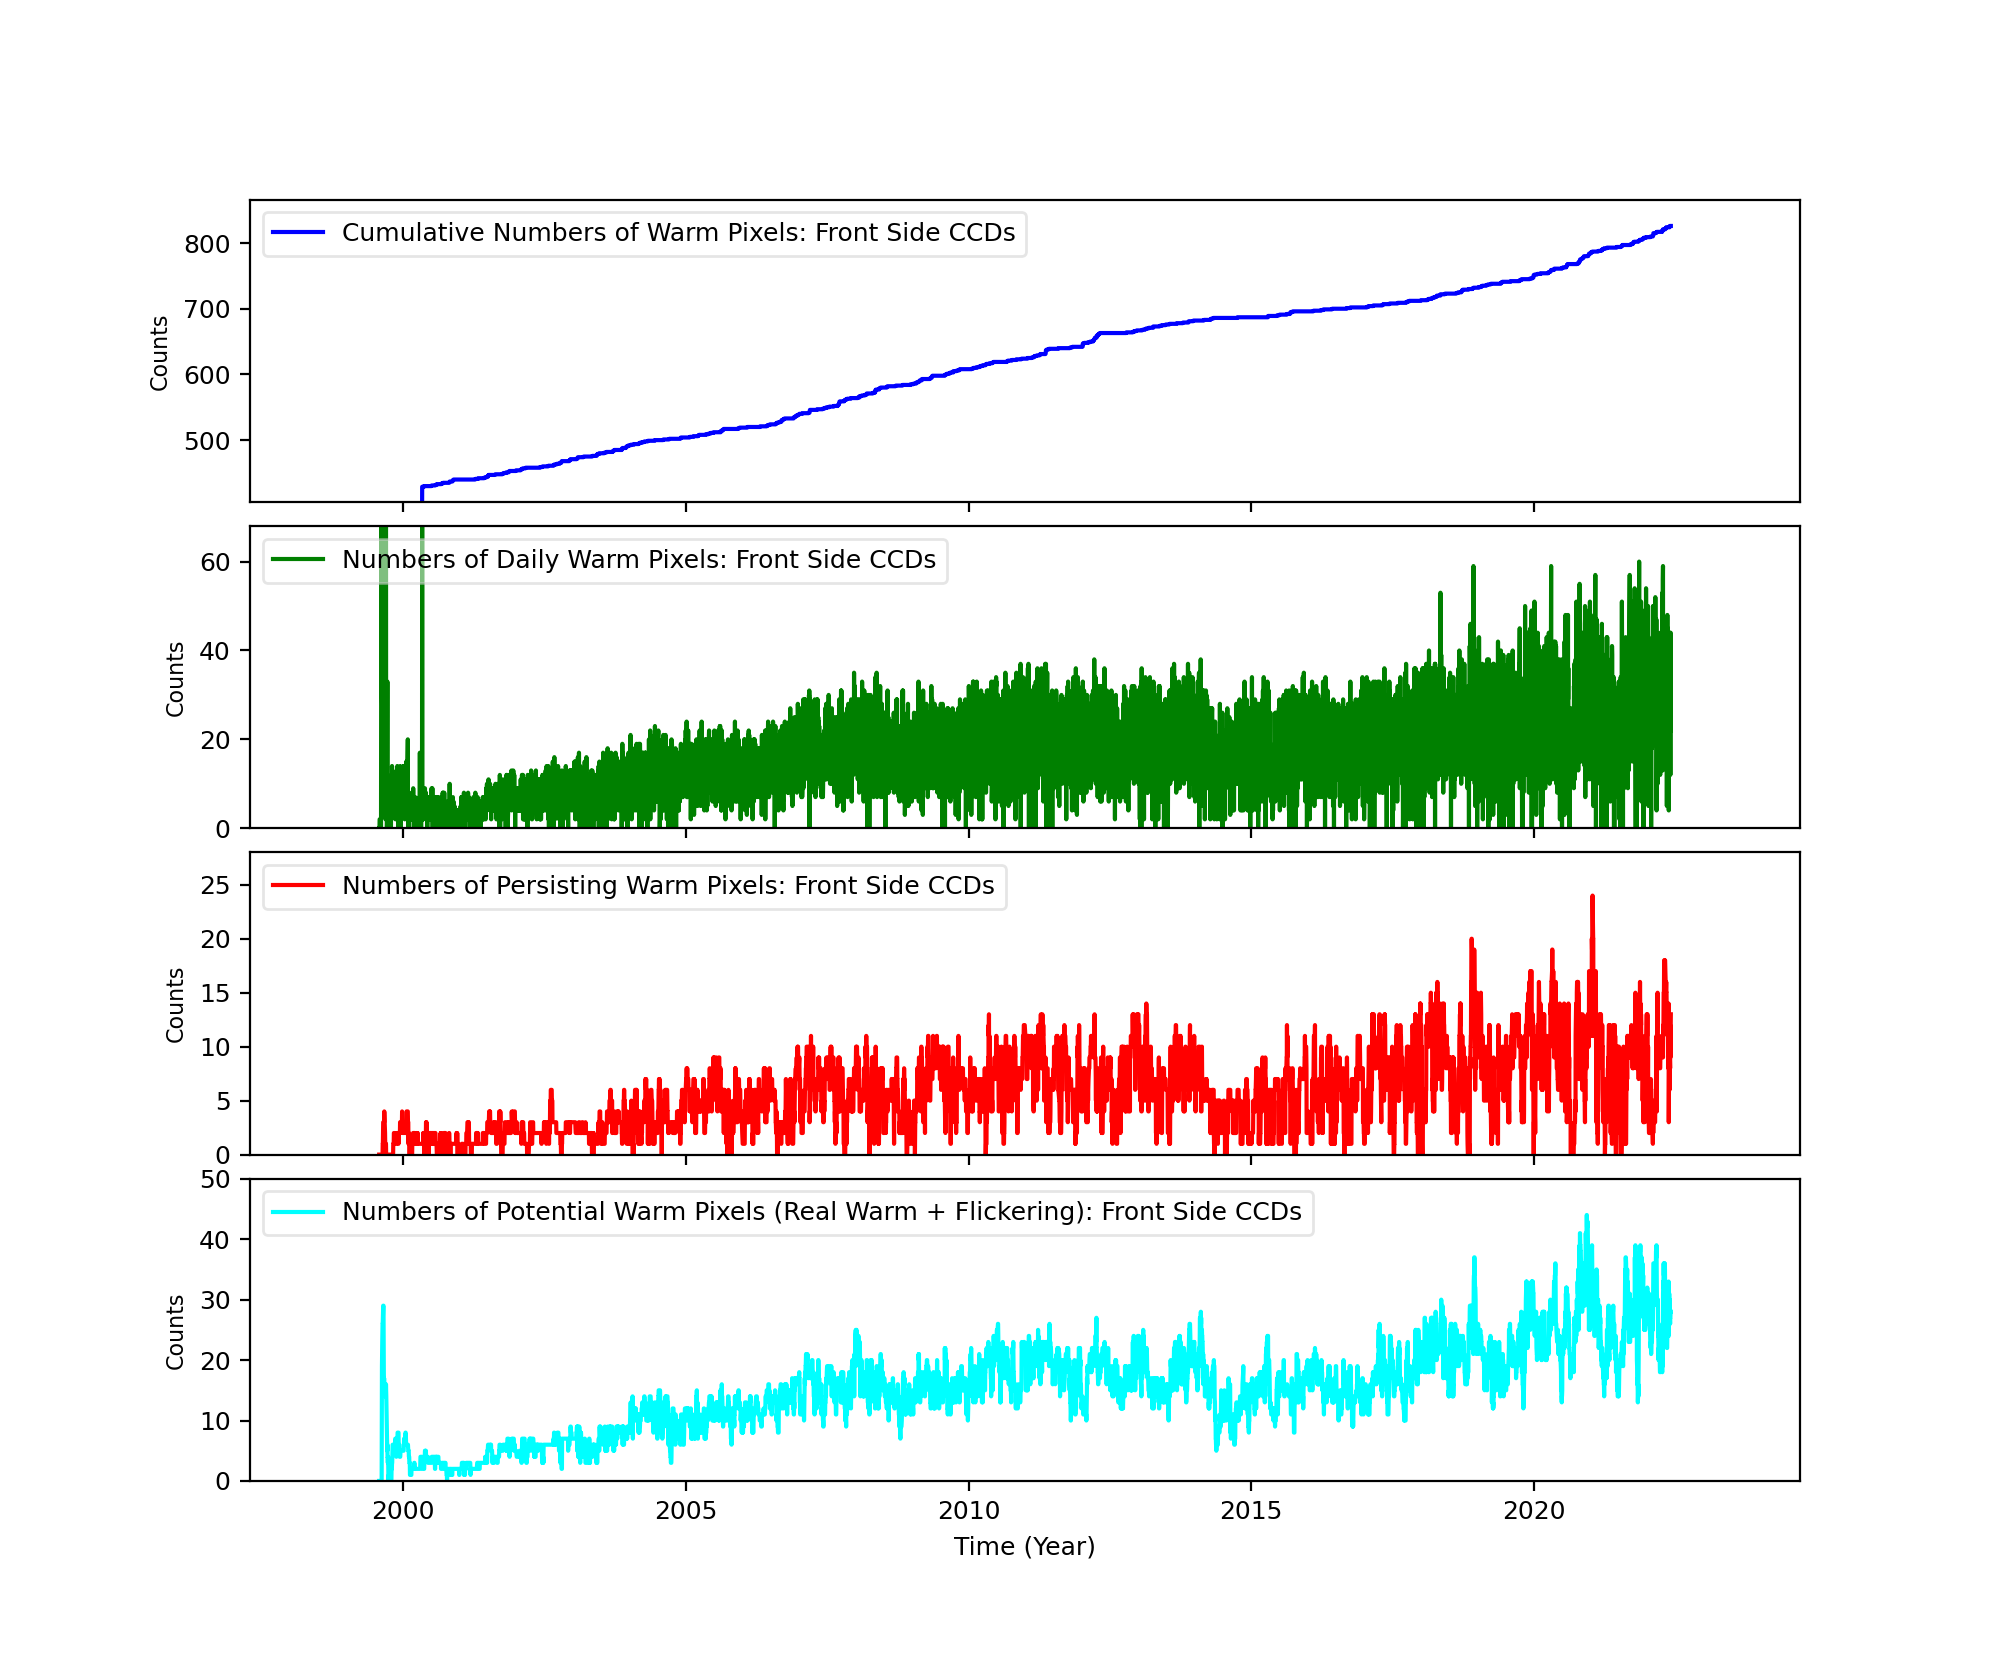
Bad Pixels
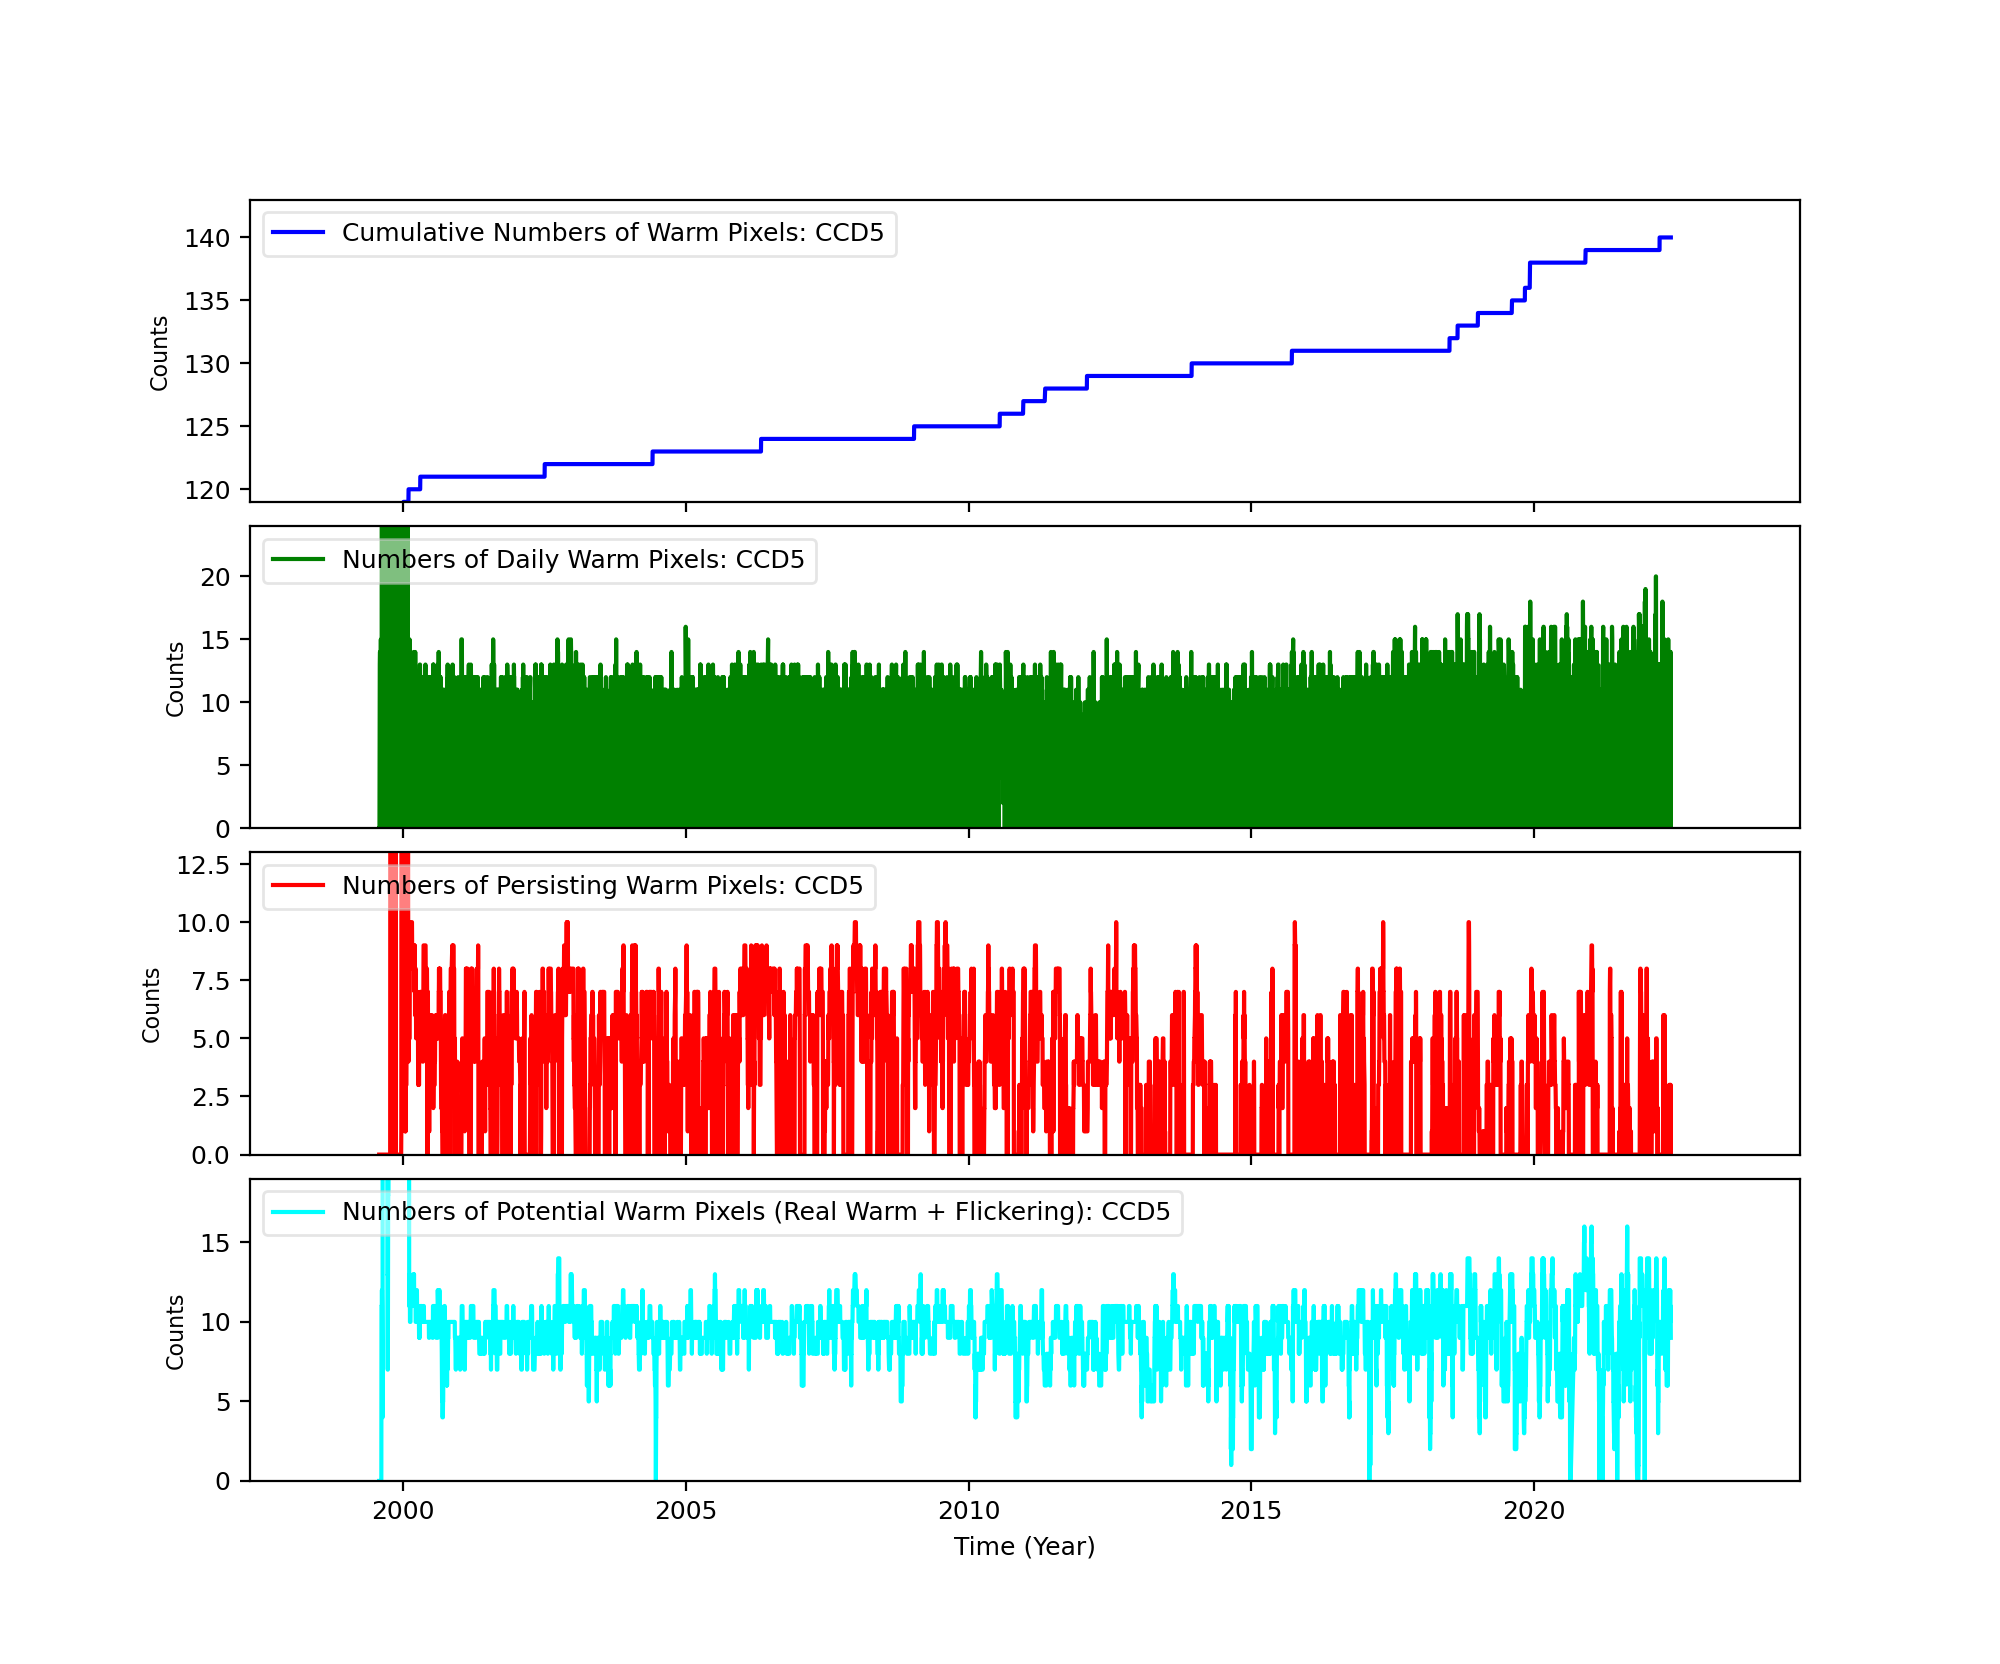
The plots below were generated with a new warm pixel finding script. Please see Acis Bad Pixel Page for details.
Front Side CCDs
Back Side CCD (CCD5)
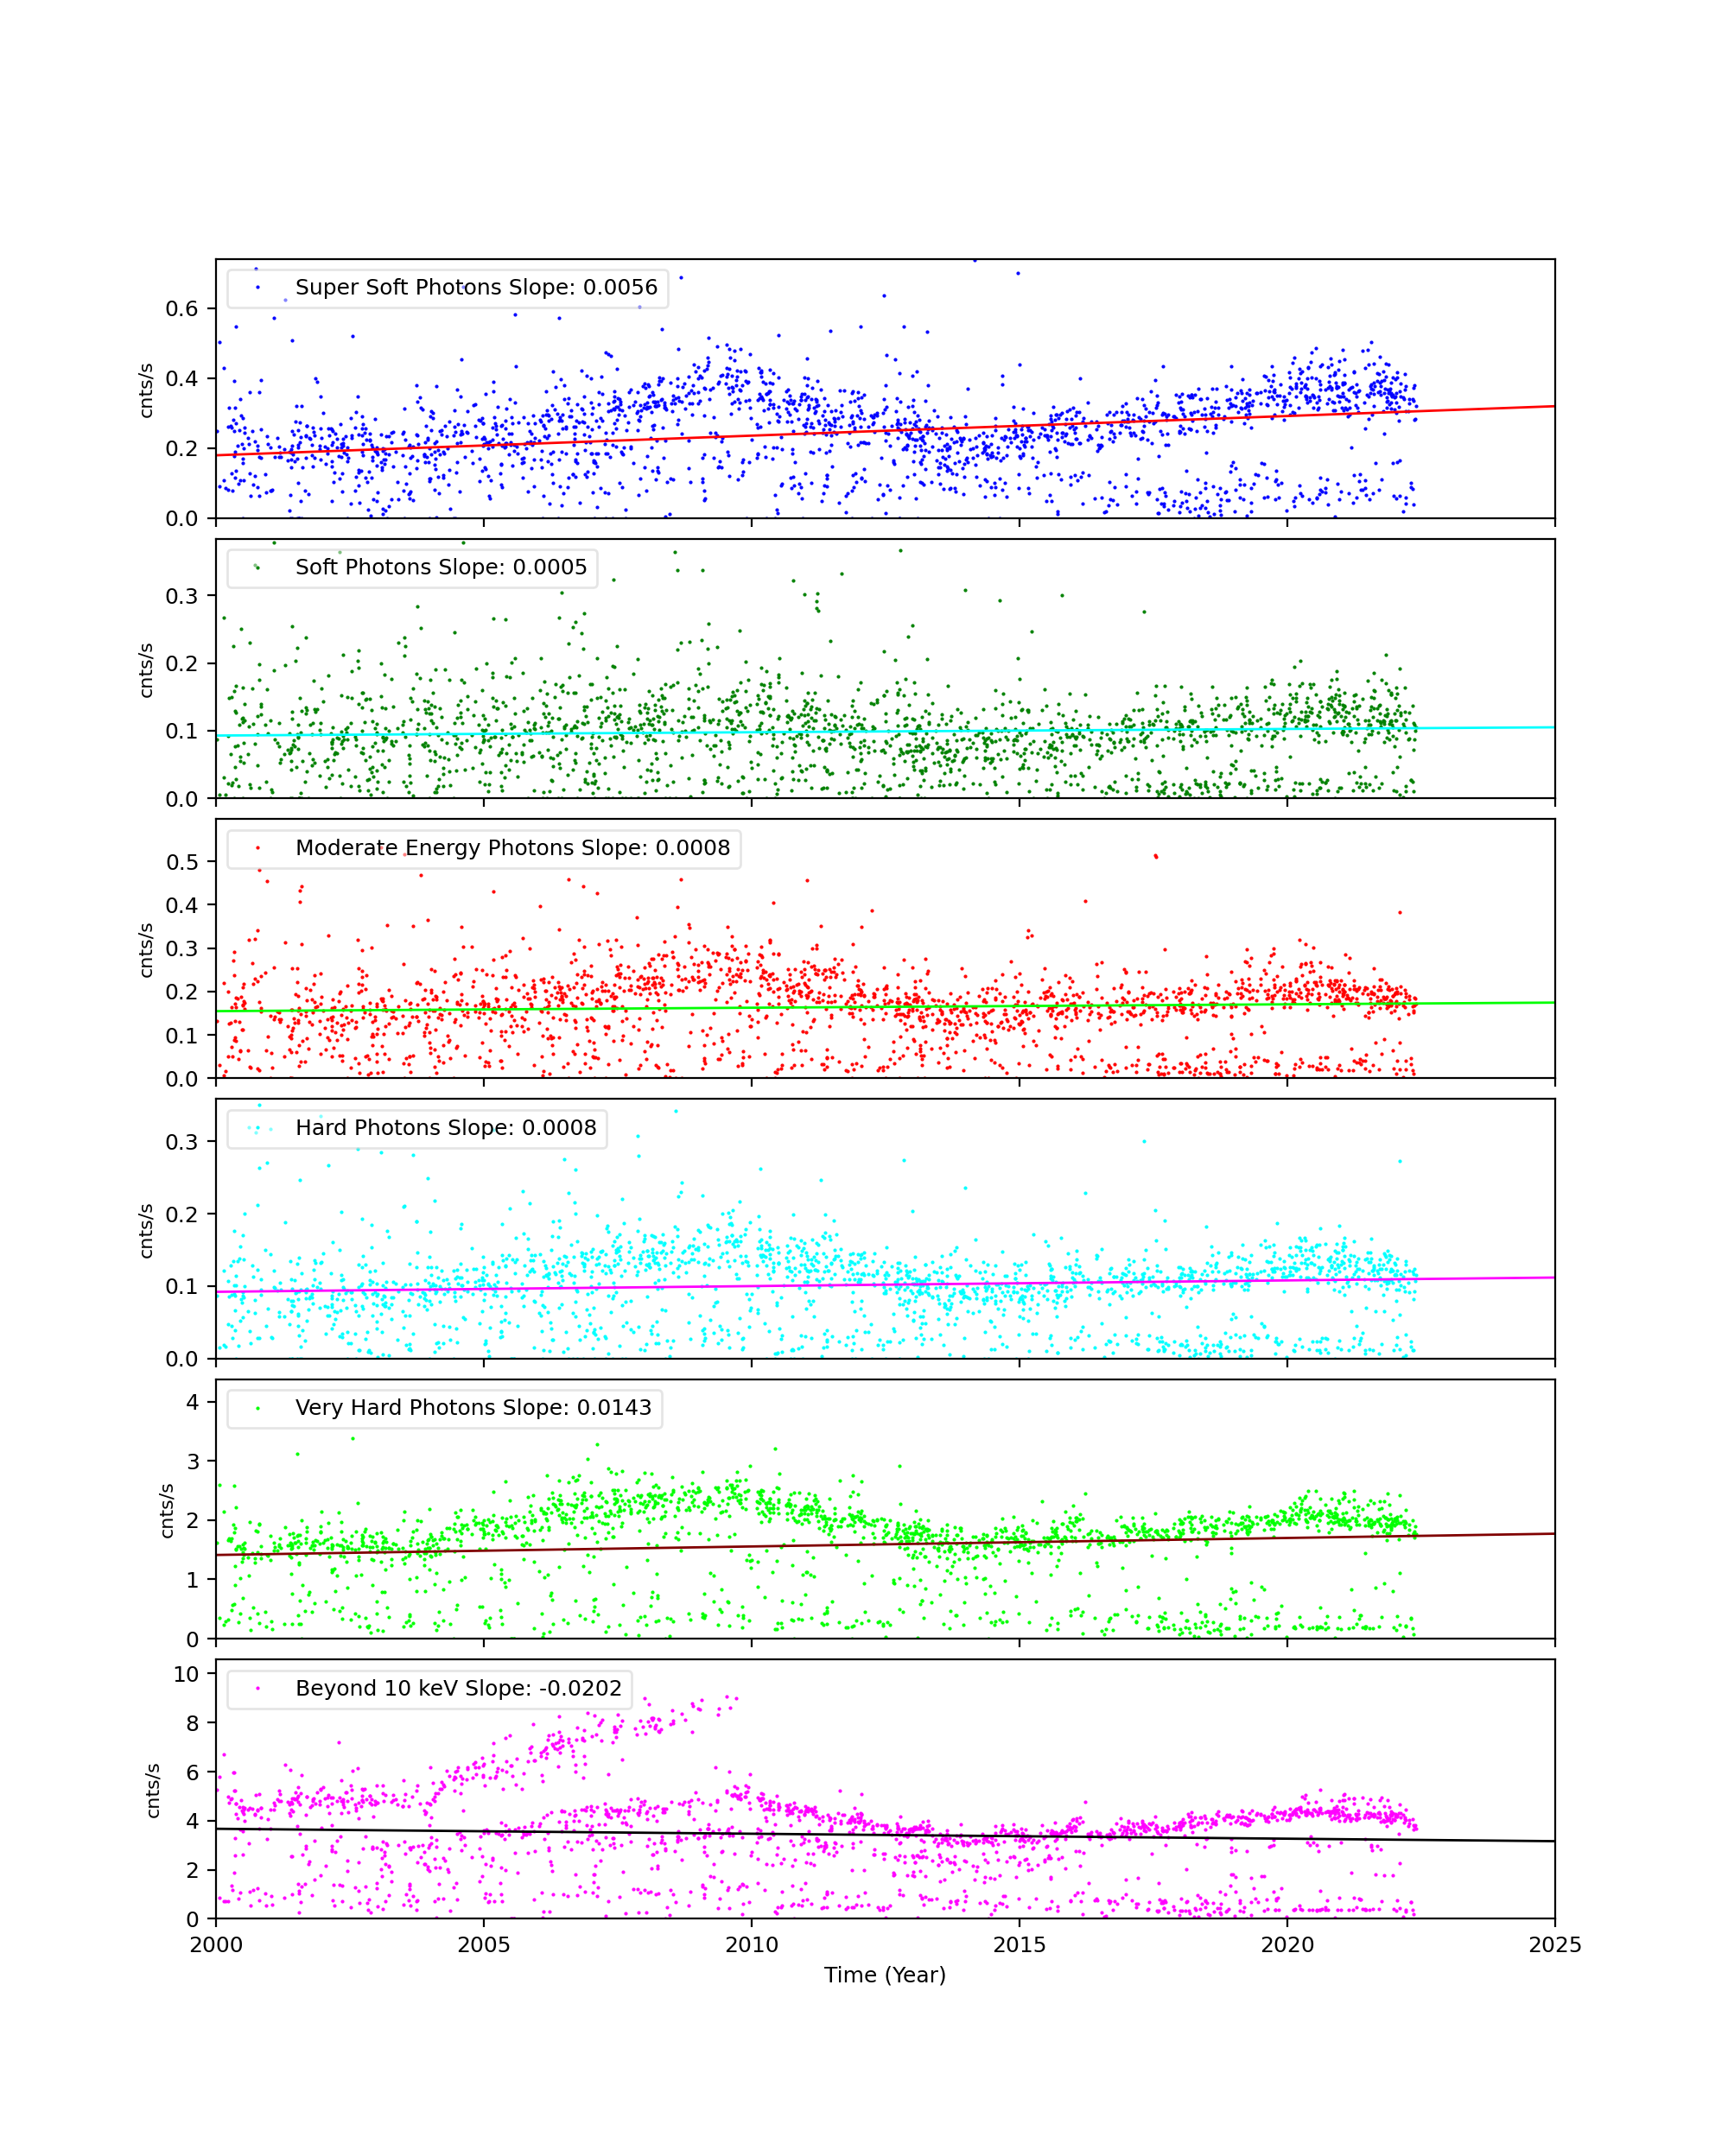
Science Instrument Background Rates
| Name | Low (keV) | High(KeV) | Description |
|---|---|---|---|
| SSoft | 0.00 | 0.50 | Super soft photons |
| Soft | 0.50 | 1.00 | Soft photons |
| Med | 1.00 | 3.00 | Moderate energy photons |
| Hard | 3.00 | 5.00 | Hard Photons |
| Harder | 5.00 | 10.00 | Very Hard photons |
| Hardest | 10.00 | Beyond 10 keV |
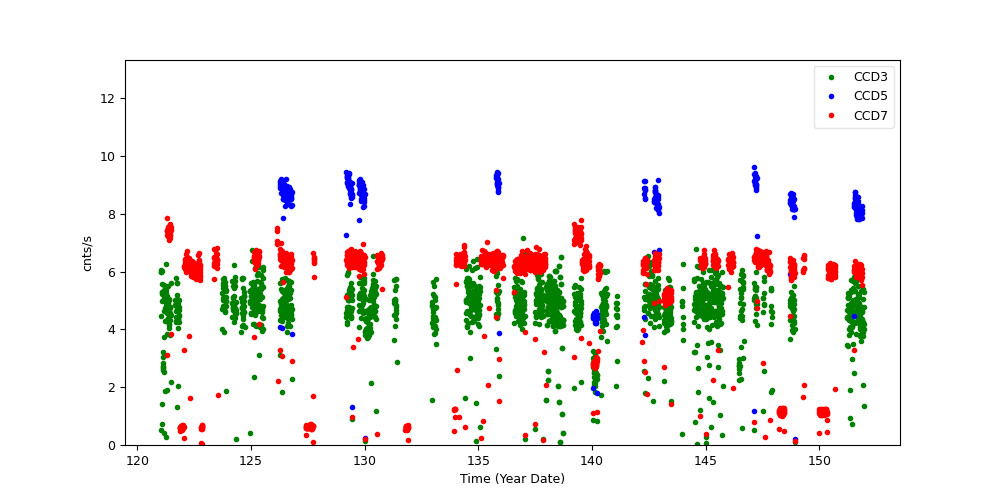
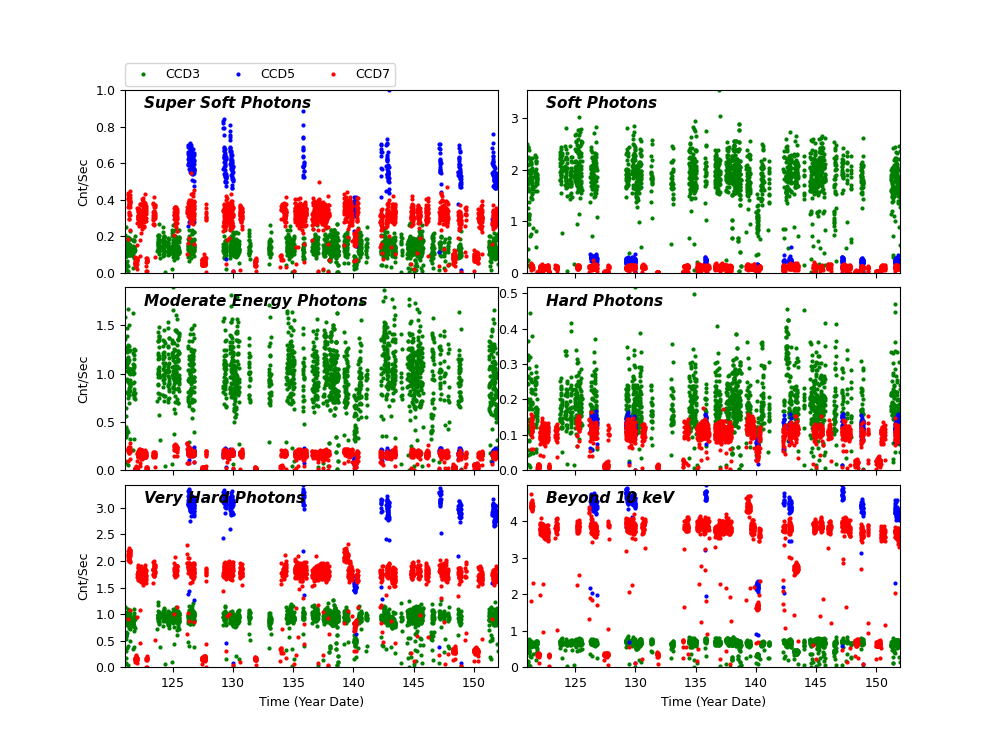
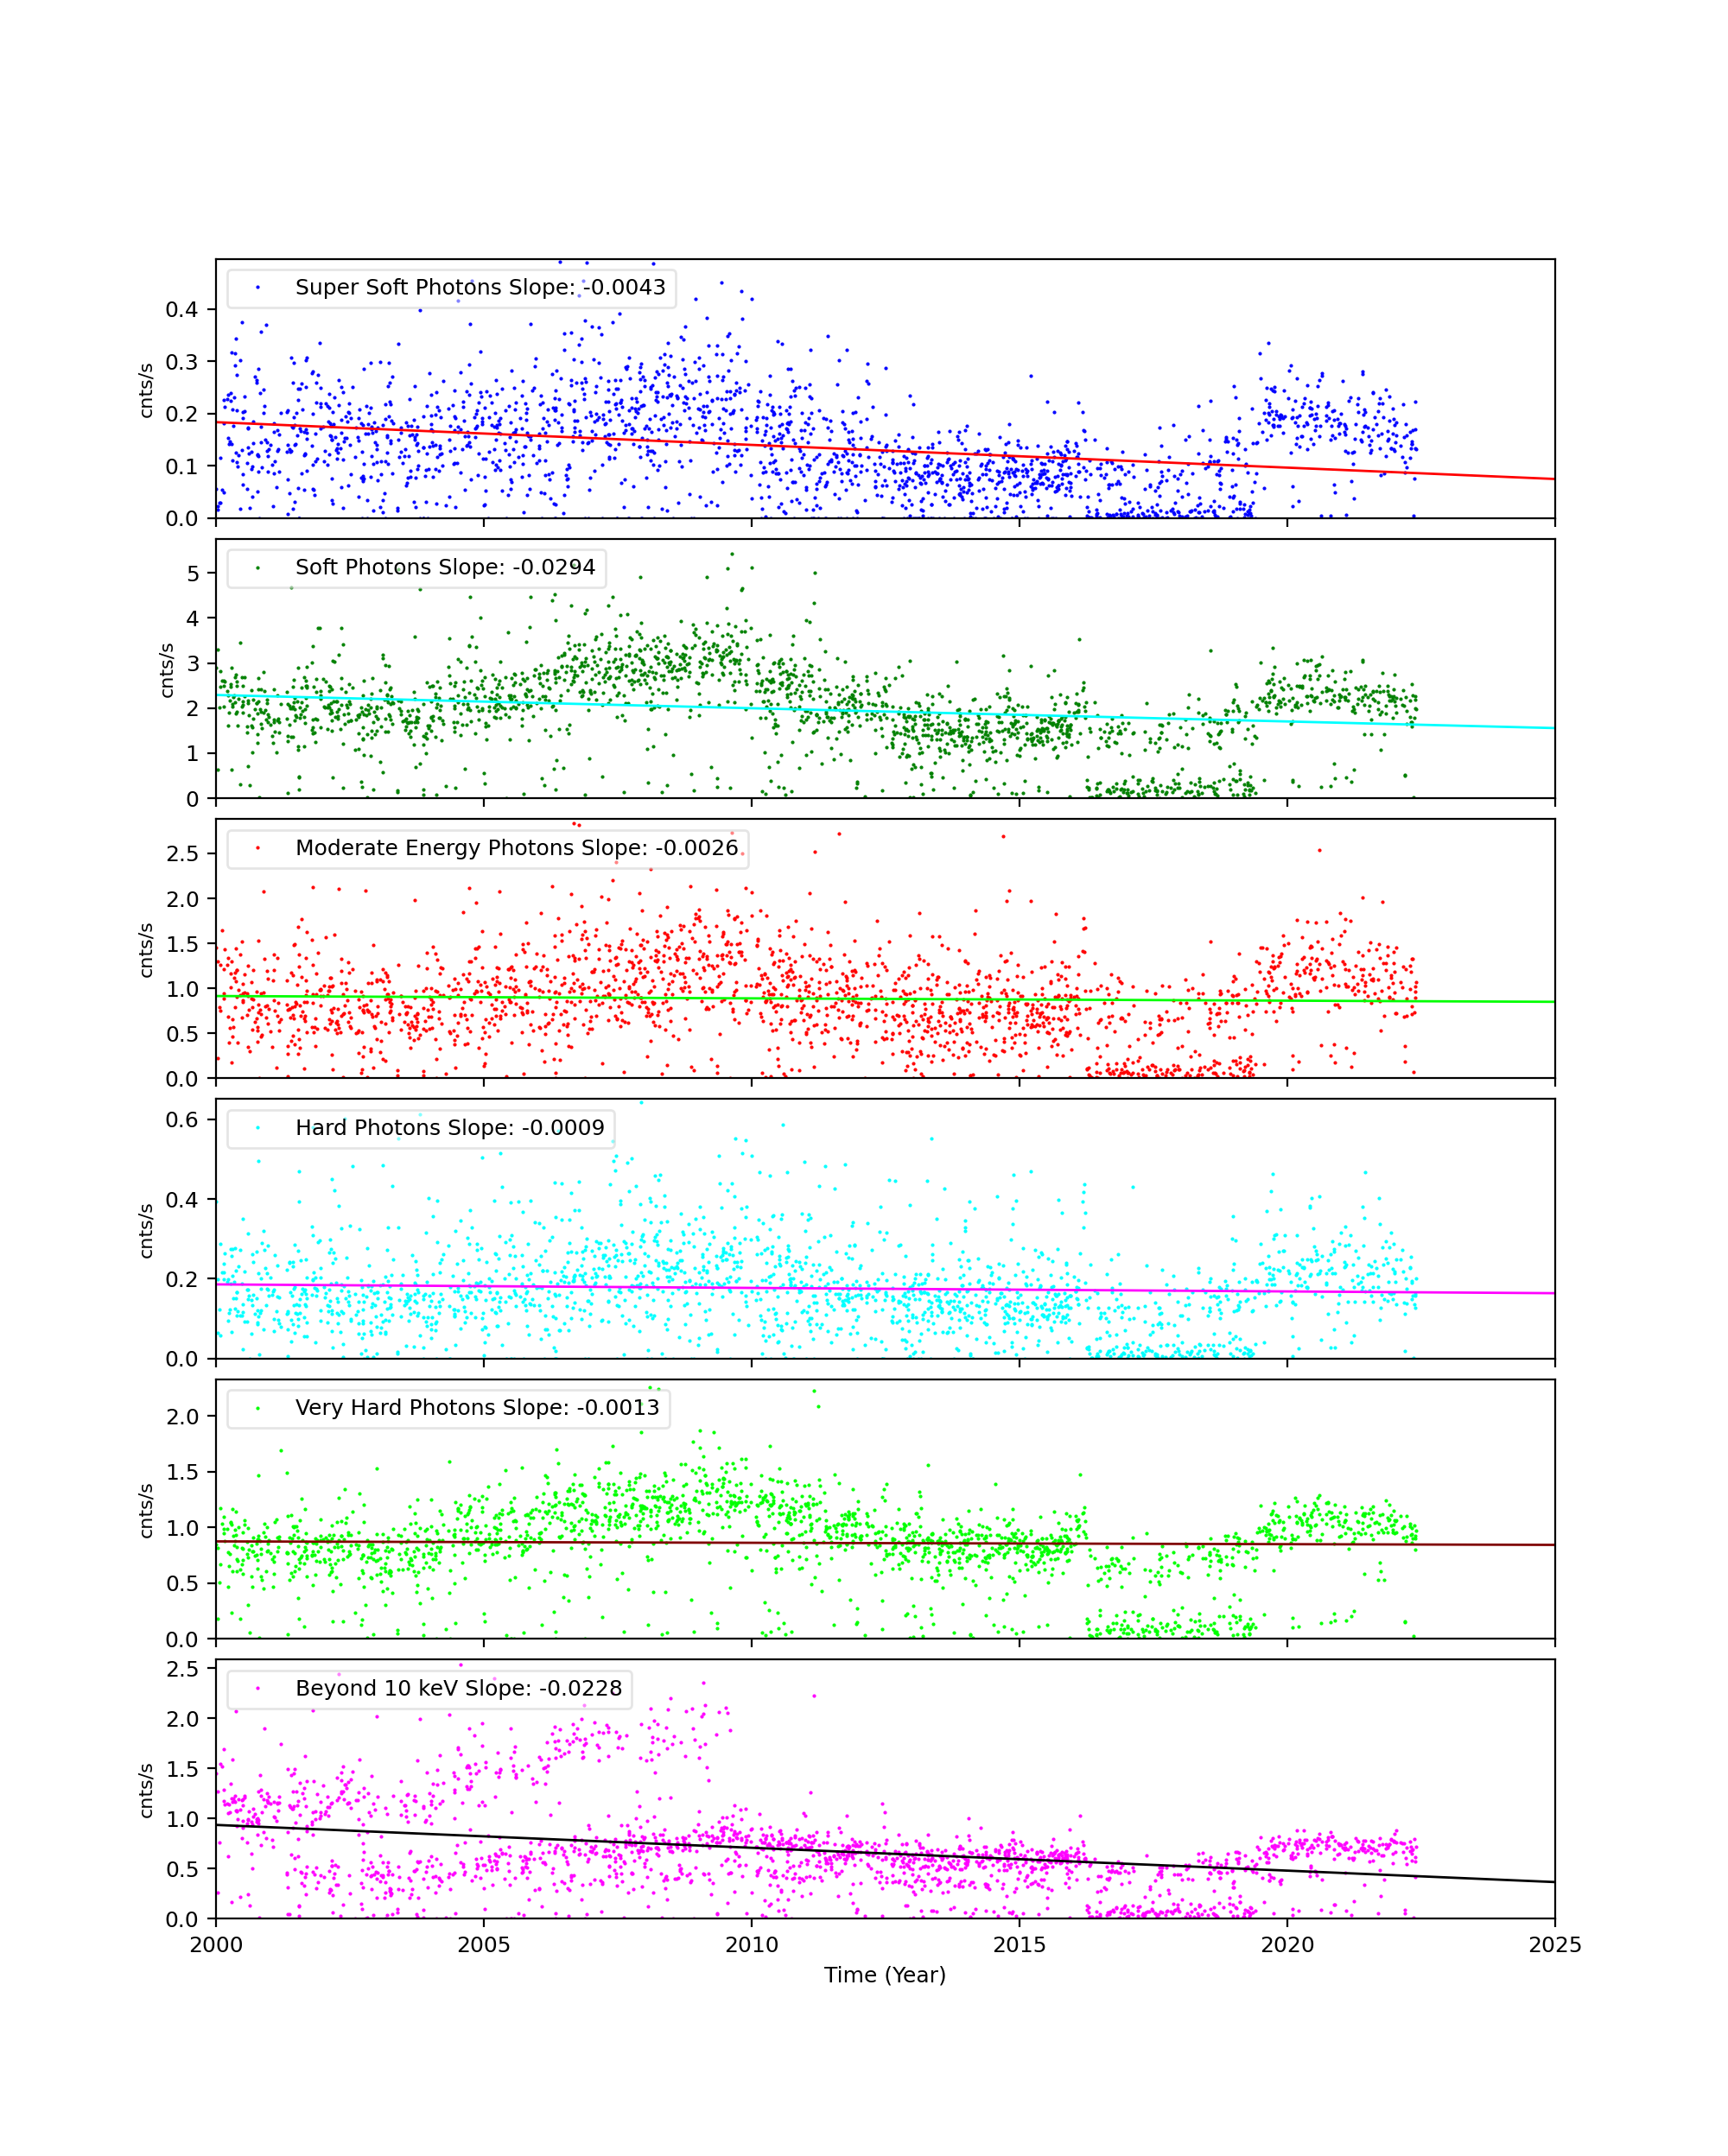
The following three plots show trends of SIB from year 2000. CCDs shown here are CCD3, CCD5, and CCD7. Fitted lines are linear fit after eliminating extreme outliers. For >10 keV plots, 2 lines are fit. One is with a 13 keV filter, and another without.
CCD 3
CCD 5
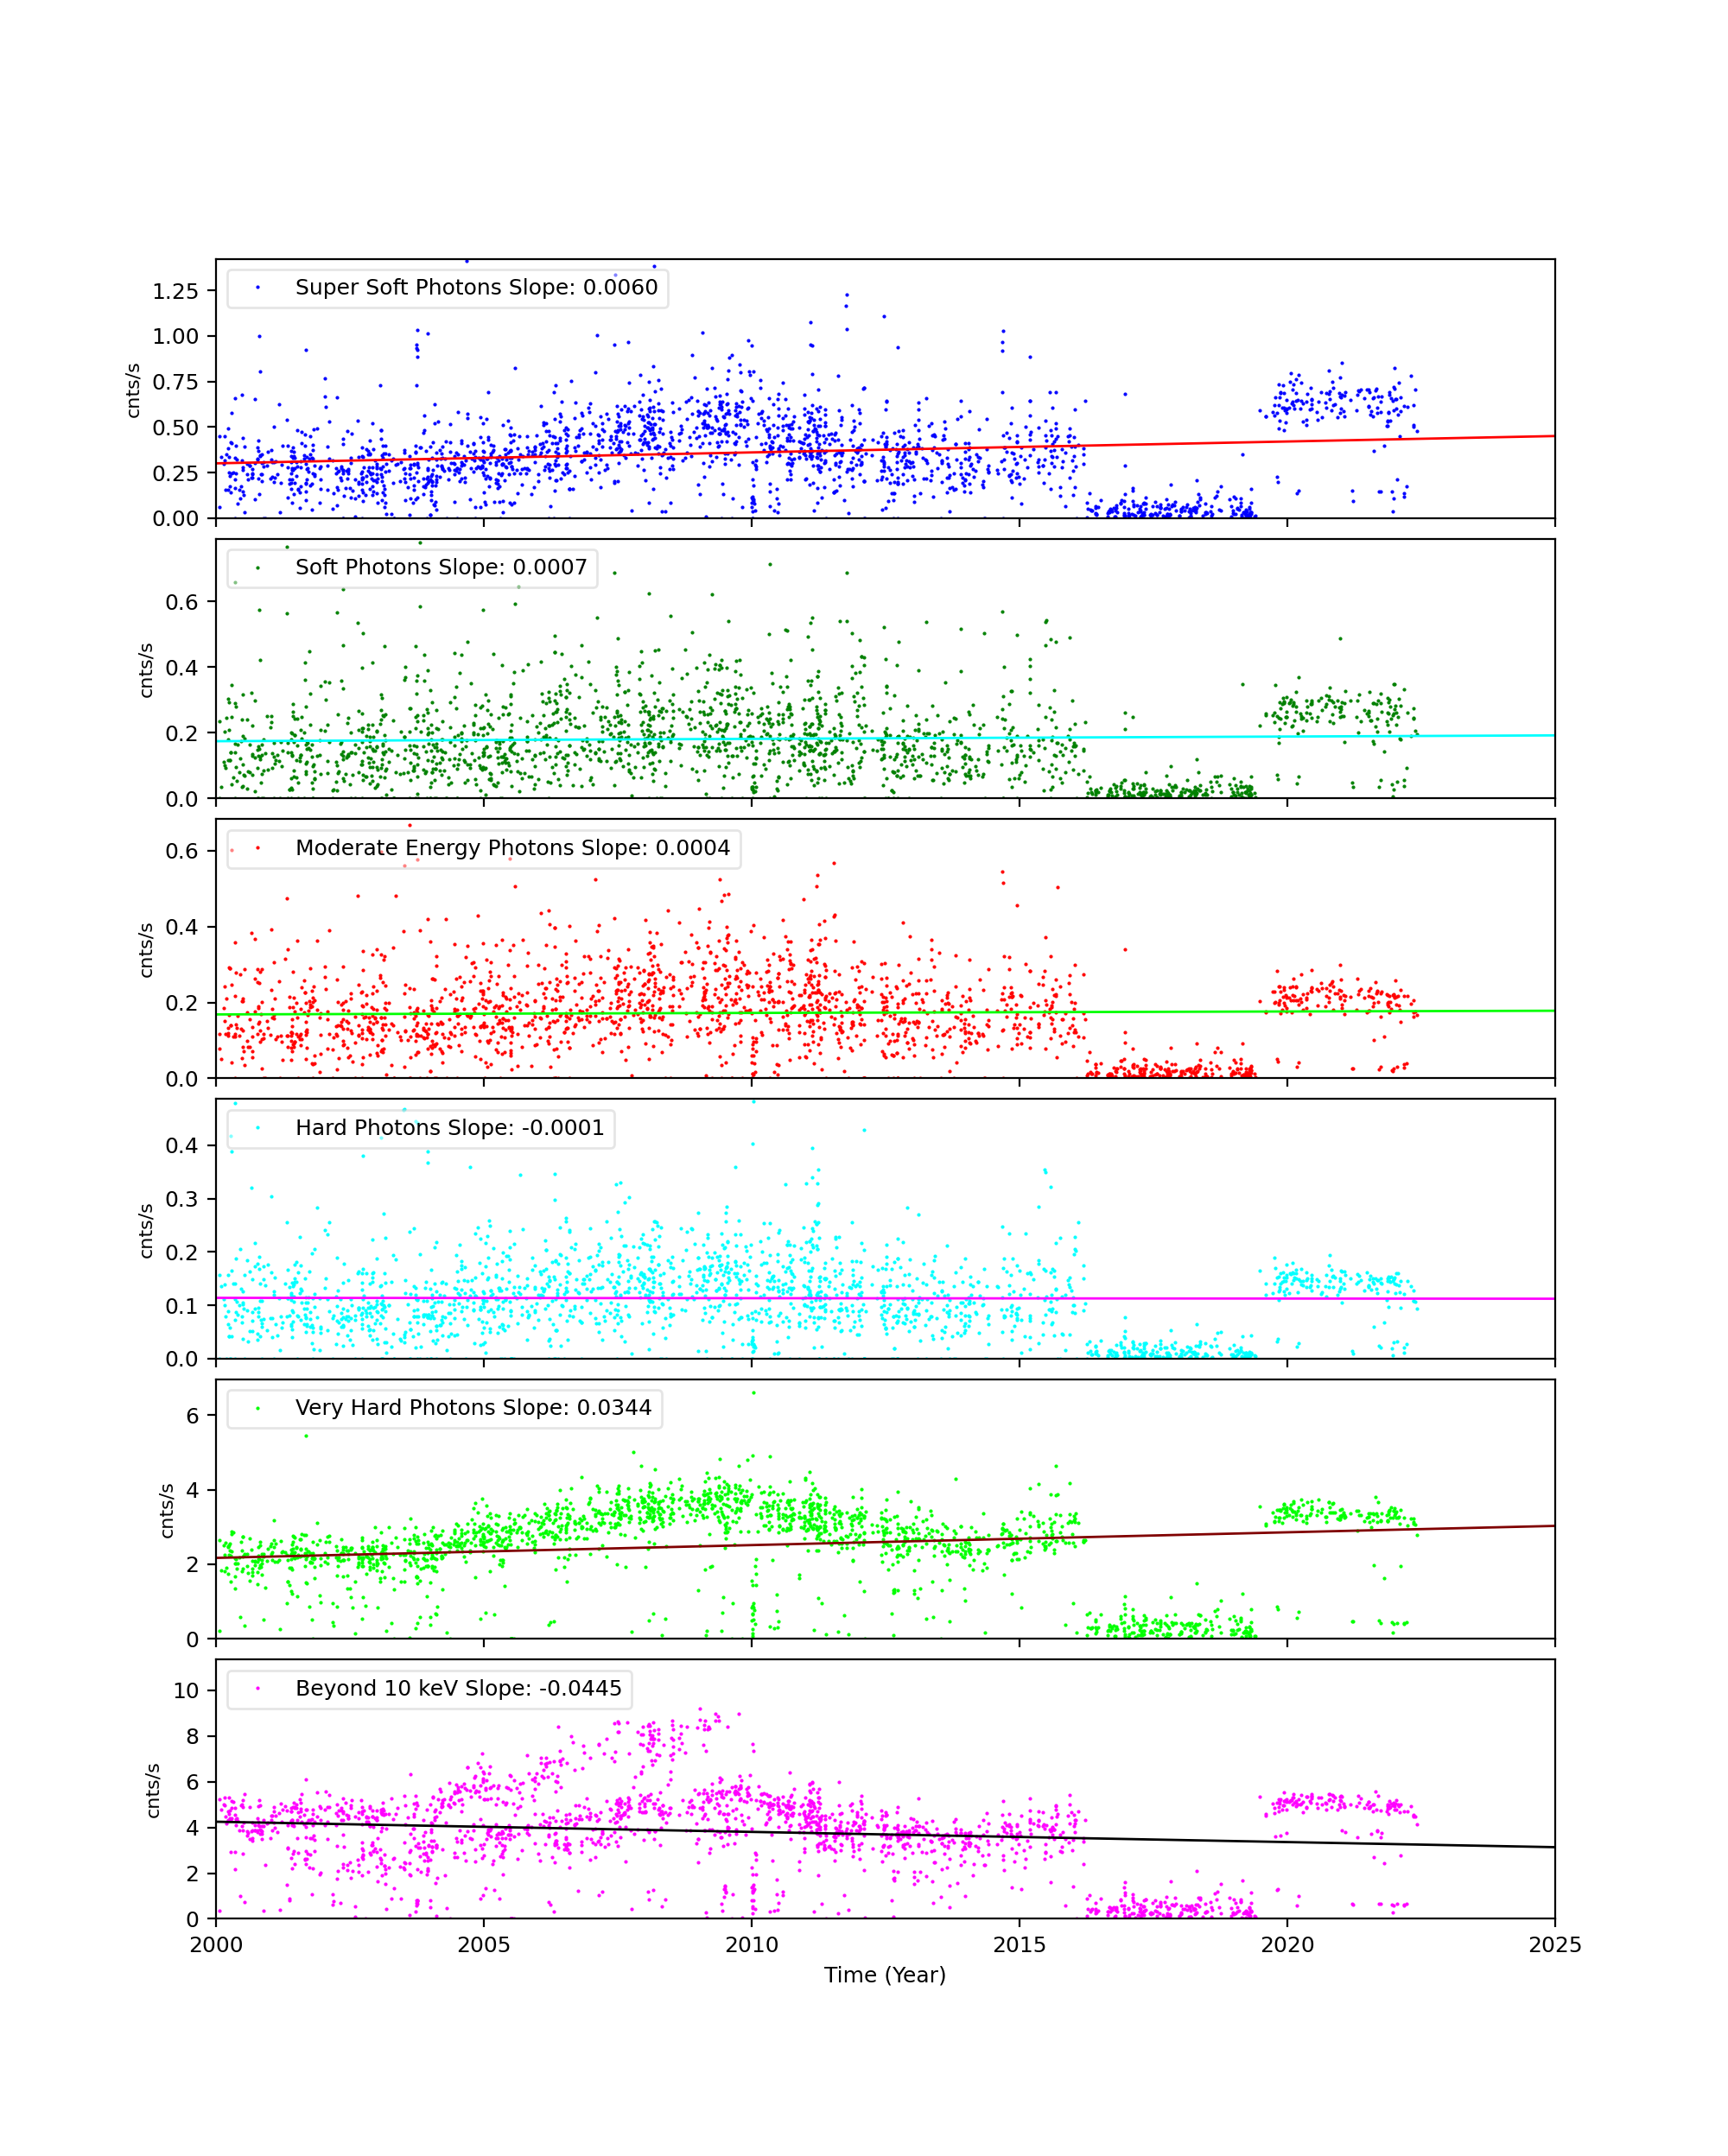
CCD 7
ACIS Histogram Mode Trends
We collected data from acis histogram mode data, and created trend plots of peak portions and peak widths against time (DOM). The peaks were estimated by fitting a simple Gaussian on three peaks (Al, Ti, and Mn), and the widths were estimated by a width at the half max from the peak.
All histogram data are taken under TIMED and GRADED_HIST mode, SIM position is at an external calibration source position, the focal temperature is around -119.7 C, and parameter settings in aciselec, acistemp are set to about same for all.
CCD 3, Peak Position
CCD 3, Peak Widths
CCD 3, Count Rates
HRC
DOSE of Central 4K Pore-Pairs
Please refer to Maximum Dose Trends for more details.
No Data
)
IMAGE                       NPIX      MEAN    STDDEV      MIN       MAX
HRCI_08_1999_05_2022.fits  16777216	na	na	na	na
No Data
)
IMAGE                       NPIX      MEAN    STDDEV      MIN       MAX
HRCS_08_1999_05_2022.fits  16777216	na	na	na	na
|
|
Max dose trend plots corrected for events that "pile-up"
in the center of the taps due to bad position information.
|
)
|
)
|
)
|
)
|
| Feb 2022 | Nov 2021 | Aug 2021 | May 2021 |
|---|
)
|
)
|
)
|
)
|
| Feb 2022 | Nov 2021 | Aug 2021 | May 2021 |
|---|
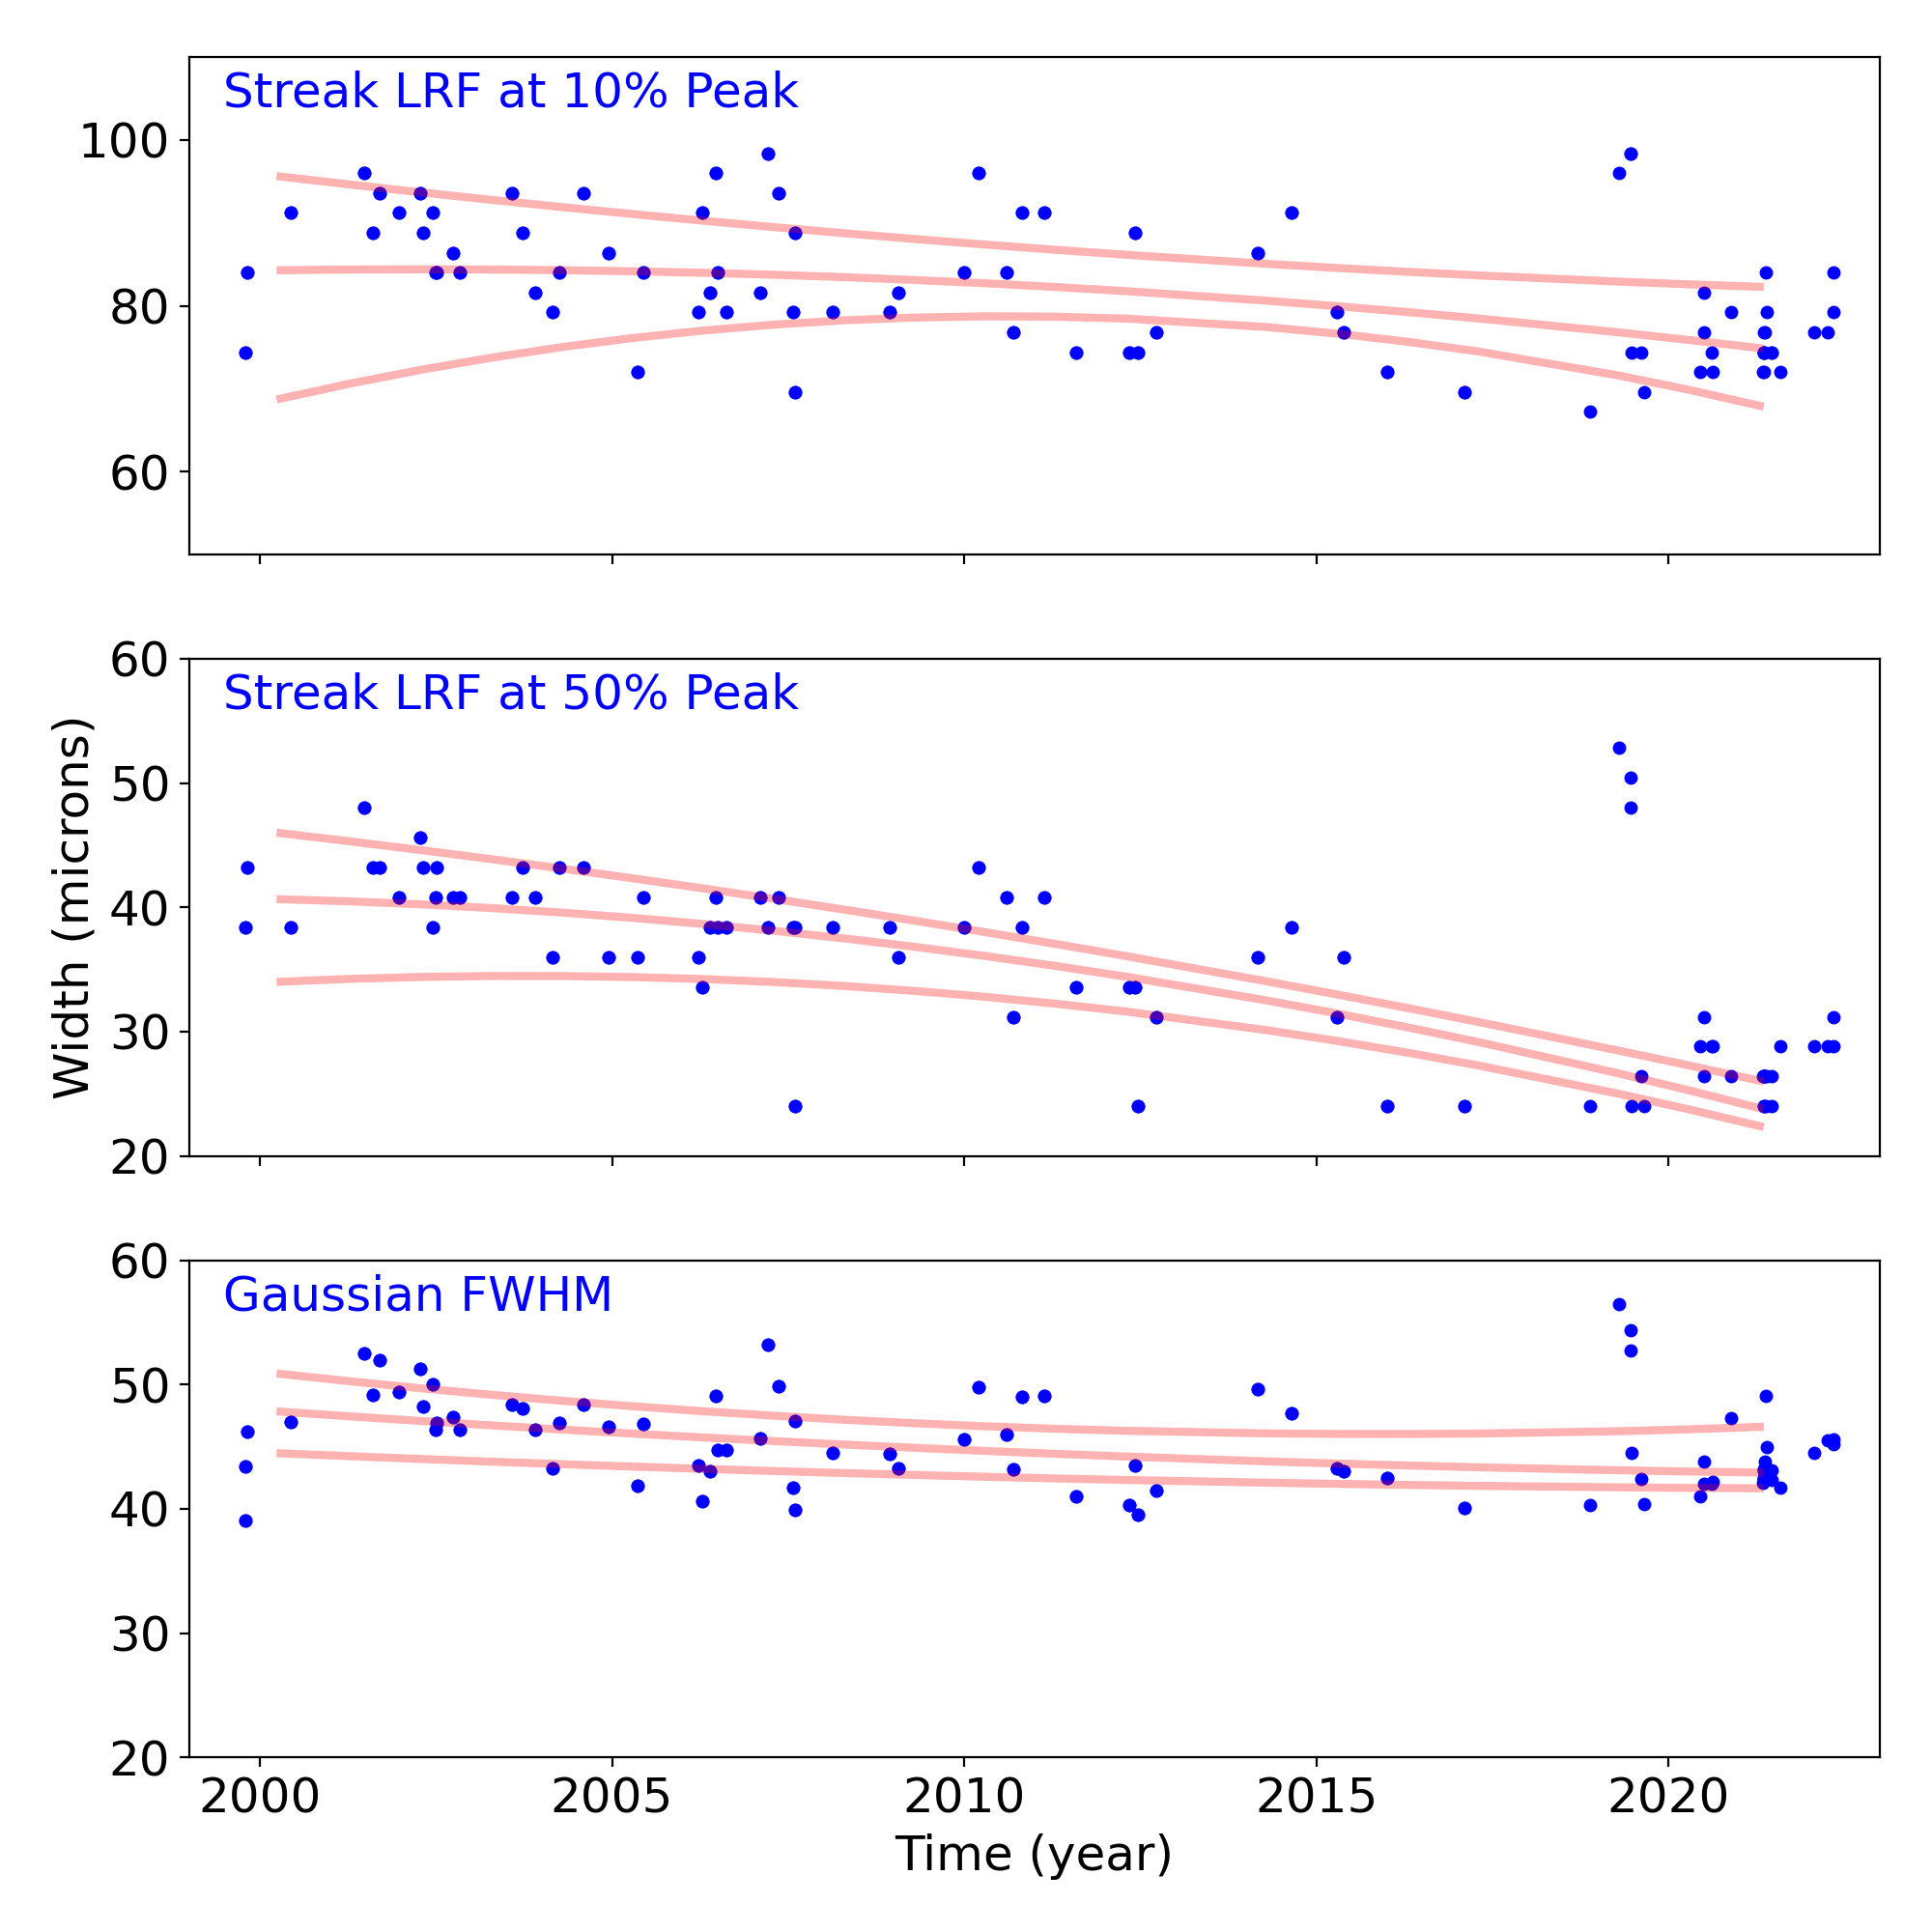
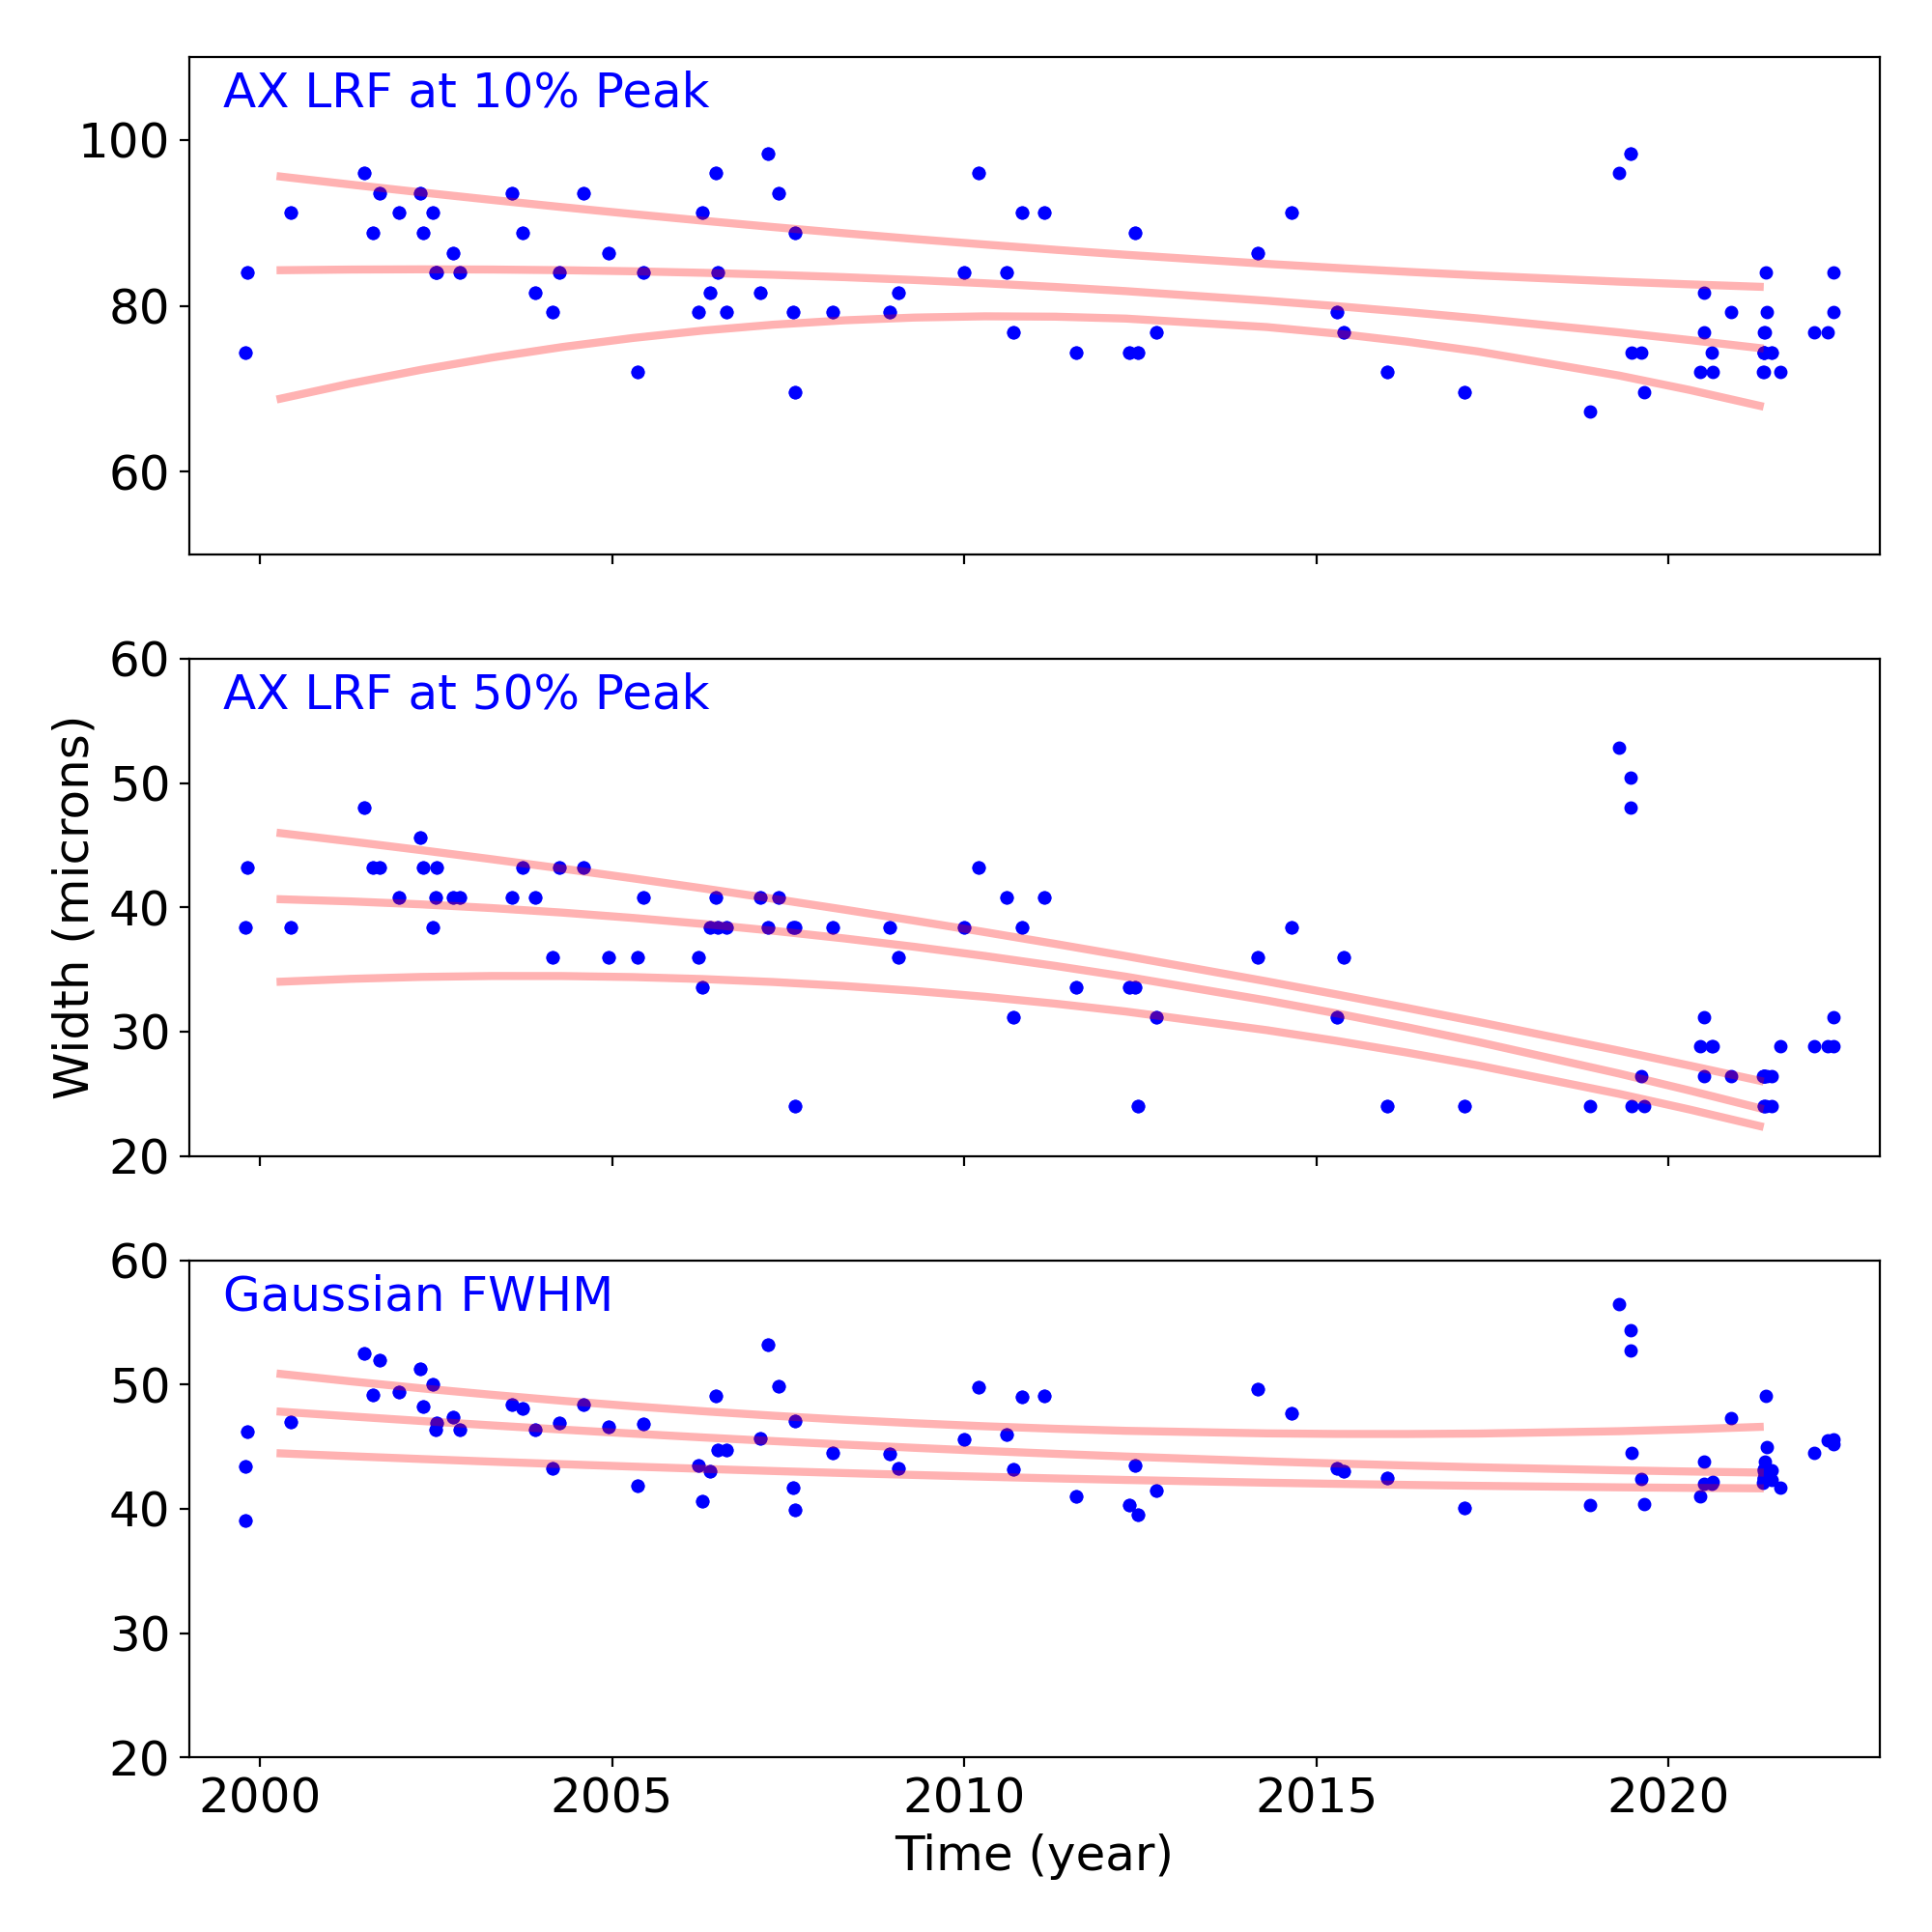
Gratings
Grating Trends/Focus
We plot the width of the zero order streak of ACIS/HETG observations and the width of the zero order image for HRC/LETG observations of point sources. No significant defocusing trend is seen at this time. See Gratings Trends pages.
PCAD
ACA Trending
| ACIS |
)
|
)
|
)
|
|
|---|---|---|---|---|
)
|
)
|
)
| ||
| HRCI |
)
|
)
|
)
|
)
|
| HRCI |
)
|
)
|
)
|
)
|
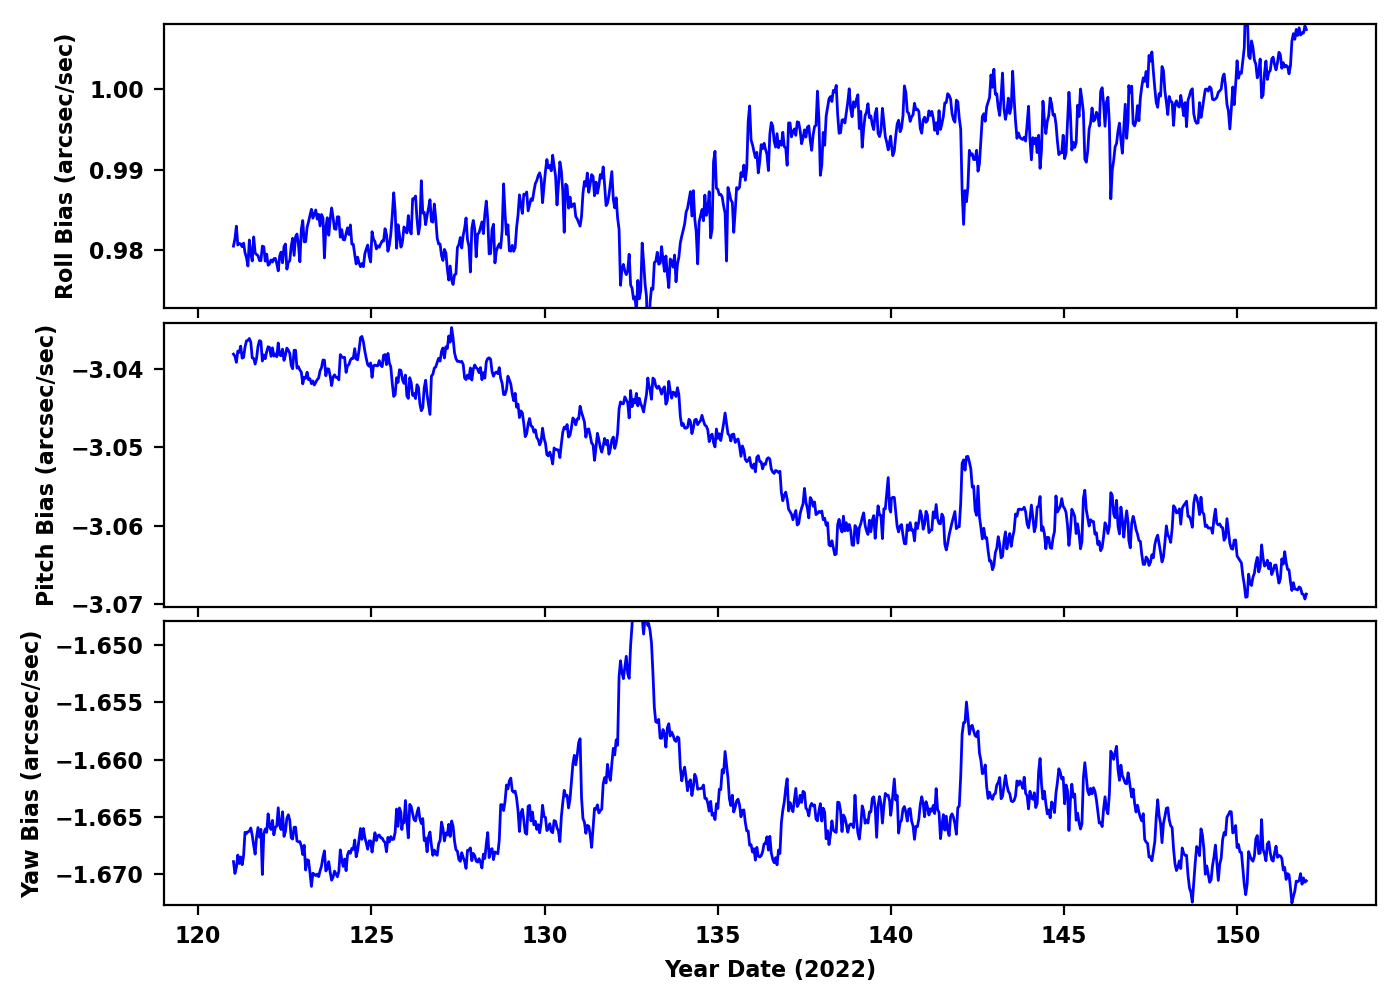
Gyro Bias Drift
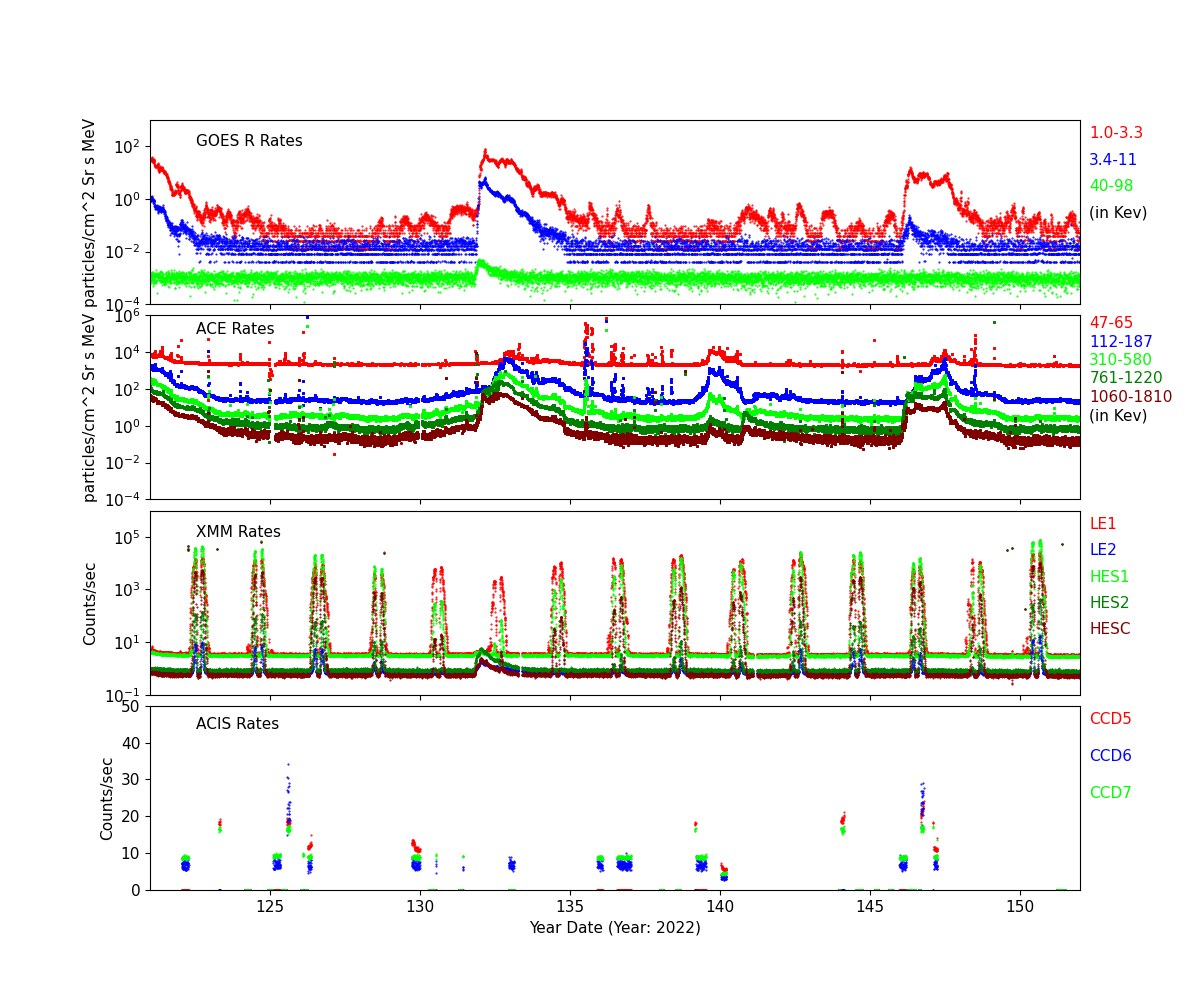
Radiation History
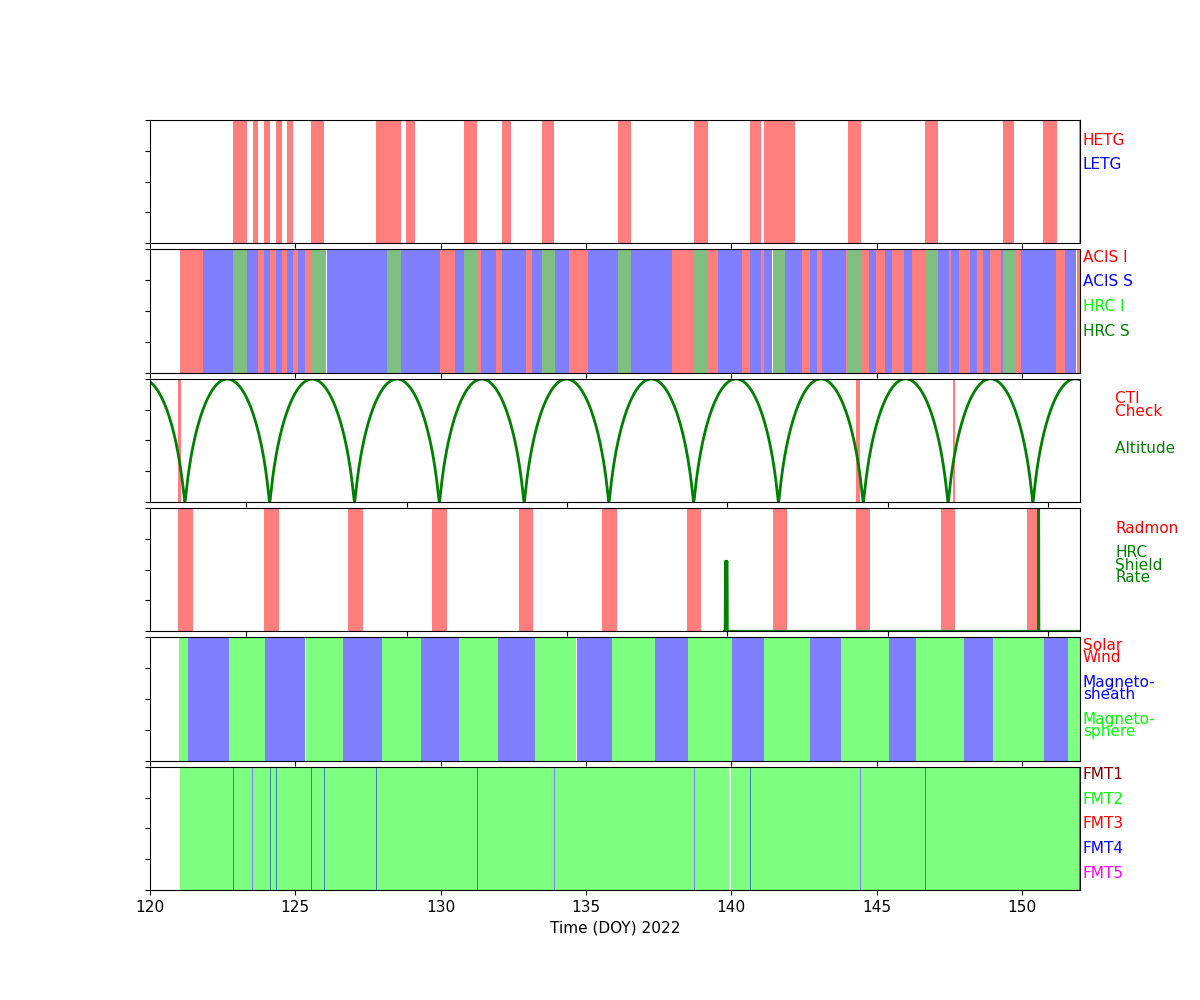
Radiation Count Rates of May 2022
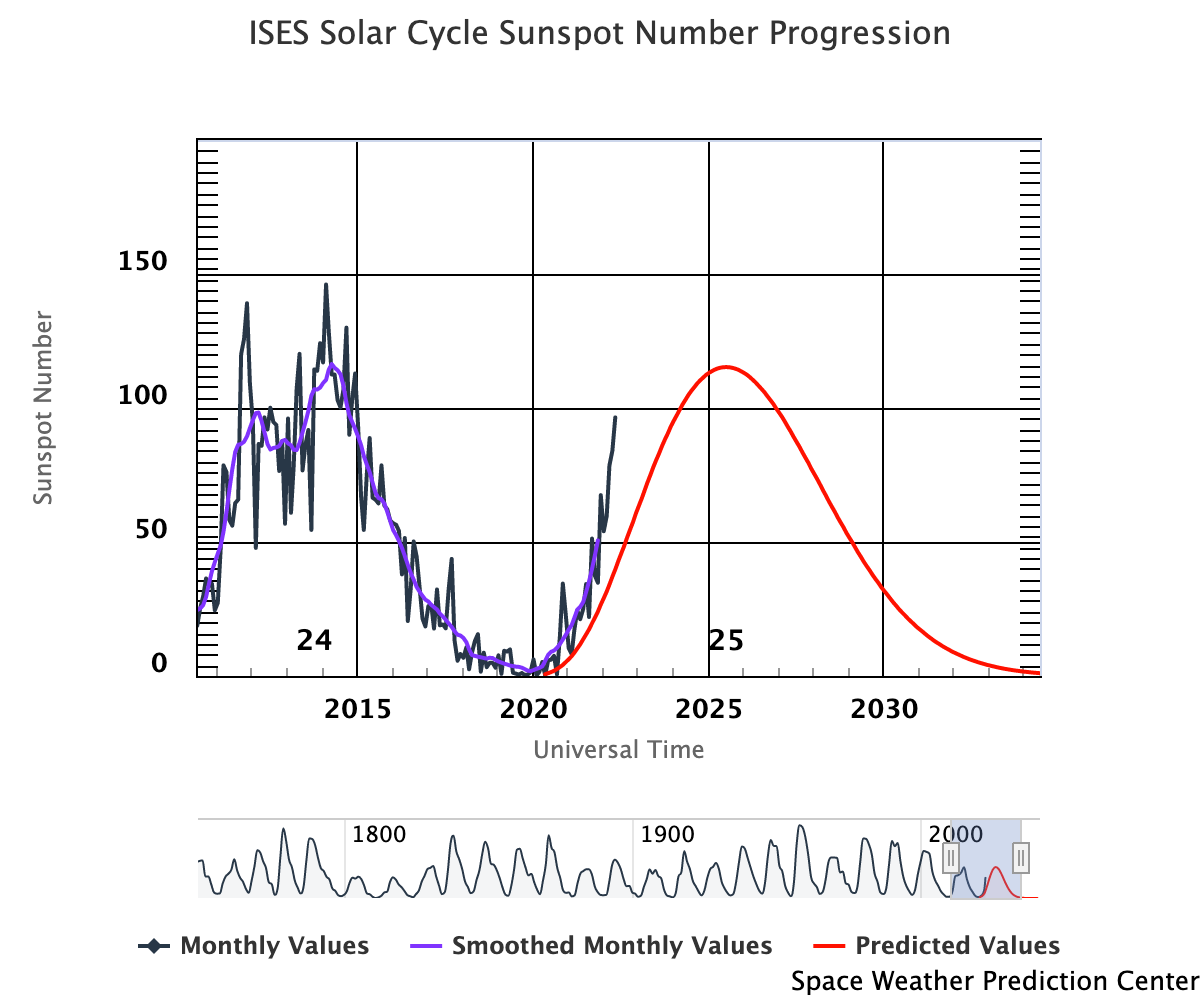
Sun Spot History (See:NOAA Page)
Trending
Quarterly Trends
- HRMA Heater
| Previous Quarter | |||||||
| MSID | MEAN | RMS | DELTA/YR | DELTA/YR/YR | UNITS | DESCRIPTION | |
| ohrthr03 | 3.548e-04 | 1.600e-05 | (2.95+/-0.00)e2 | 0.00 +/- 0.01 | K | RT 5: HRMA FORWARD APERTURE PLATE | |
|---|---|---|---|---|---|---|---|
| ohrthr09 | 0.003 | 1.250e-04 | (2.96+/-0.00)e2 | -0.25 +/- 0.05 | K | RT 105: HRMA CAP | |
| ohrthr17 | 0.003 | 1.342e-04 | (2.96+/-0.00)e2 | -0.27 +/- 0.05 | K | RT 125: HSA OUTER CYNLINDER | |
| ohrthr24 | 0.004 | 2.595e-04 | (2.97+/-0.01)e2 | -0.56 +/- 0.15 | K | RT 12: HRMA AFT HEATER PLATE | |
| ohrthr38 | 0.006 | 7.525e-04 | (3.00+/-0.02)e2 | -1.86 +/- 0.57 | K | RT 120: HRMA AFT COLLIMATOR OUTER CYLINDER | |
| ohrthr52 | 0.003 | 1.304e-04 | (2.96+/-0.00)e2 | -0.25 +/- 0.05 | K | RT 100: HRMA CAP | |
- HRMA Thermal
| Previous Quarter | |||||||
| MSID | MEAN | RMS | DELTA/YR | DELTA/YR/YR | UNITS | DESCRIPTION | |
| 4rt568t | 0.006 | 7.992e-04 | (3.00+/-0.02)e2 | -1.83 +/- 0.60 | K | RT 568 - HRMA TEMP | |
|---|---|---|---|---|---|---|---|
| 4rt569t | 0.004 | 2.281e-04 | (2.97+/-0.01)e2 | -0.46 +/- 0.13 | K | RT 569 - HRMA TEMP | |
| 4rt570t | 0.003 | 1.143e-04 | (2.96+/-0.00)e2 | -0.20 +/- 0.05 | K | RT 570 - HRMA TEMP | |
| 4rt575t | 0.007 | 0.001 | (3.05+/-0.02)e2 | -2.47 +/- 0.80 | K | RT 575 - OB CONE TEMP | |
| 4rt576t | 0.007 | 7.965e-04 | (2.95+/-0.02)e2 | -1.94 +/- 0.61 | K | RT 576 - OB CONE TEMP | |
| 4rt578t | 0.010 | 0.001 | (3.02+/-0.03)e2 | -3.52 +/- 0.96 | K | RT 578 - OB CONE TEMP | |
- MUPS
| Previous Quarter | |||||||
| MSID | MEAN | RMS | DELTA/YR | DELTA/YR/YR | UNITS | DESCRIPTION | |
| pm1thv1t | -0.002 | 0.007 | (3.53+/-0.16)e2 | -0.66 +/- 3.02 | K | MUPS 1 THRUSTER VALVE 01 TEMP | |
|---|---|---|---|---|---|---|---|
| pline02t | -0.004 | 0.005 | (3.35+/-0.12)e2 | -2.78 +/- 2.84 | K | PROP LINE TEMP 02 | |
| pline03t | -0.008 | 0.006 | (3.29+/-0.14)e2 | -2.48 +/- 2.63 | K | PROP LINE TEMP 03 | |
| pline04t | -0.016 | 0.005 | (3.17+/-0.11)e2 | -4.46 +/- 2.70 | K | PROP LINE TEMP 04 | |
Spacecraft Motions
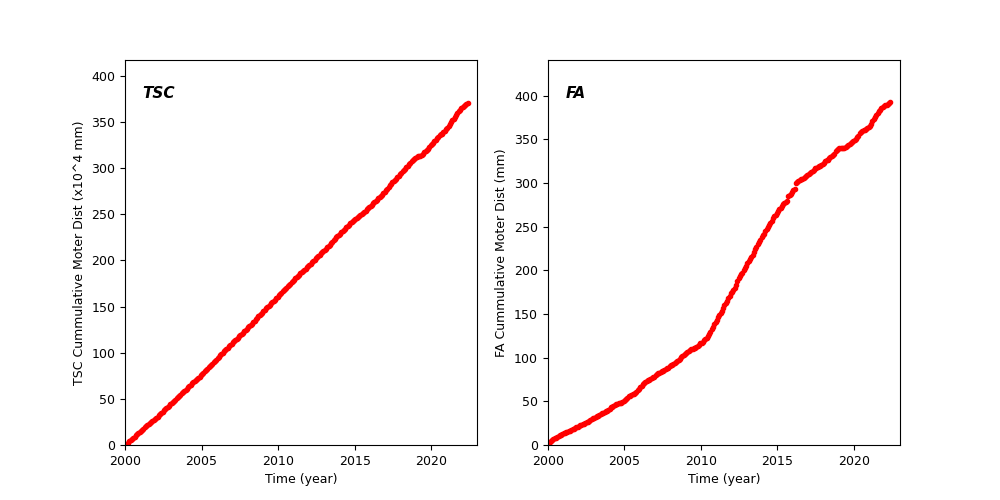
TSC and FA Cummulative Moter Distance
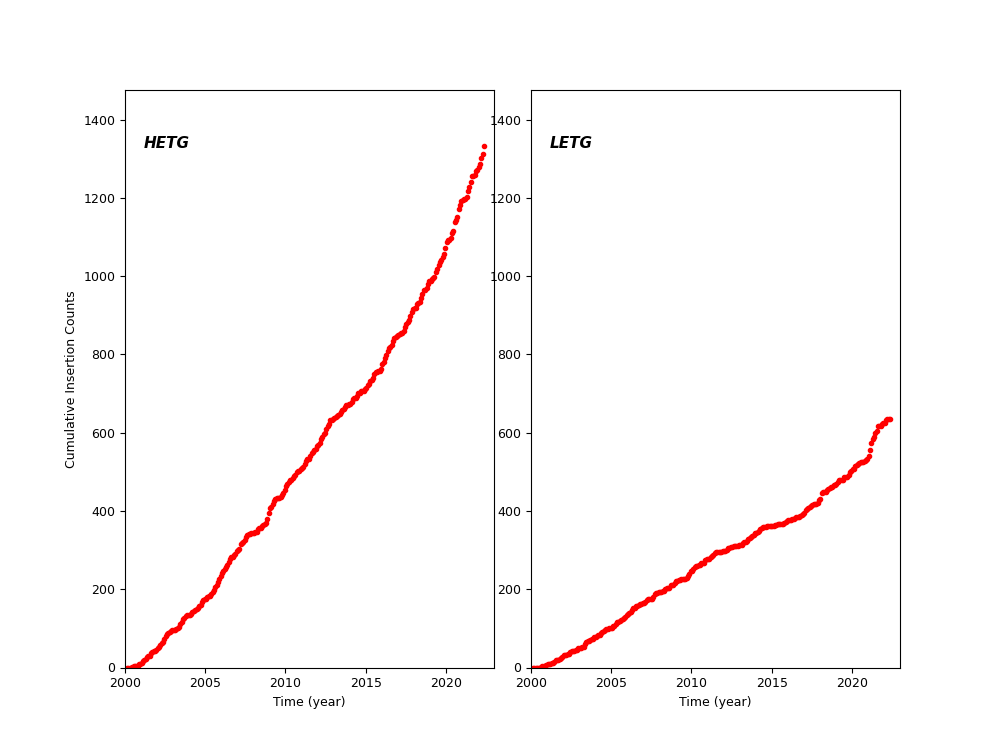
HETG and LETG Cummulative Insertion Counts
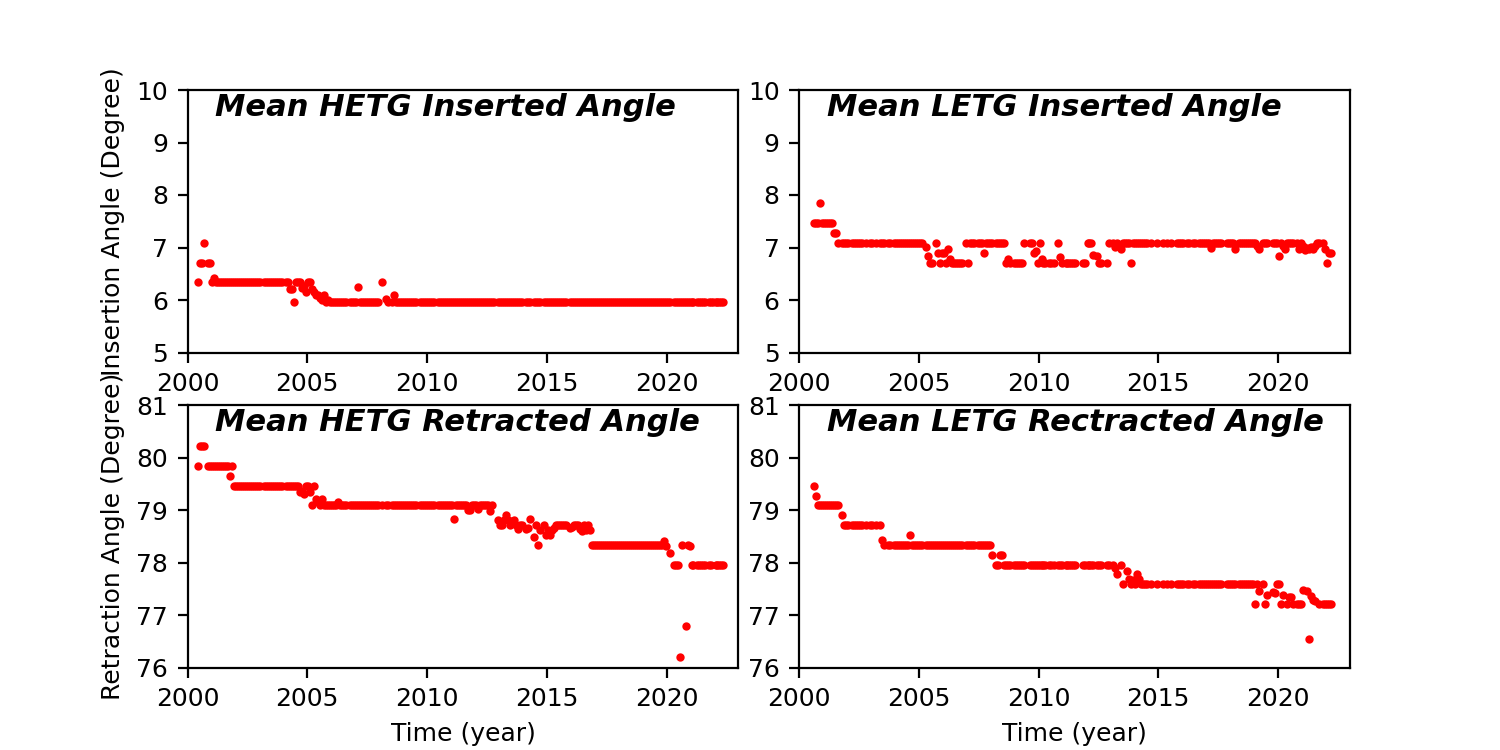
HETG/LETG Insertion/Retraction Angle
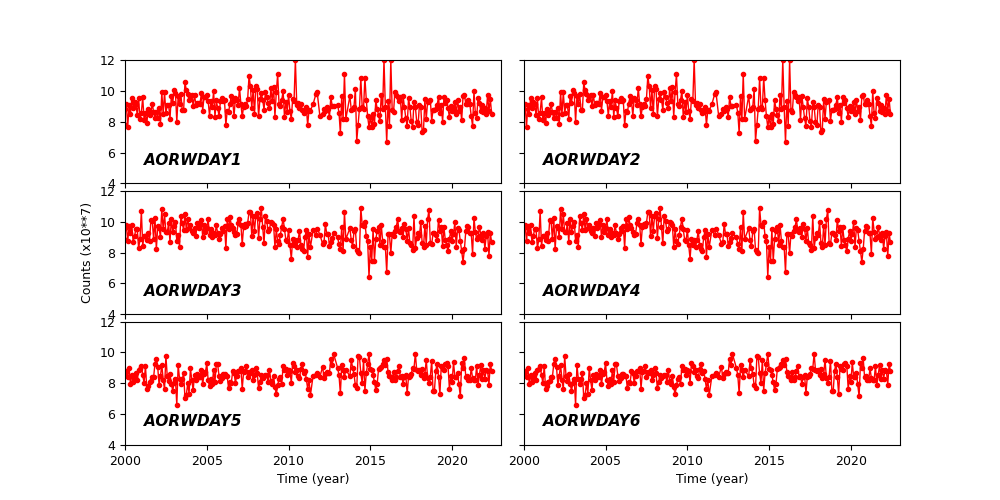
Reaction Wheel Rotations